HR Analytics Dashboard Development
Adeel Siddiqui
HR Analytics Dashboard | Power BI
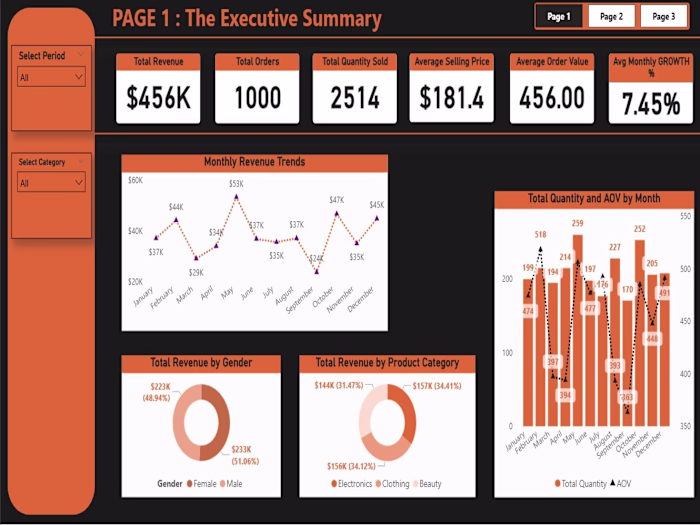
A premium 3-page executive HR Analytics Dashboard built in Power BI to analyze workforce structure, employee performance, and talent retention strategy.
This project focuses on helping leadership identify workforce risks, performance gaps, attrition patterns, and recruitment effectiveness using strategic KPI reporting and business-focused visual storytelling.
Dashboard Overview
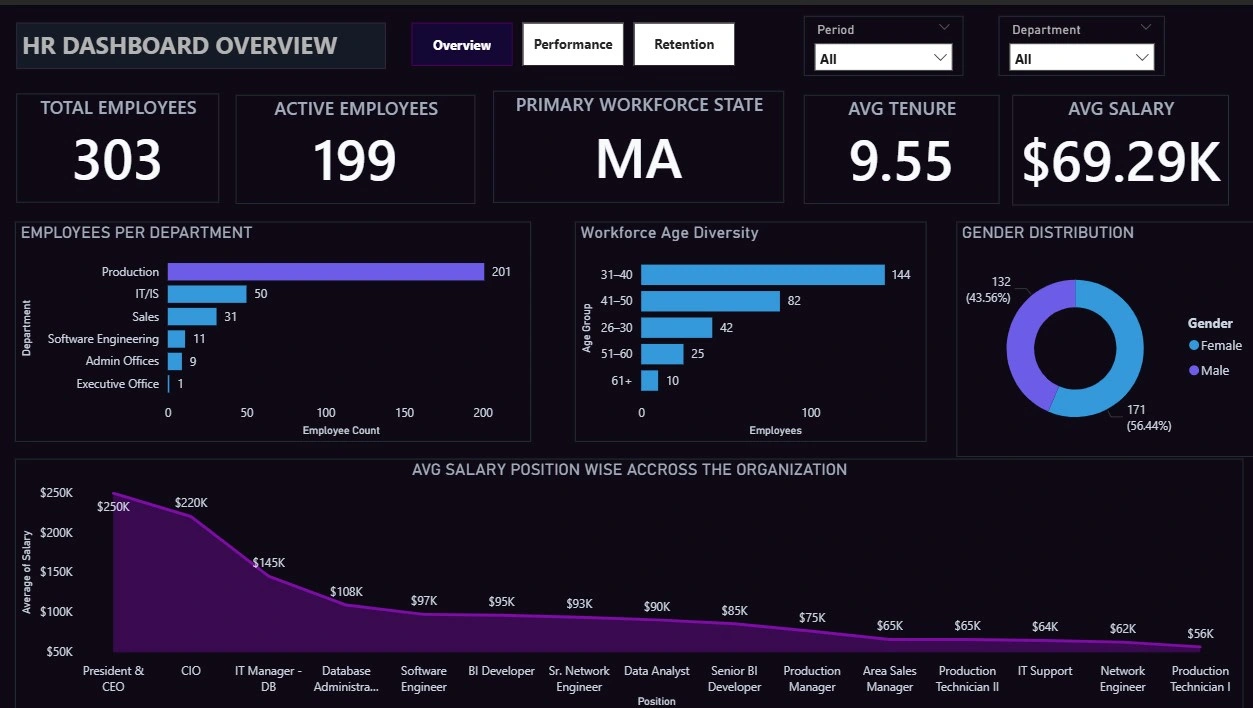
Page 1 — Workforce Overview
Focus: Understanding workforce composition and organizational structure.
KPI Cards
Total Employees
Active Employees
Primary Workforce State
Average Tenure
Average Salary
Key Visuals
Employees per Department
Gender Distribution
Workforce Age Diversity
Average Salary by Role
Workforce State Overview
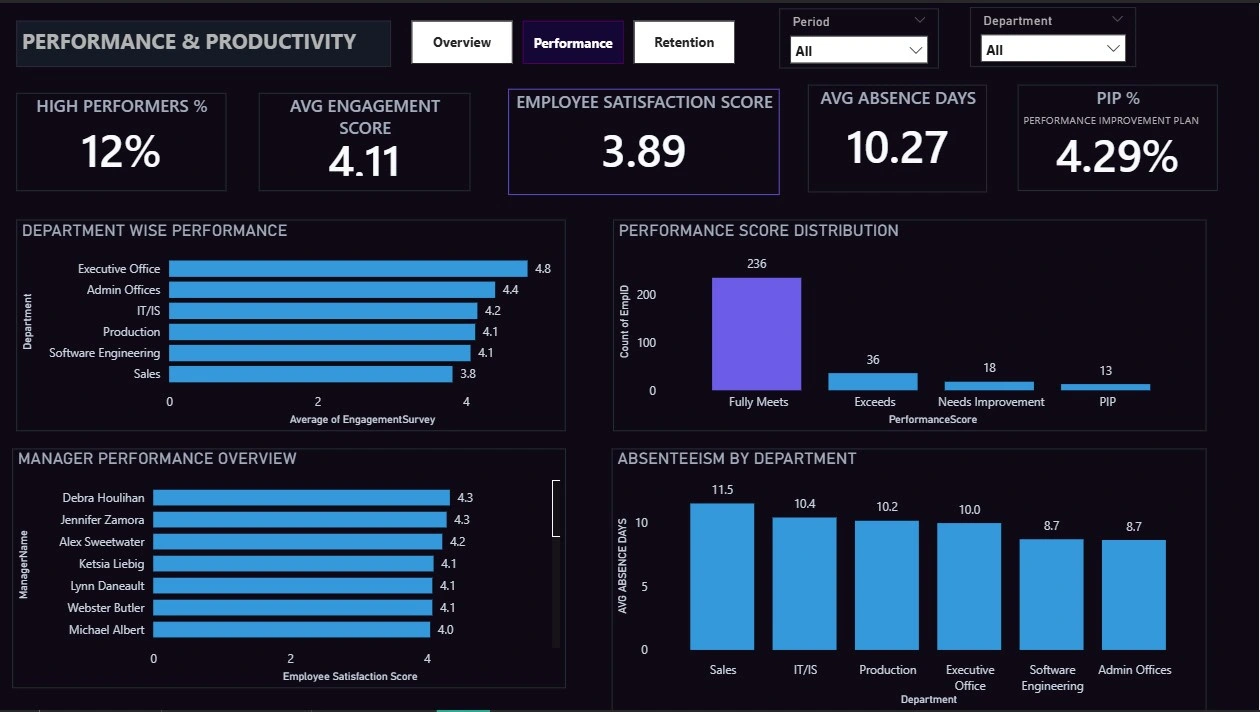
Page 2 — Performance & Productivity
Focus: Measuring employee performance, engagement, and operational productivity.
KPI Cards
High Performers %
Average Engagement Score
Employee Satisfaction Score
Average Absence Days
PIP % (Performance Improvement Plan)
Key Visuals
Performance Score Distribution
Department-wise Performance
Manager Performance Overview
Absenteeism by Department
Performance Improvement Analysis
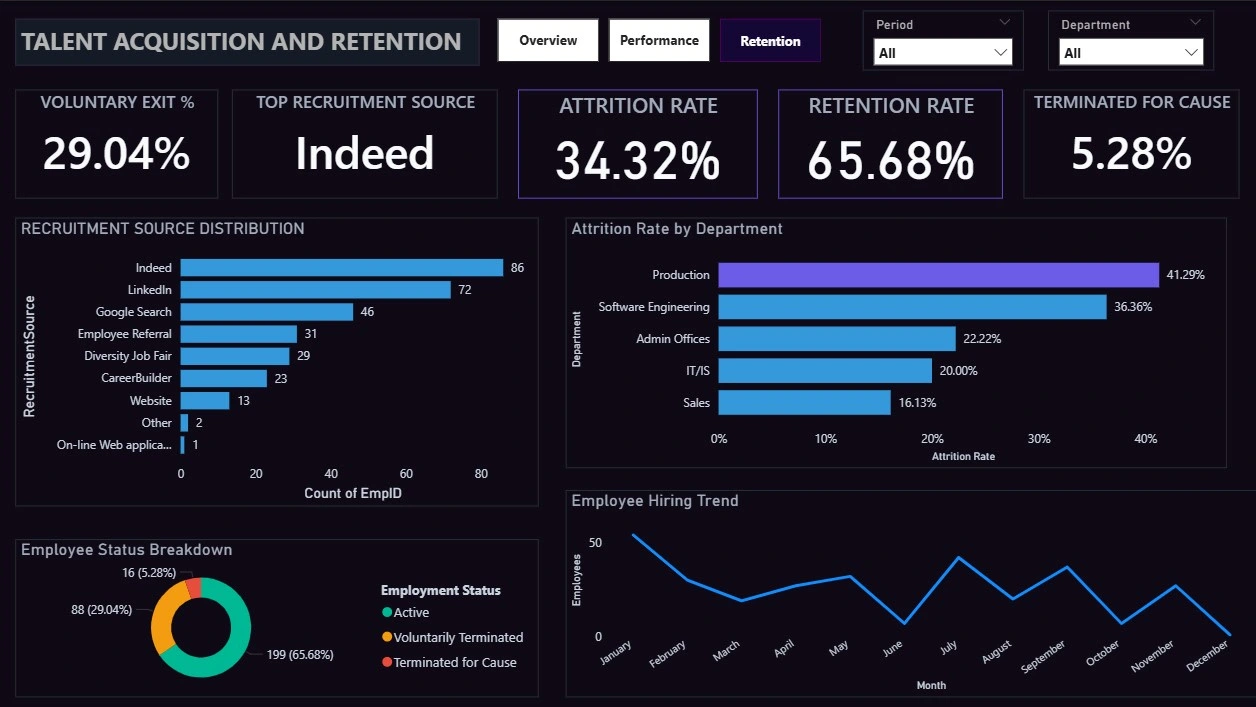
Page 3 — Talent Acquisition and Retention
Focus: Hiring quality, attrition control, and long-term retention strategy.
KPI Cards
Voluntary Exit %
Top Recruitment Source
Attrition Rate
Retention Rate
Terminated for Cause %
Key Visuals
Recruitment Source Distribution
Attrition Rate by Department
Employee Hiring Trend
Employee Status Breakdown
Retention Insights
Business Insights Generated
Production department shows the highest attrition burden
Sales records the highest average absence days
Only 12% of employees fall under high performers
PIP employees highlight critical performance concerns
Indeed and LinkedIn drive the strongest recruitment inflow
Workforce concentration is heavily centered in the primary operating state
Manager-level performance differences reveal leadership impact on satisfaction
Tools Used
Power BI
DAX
Data Modeling
KPI Framework Design
Workforce Analytics
HR Performance Analysis
Talent Retention Strategy
Dashboard Features
Executive-level dark premium UI theme
Strategic 3-page navigation structure
Interactive slicers for period and department
Business-focused KPI architecture
Premium consulting-style storytelling
Portfolio-ready and client-delivery standard design
Files Included
.pbix Power BI project fileDashboard PDF export
Project screenshots
README documentation
Author
Built by Adeel Siddique
Focused on Data Analytics, Power BI, SQL, Python, and business-driven dashboard design.
Like this project
Posted Apr 28, 2026
Built a 3-page HR analytics dashboard in Power BI for workforce analysis and strategic insights.
Likes
0
Views
5