HedgeID Internal Dashboard Data Insights & Workflow Optimization

Mian Zain


From fragmented data to unified insight — HedgeID’s dashboard in action
Case Study
The client came with an idea: HedgeID needed a tool to tame data chaos. Their team worked with many sources — market participants, signals, entity records — and needed to validate, enrich, and display data. They wanted internal dashboards so analysts, operations, and leadership could monitor key metrics without chasing spreadsheets or manual reports.
The challenge was clear:
The internal workflows were fragmented. Manual data validation, delayed dashboards, and inconsistent reporting made it hard for the team to operate efficiently. They lacked real-time visibility into “entities validated”, “signals processed”, “active contributors”, or “data freshness” all in one place.
My solution:
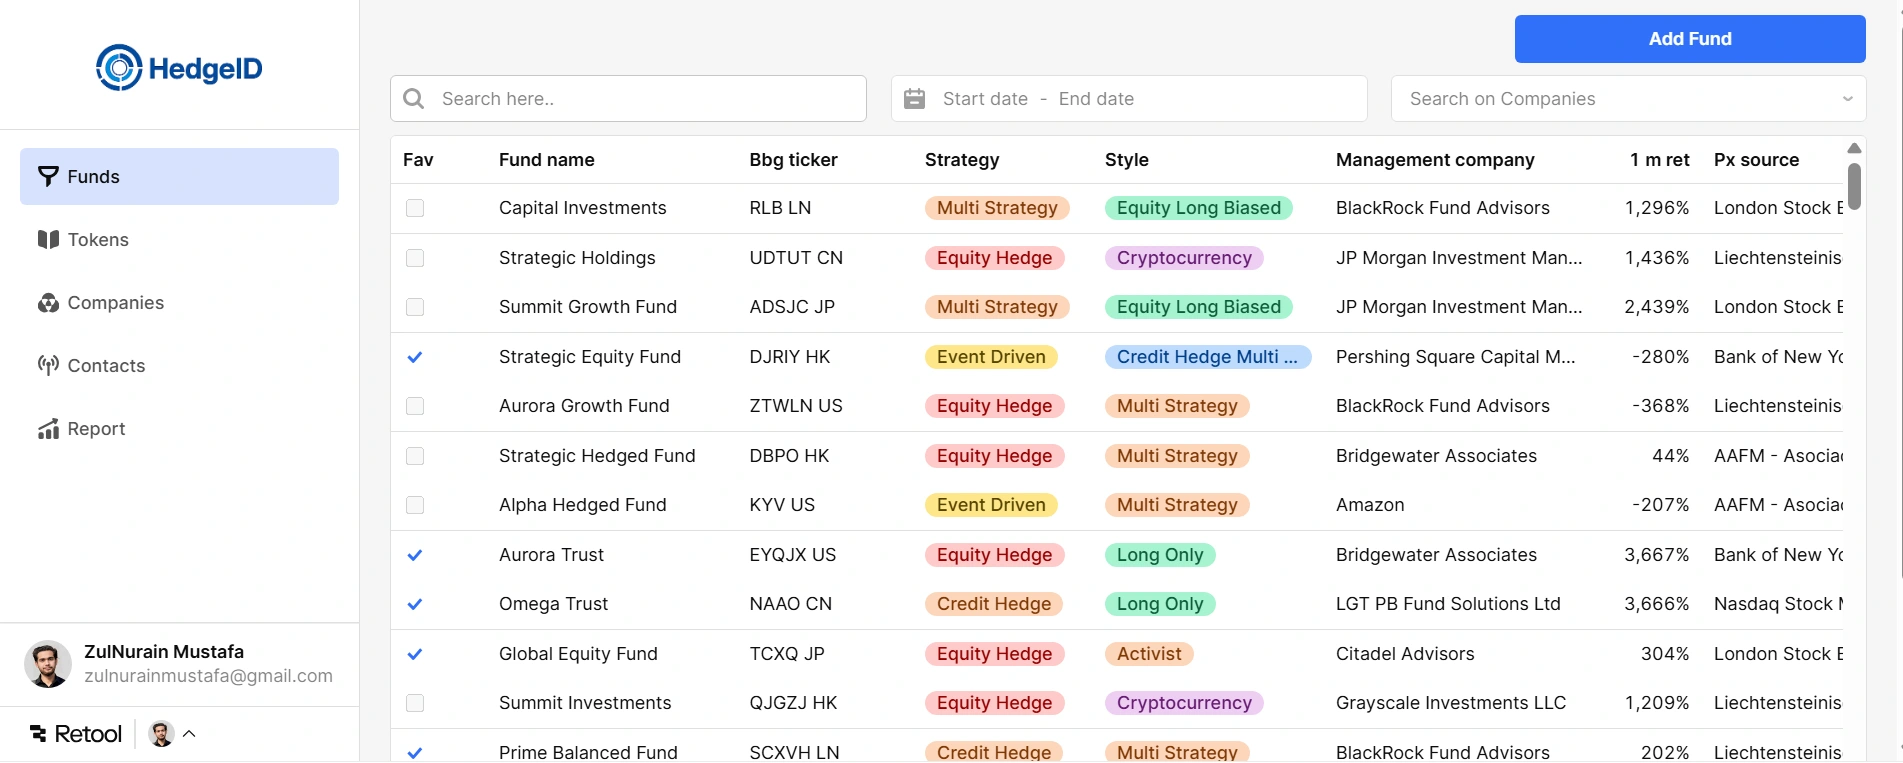
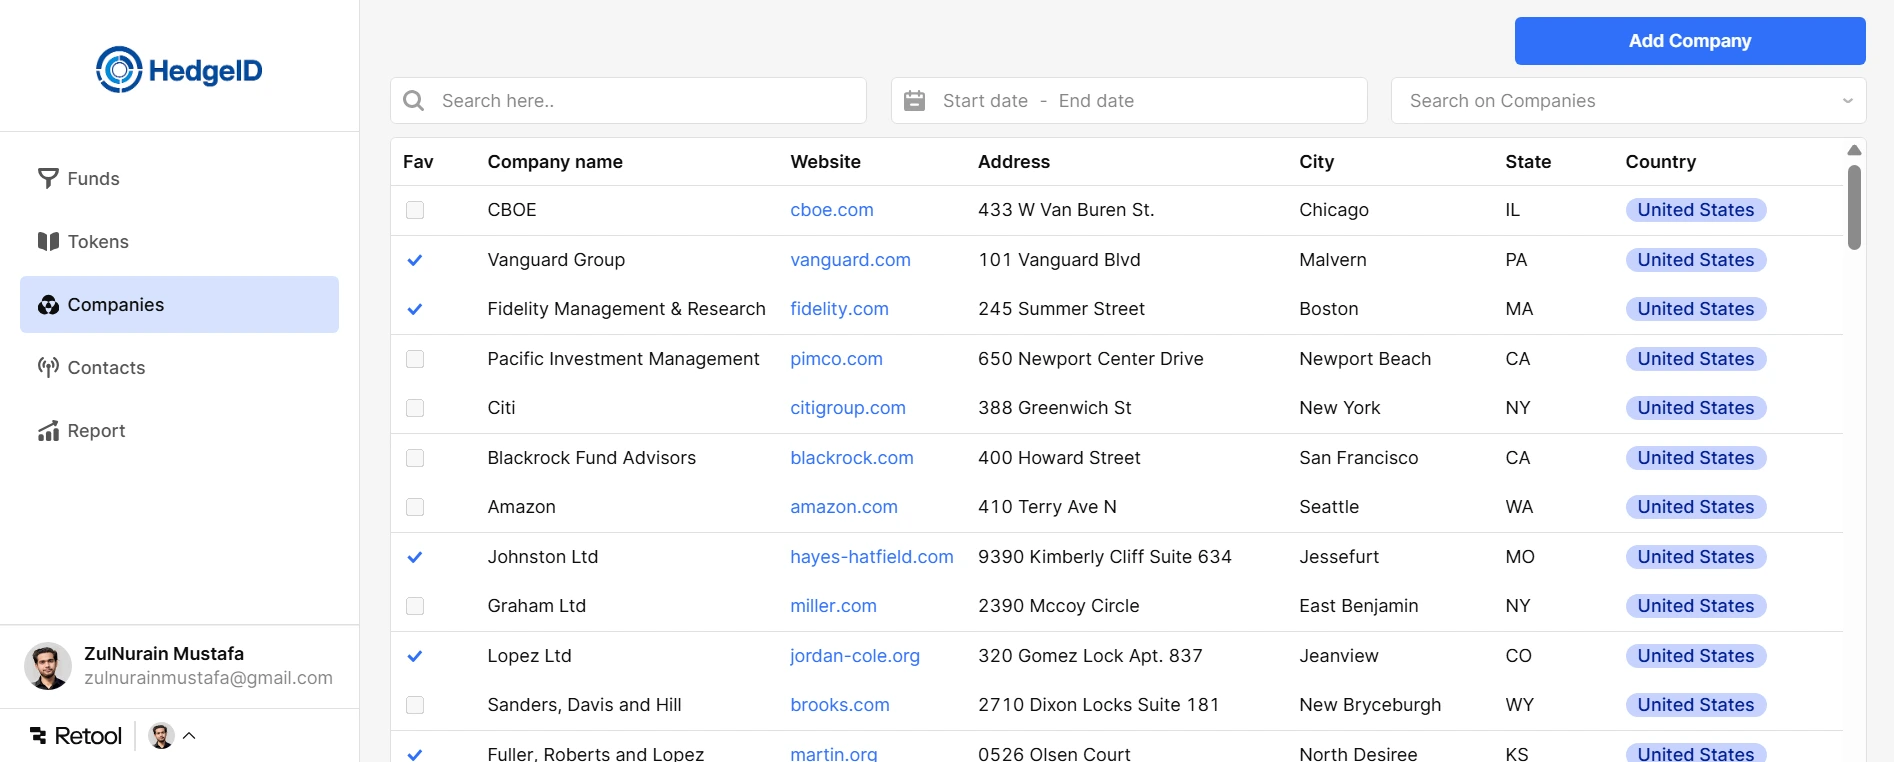
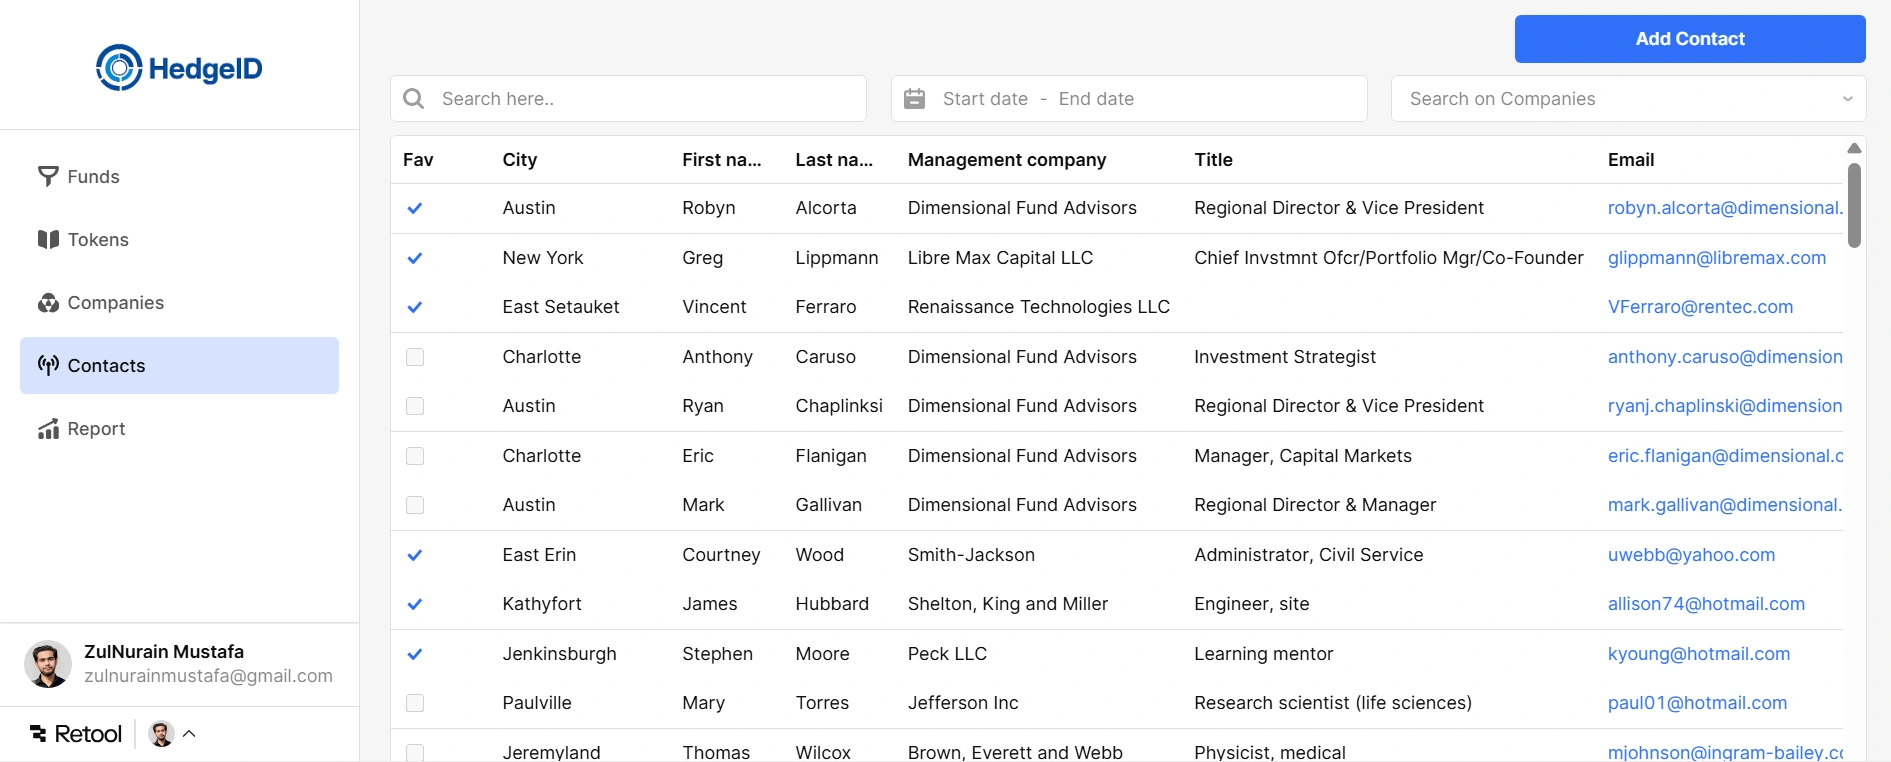
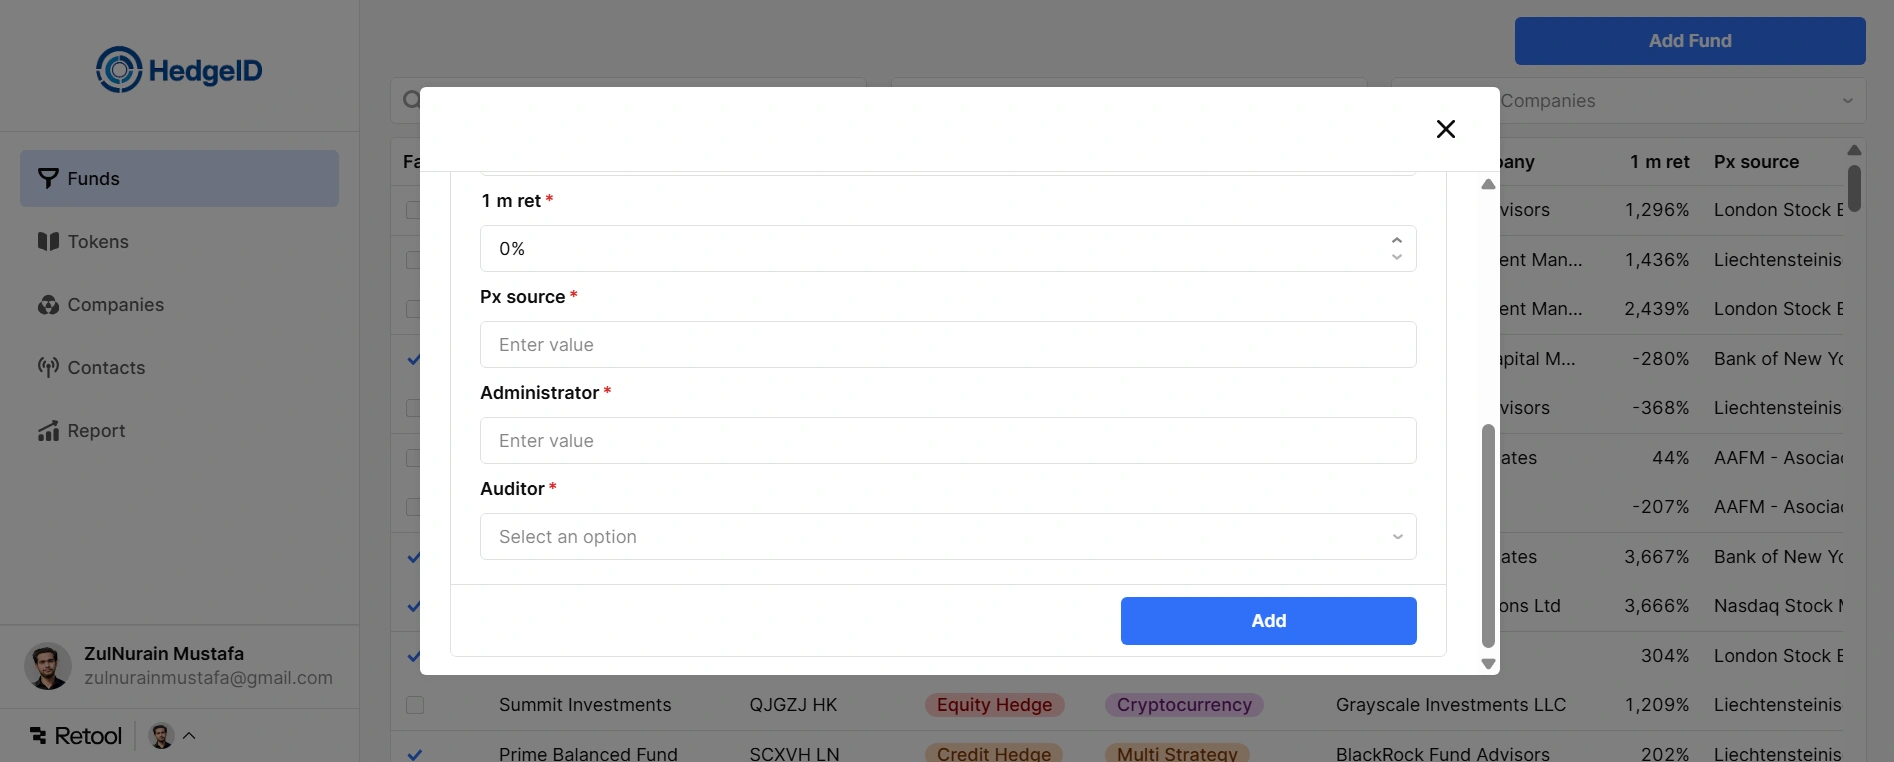
I developed a custom Retool dashboard that aggregated multiple data streams → connected to HedgeID’s Postgres / APIs / internal sources. Built KPI cards (market participants count, daily signals processed, financial entities, contributors count), created filters for time ranges / categories / asset classes, and set up internal views for operations team. Also added data export features, role-based views, and workflows to flag/verify data entries.
Key Features
Centralized Data Dashboard Real-Time KPI Metrics Interactive Filters & Data Slicing Role-Based Access Controls Workflow / Validation Tools Exportable Reports & CSVs Data Quality Monitoring Visual Insights & Dashboards
Business Outcomes
Reduced manual reporting time by ~50% Delivered accurate, timely data across the organization Improved decision-making & operational clarity Raised confidence in data quality and internal workflows
Like this project
Posted Oct 6, 2025
Built an internal dashboard for HedgeID to centralize capital markets data workflows. Connected multiple data streams to Retool, added interactive filters.
Likes
1
Views
0
Clients
HedgeID Inc.