Rover Health Dashboard
A new health dashboard for the Rover pet walking application
What is Rover?
Rover is the largest pet walking and boarding application in the United States. They have over 200,000 active pet sitters and over 2,000,000 services booked. They offer various pet-related services including pet sitting, walking, daycare, drop-in visits, and training!
Assumption
Rover is heavily focused on the pet care service aspect of the pet industry, but not so much on the social and community aspect. The only way people can communicate within the app are when services are booked or when pet owners are looking for a service. Furthermore, communication is only 1:1, you can only talk to one person at a time. Rover does not currently provide any services that allow pet owners and caretakers to talk and socialize in a group setting.
Survey and Results
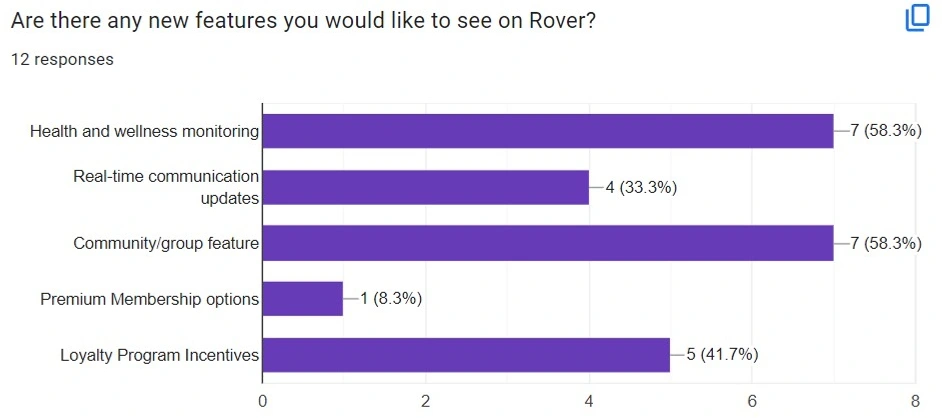
Validating my hypothesis was the main purpose of this survey and so gave users 5 potential features they would most like to see on the Rover app.
Based on 12 survey submissions, I identified that health and wellness monitoring was the main feature that users wanted to see on the Rover application.
I then pivoted my topic to focus more on the health and wellness aspect of Rover, rather than the community/group feature.
60% of users expressed interest in a health and wellness monitoring feature
42% of users mentioned a tracker for health metrics when asked about a specific health monitoring feature
33% of users mentioned a reminder system for vet appointments and medications
The Real Problem
I have no way of monitoring my pet's health when I am away
According to my initial user survey, many pet parents' main concern with Rover was the lack of transparency between the caregiver and the parent. Some caregivers would only send one or two daily updates about their pet via a picture. The parents have little to no insight into their pets' health and overall well-being.
User Interviews and Findings
"When I was at college, I had no way of monitoring my senior dog's health and so I had rely on my parents for updates""
After analyzing my results, I invited 4 survey participants back to interview more in-depth about their answers and my proposed solution. The goal of this interview was to find out what specific metrics users wanted to see and why it was important to them.
100% of participants thought about their pet's health pretty often, most having older dogs with health problems
25% of participants previously used a smart dog collar to monitor her dog's health
75% of participants wanted to monitor resting heart rate and activity level
50% of participants wanted to monitor indoor/outdoor temperature
Solution
Keeping your furbaby healthy and happy, one metric at a time
My solution is to integrate a smart wearable pet collar that can monitor health metrics via a health dashboard for both the parent and caregiver to see. That way, both parties are aware of the pet's overall health throughout the boarding session.
This will greatly increase the transparency that parents will have when leaving their dogs with caregivers and ultimately be a benefit to the dog's overall health during boarding.
Wireframes
Using Figma, I translated my initial sketches into low fidelity wireframes. This was crucial since I had to closely replicate the design and feel of Rover's existing application while adding my own feature. I relied heavily on existing health monitoring applications so as to keep the same design patterns that users were used to.
High Fidelity Wireframes
I then implemented Rover's existing fonts, colors, and design styles to create high-fidelity wireframes for my new health dashboard.
Dashboard Home Page
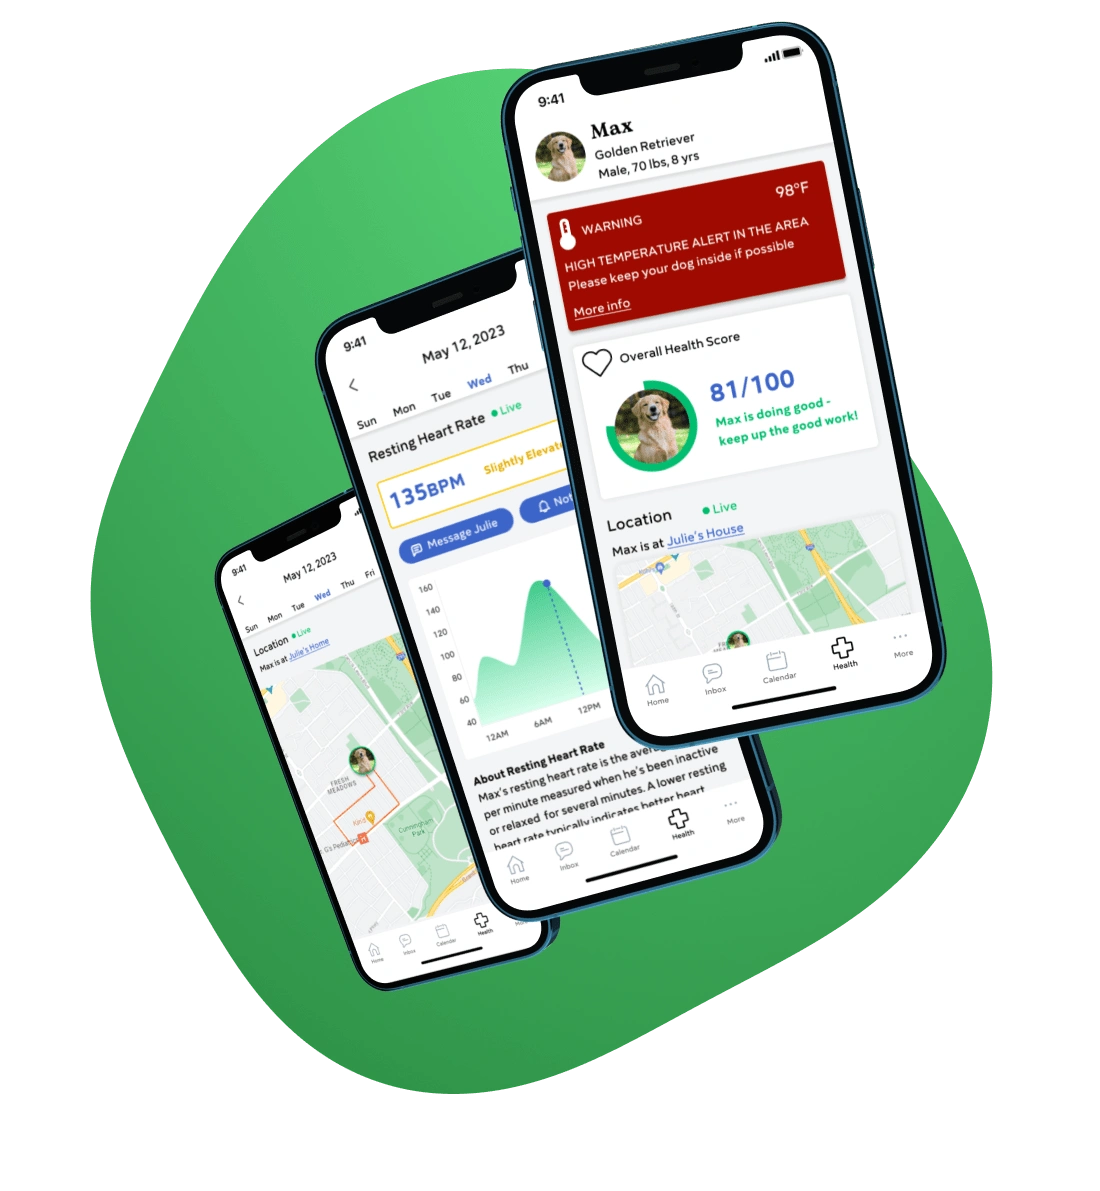
The dashboard home page features a high-level overview of various health metrics including
Temperature warning
Overall Health Score
Current Location and Location History
Resting Heart Rate
Activity Level
Sleep Amount
Users are able to click into each card if they wish to know more about a specific metric
Pairing your smart collar
I took inspiration from the Apple AirTag pairing process that I had previously done on my own dog. Setting up the collar is easy and simple, starting from the home page. Each smart collar has it's own card and pet owners can pair multiple collars to a single account.
Abnormal Health Score Notification
If one of your dog's health metrics is abnormally high or low, Rover will automatically send you a notification. You will then be directed to that health metric page where you will have the option to send your caregiver a quick notification or direct message them about it.
Viewing Health Metrics
Users are able to dive deeper into the various health metrics to get more insight into their dog's health
Location can be viewed by day and how many walks they took that specific day
Resting Heart Rate can be viewed by an hourly chart
Exercise can be viewed by the total daily steps
Usability Testing
I created fully-functional, high-fidelity prototypes of the two task flows using Figma then tested them with 14 participants.
Methodology: unmoderated remote testing via Maze
14 participants
2 Tasks Flows
Task: Sign in to Rover, pair a smart collar, then view the new health dashboard
86% success rate with 64 direct success - users were told to explore before completing the task
14% of users were not able to complete the task due being redirected back to the original home page after pairing the device
Overall sentiment was that is straightforward and simple
Task: View your dog's resting heart rate then message your caregiver about it
93% success rate with a 7% direct success - I had many additional screens that I told users to explore before completing the task
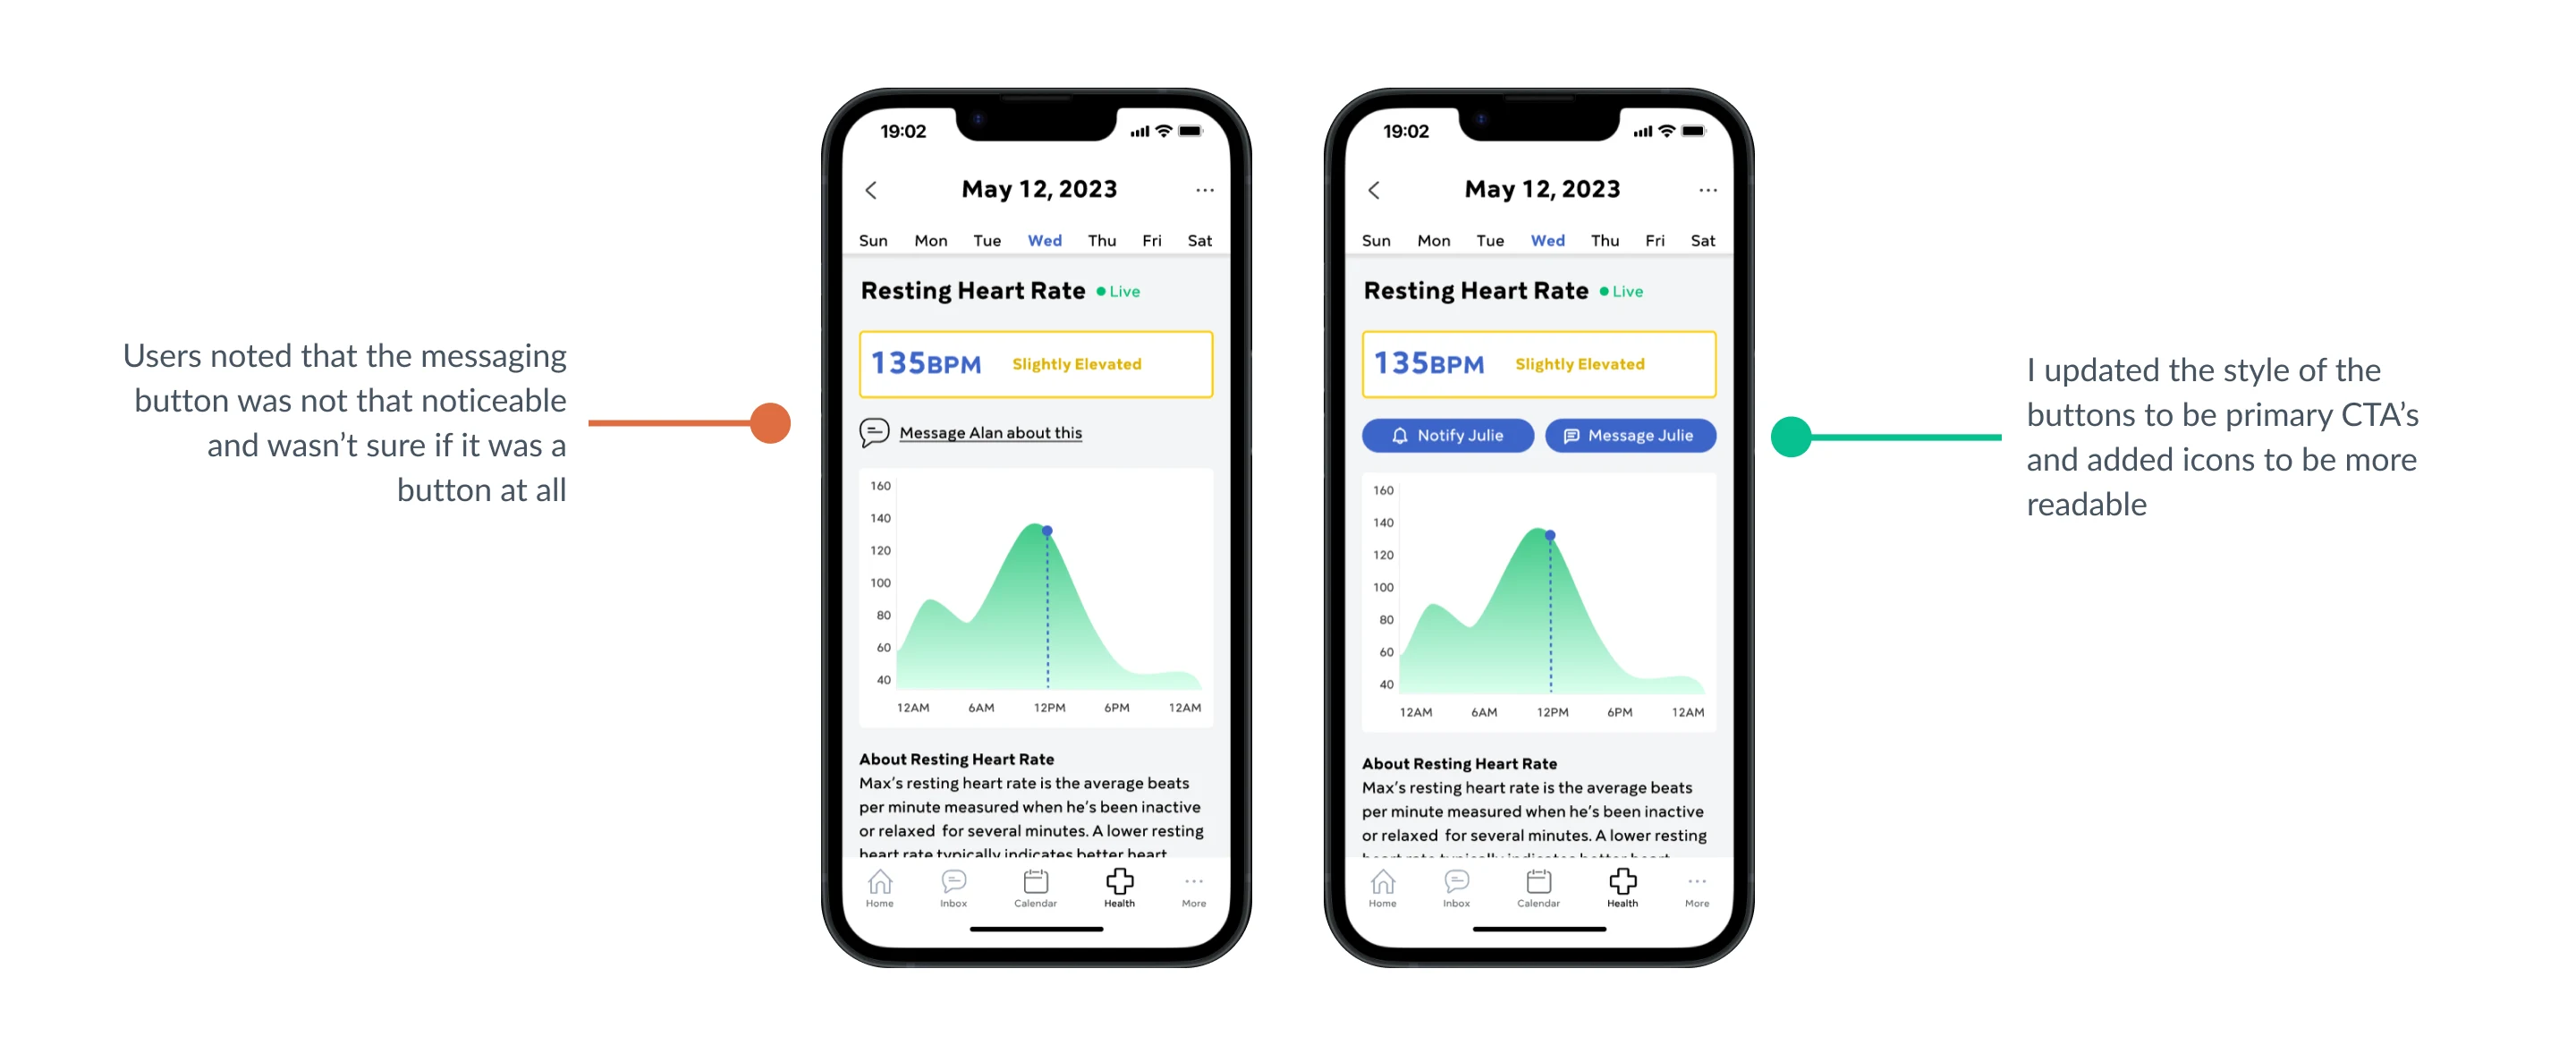
14% of users stated the messaging button on the individual metrics page was hard to see and wasn't sure if it was a button at all
Overall sentiment was that is straightforward and simple
Revisions
Re-designing the messaging and notification button
I utilized my usability test and A/B test results to figure out the exact button layout and configuration I wanted to add
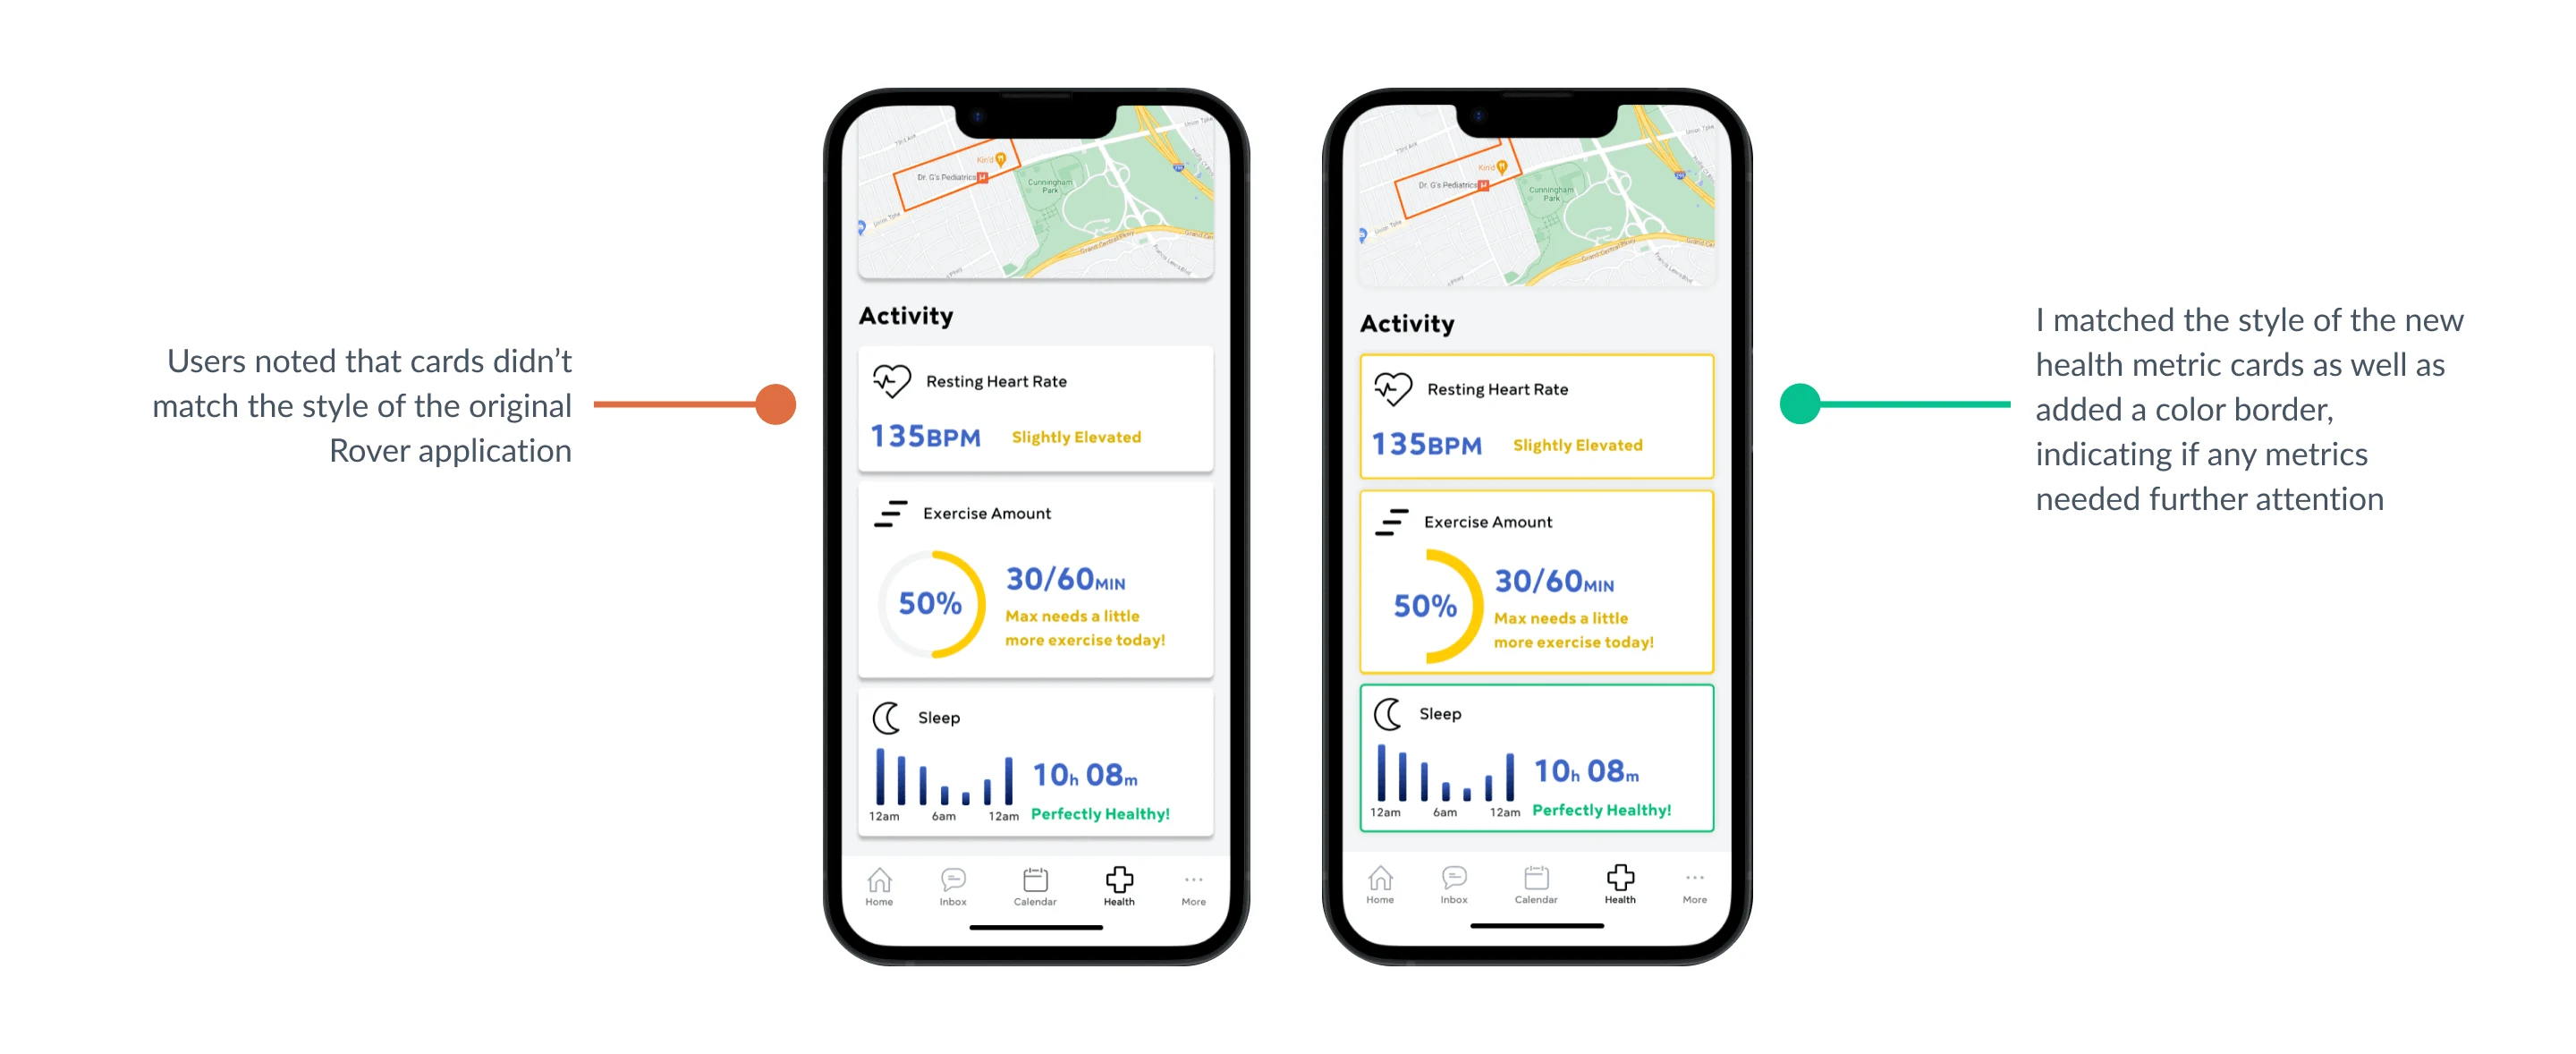
Re-designing the health metric cards
Final Product
Next steps
I will build out more components and metrics so users can get even more insight into their pet's health
I will build out the screens from the caregiver's perspective
I will build out additional screens to accommodate for users having multiple pets
Learnings
Extend Current Product Branding to another Feature
This project allowed me to add a feature to an existing product, one which I use very often. I had to learn to take Rover's existing design language and add that to my new design, which was a tough challenge.
Pivot when your users face different problems than you
I learned to listen to my users instead of sticking with my initial topic. I had assumed that many users would have the same issue as me, but that was quickly dispelled once my survey results came out. I pivoted to the most common issues my users faced, thus designing a feature that users would actually use and benefit from.
Iterations are your best friend
My initial usability test result had some users commenting that it felt disconnected from the main application. I used that feedback to more closely match Rover's design patterns, while still trying to add new features that users would benefit from, such as a colored border to quickly indicate health status.
I also learned the importance of A/B testing. When faced with multiple design options, I turned to 9 usability test users to decide which layout they most resonated with.
Thank you for reading my case study!
Want to work with me? Feel free to contact me!
...or just say hello on my social media.
Like this project
Posted Oct 1, 2023
Allowing pet parents to monitor their pet's health from anywhere in the world, while keeping caregivers accountable and transparent
Likes
0
Views
4


