Interactive Treemap Data Visualization Using D3.js
Devowise .
Overview
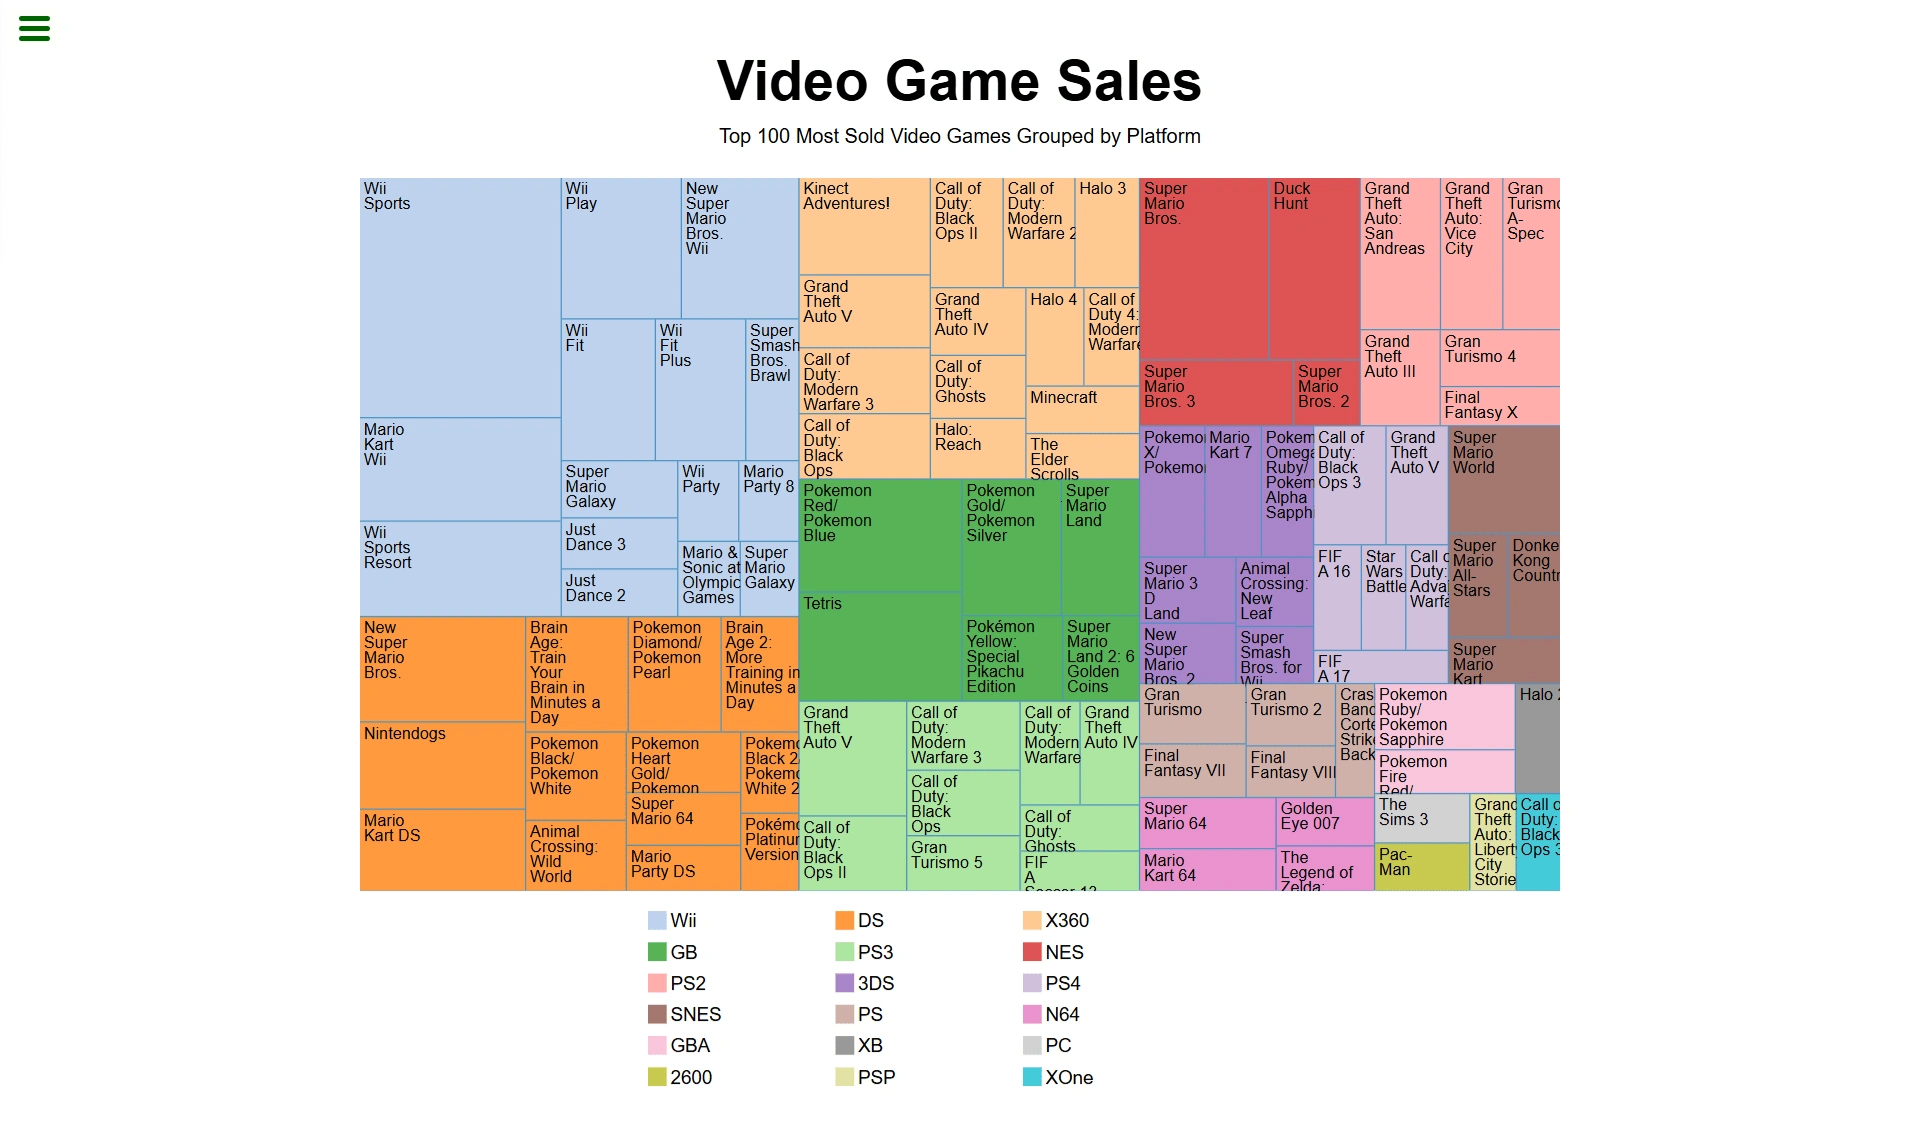
This project is an interactive Treemap Diagram, built using D3.js, designed to visualize hierarchical data in an intuitive and user-friendly way. It dynamically adjusts to different datasets and provides a clear breakdown of the data structure, making it easy for users to analyze trends and patterns.
Technology Stack
D3.js – For creating and manipulating the treemap visualization.
HTML & CSS – For structuring and styling the visualization layout.
JavaScript (ES6+) – To handle data processing, interactions, and animations.
Key Features
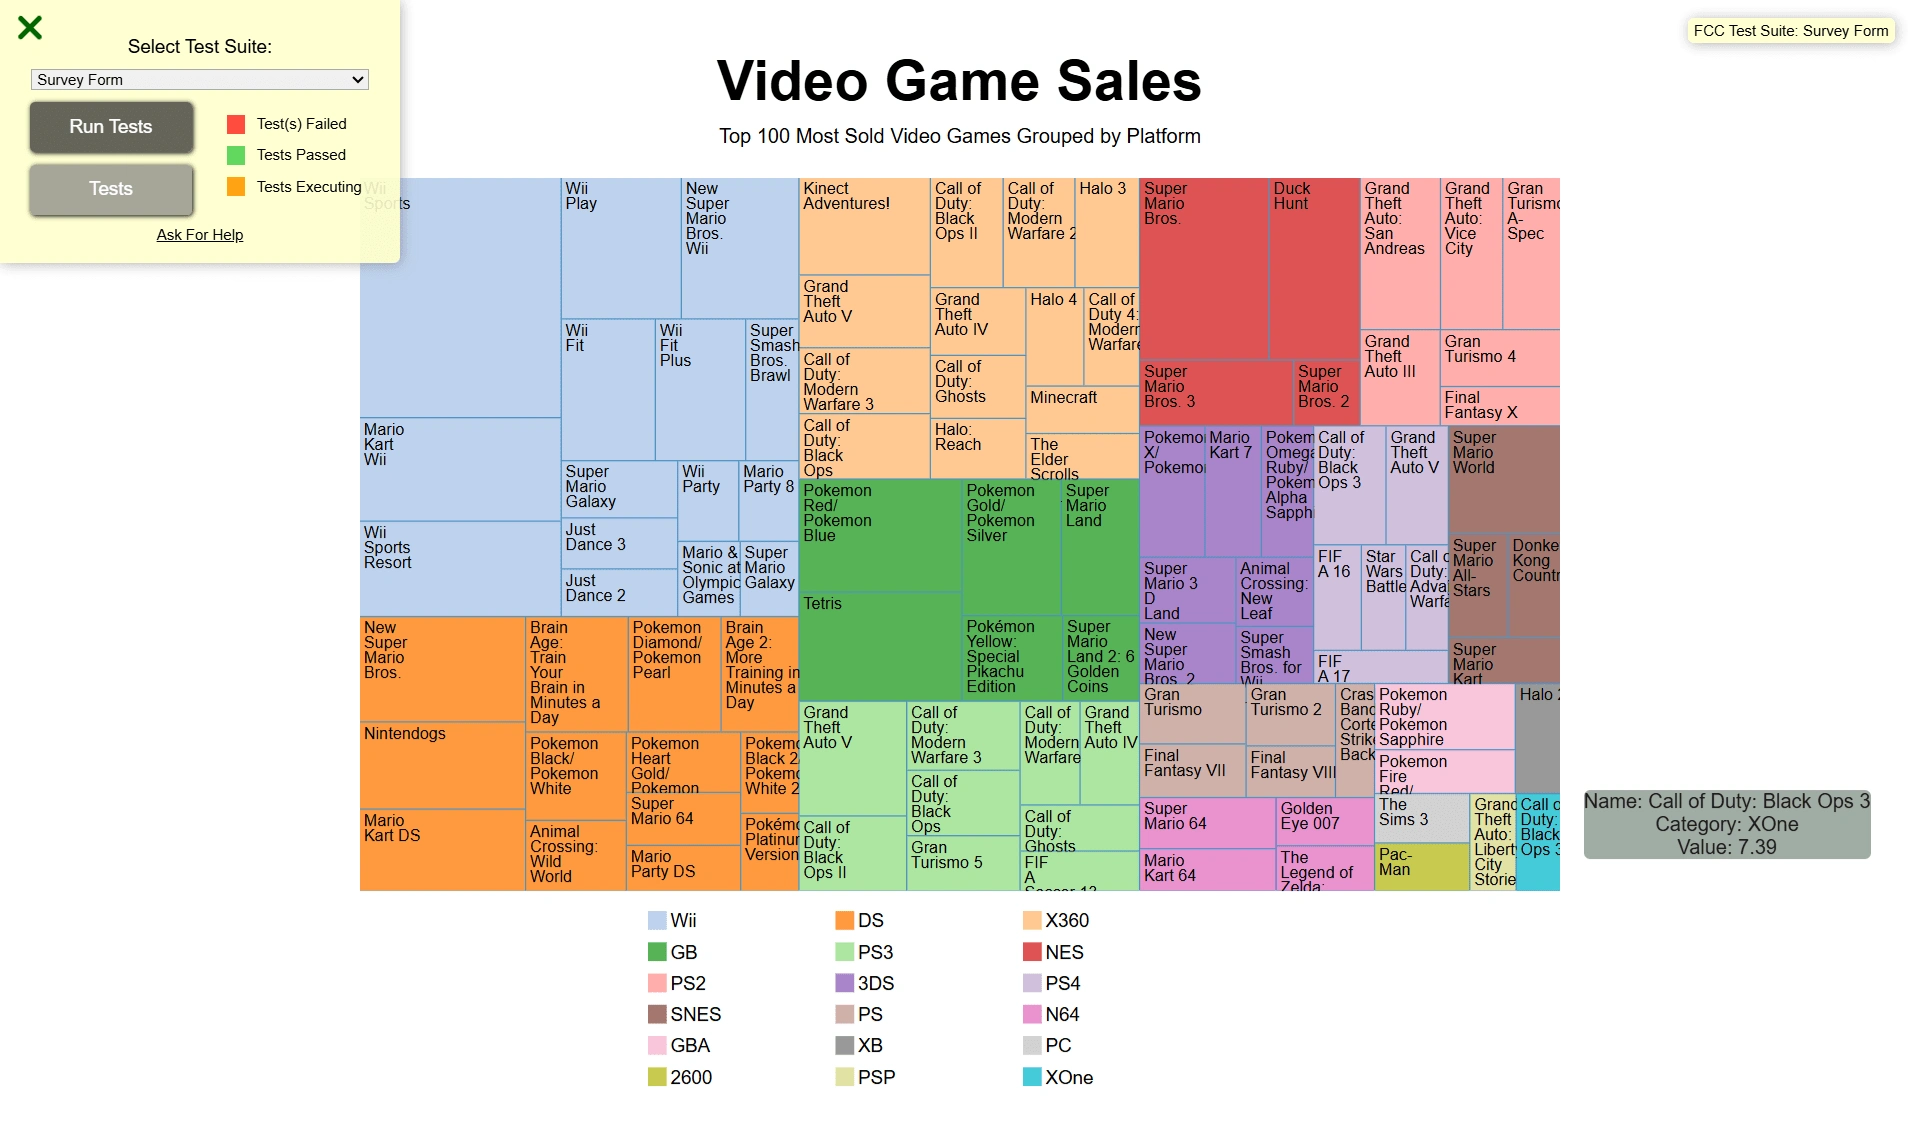
✅ Interactive UI – Users can hover over sections to reveal detailed data insights.
✅ Responsive Design – Works seamlessly across desktop and mobile devices.
✅ Hierarchical Data Representation – Effectively organizes complex datasets for better readability.
✅ Dynamic Color Mapping – Enhances visual distinction between different data categories.
Like this project
Posted Mar 11, 2025
Developed an interactive D3.js Treemap to visualize hierarchical data, enhancing data analysis and decision-making.