Rohan30082004/chocolate
ROHAN MISHRA
CHOCOLATE ORDERS
Problem Statement
This dashboard helps the Chocolate Company analyze their orders, sales trends, and product performance. It provides insights into revenue distribution across products, countries, and clients. The dashboard also highlights top-performing products, tracks total revenue, and identifies key areas for business growth. By understanding product demand, geographical sales, and customer contributions, the company can strategize better to optimize supply chain, focus on high-demand products, and improve client satisfaction.
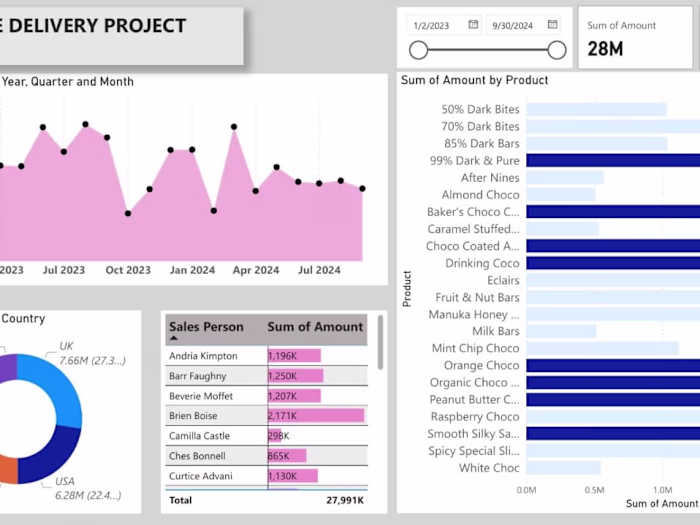
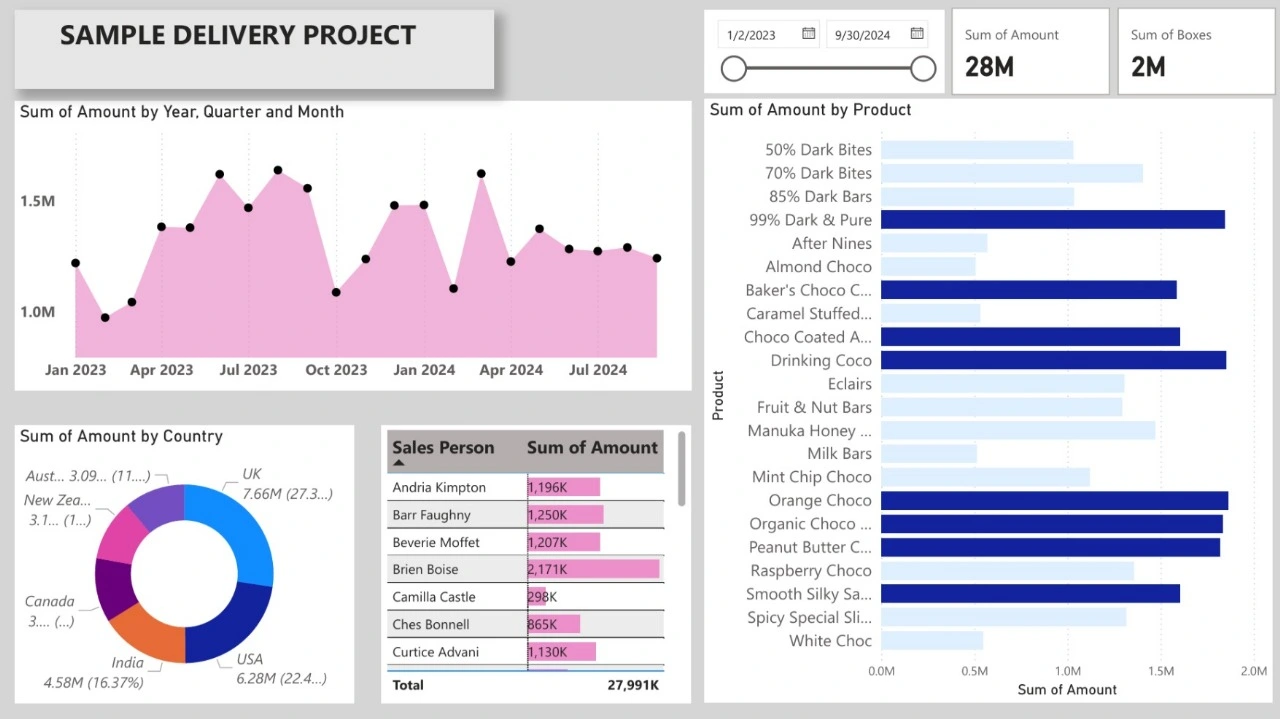
The total revenue for the analyzed period is 27.99M, with significant contributions from key products like 50% Dark Bites, 70% Dark Bites, and 85% Dark Bars. Geographically, New Zealand (27.3%) and the USA (22.4%) are the top-performing regions.
Steps Followed
-Step 1: Load the dataset (CSV format) into Power BI Desktop.
Step 2: Open Power Query Editor and enable "Column Distribution", "Column Quality", and "Column Profile" to identify data quality issues.
Step 3: Set column profiling based on the entire dataset to observe null values, errors, and unique entries across columns.
Step 4: Cleaned the data, specifically handling null or empty values in the Sum of Boxes column. For revenue calculation, only valid entries were considered.
Step 5: In the report view, applied a professional theme from the "View" tab for visual consistency.
Step 6: Added slicers (Visual Filters) for fields: Country, Product Category, and Client Name. This allows the user to dynamically filter visuals for specific insights.
Step 7: Created card visuals to display:
Total Revenue (Sum of Amount)
Total Boxes Sold (Sum of Boxes)
Filters were applied to exclude null values where necessary.
Step 8: Added a bar chart visual to represent revenue distribution across different Countries. The chart highlights major contributors like New Zealand, USA, India, and Australia.
Step 9: A pie chart was added to showcase the Revenue by Product Categories, allowing quick identification of top-performing products.
Step 10: Used a clustered bar chart to display the revenue trend across Client Names and their respective contribution percentages. This helps identify high-value clients.
Step 11: Created a table visual to display detailed product-level analysis, including:
Product Name
Sum of Amount
Sum of Boxes
Step 12: Added text boxes in the report view under the "Insert" tab to display the company's name and a tagline for branding purposes.
Step 13: Imported the company logo using the "Image" option to enhance the dashboard presentation.
Step 14: Created a calculated column to group revenue into different ranges for better visualization. The following DAX expression was used: Revenue Group = IF(SUM('Orders'[Sum of Amount]) <= 100000, "Low Revenue", IF(SUM('Orders'[Sum of Amount]) <= 1000000, "Medium Revenue", "High Revenue"))
Snapshots
Dashboard :
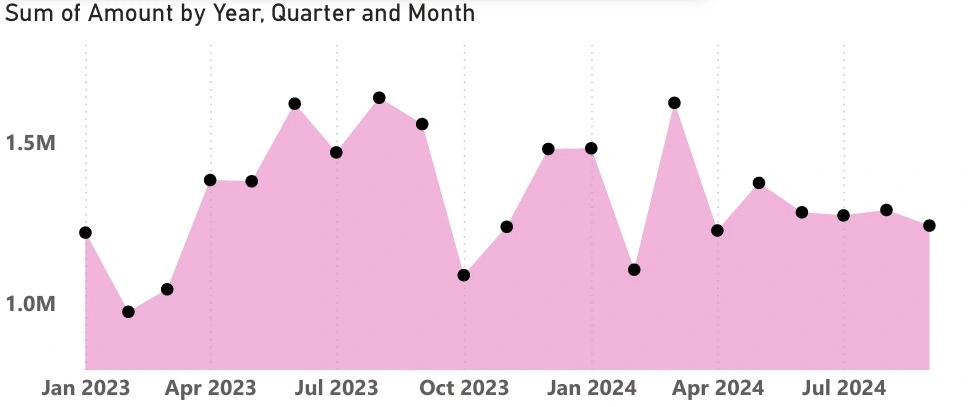
Sum of amount by time:
Insights
A single-page dashboard was created, published to Power BI Service, and analyzed for the following insights:
[1] Total Revenue and Boxes Sold
Total Revenue: 27.99M
Total Boxes Sold: 1.2M
[2] Geographical Revenue Contribution
New Zealand: 7.66M (27.3%)
USA: 6.28M (22.4%)
India: 4.58M (16.37%)
Australia: 3.09M (11.03%)
Canada and UK contributed marginally to overall revenue.
Thus, New Zealand and USA are the primary markets for the company.
[3] Top Product Performance
The top 5 products based on total revenue are:
50% Dark Bites
70% Dark Bites
85% Dark Bars
Caramel Stuffed
Drinking Cocoa
These products contribute over 60% of the company's total revenue.
[4] Client Analysis
Top clients include:
Andria Kimpton
Barr Faughny
Beverie Moffet
Brien Boise
Camilla Castle
The revenue distribution across clients shows that key clients contribute significantly to the overall business.
[5] Monthly Sales Trend
Sales showed a consistent upward trend from January 2023 to July 2024.
Significant spikes in revenue were observed during certain quarters, possibly due to seasonal demand or promotional campaigns.
[6] Revenue Ranges
Low Revenue Orders: < 100K
Medium Revenue Orders: 100K - 1M
High Revenue Orders: > 1M
Majority of orders fall under the Medium Revenue Range.
[7] Product Categories
The products are distributed across multiple categories, with Dark Chocolate Bars and Stuffed Bites generating the highest revenue.
The interactive visuals and slicers make this dashboard highly dynamic, allowing users to drill down into specific insights as required. The project was published on Power BI Service for broader accessibility and collaboration.
Like this project
Posted Dec 22, 2024
Contribute to Rohan30082004/chocolate development by creating an account on GitHub.