Rohan30082004/AMAZON
ROHAN MISHRA
AMAZON Sales Dashboard
Problem Statement
This dashboard analyzes Amazon sales data to understand key sales metrics, courier performance, category-wise contributions, and regional trends. It identifies patterns in product sizes, delivery statuses, and high-performing states. These insights help stakeholders optimize logistics, enhance customer satisfaction, and identify the most profitable categories and regions.
The dashboard captures crucial information such as total sales, courier statuses, and delivery partner performance, enabling data-driven decisions to improve operational efficiency and customer experience.
Steps Followed
Step 1: Dataset Loading: Imported the Amazon sales data (CSV file) into Power BI Desktop.
Step 2: Data Profiling: Opened Power Query Editor and enabled “Column Distribution,” “Column Quality,” and “Column Profile” options under the "View" tab to analyze the data quality.
Step 3: Data Cleaning: Inspected the dataset for missing or erroneous values, which were minimal, requiring no significant cleaning.
Step 4: Identified null values in columns such as "Delivery Time" and "Order Status" and decided to exclude nulls in key calculations.
Step 5: Added measures to calculate average delivery time and order value while excluding incomplete or canceled orders.
Step 6: Used slicers for fields like "City," "Order Type," and "Payment Method" to allow dynamic filtering.
Step 7: Designed visuals:
Step 10: Added KPIs for total number of unique customers and percentage of repeat customers using DAX.
Step 11: Published the report to Power BI Service for web accessibility and stakeholder reviews.
Snapshots
DADHBOARD :
Insights
A single-page dashboard was created, published to Power BI Service, and analyzed for the following insights:
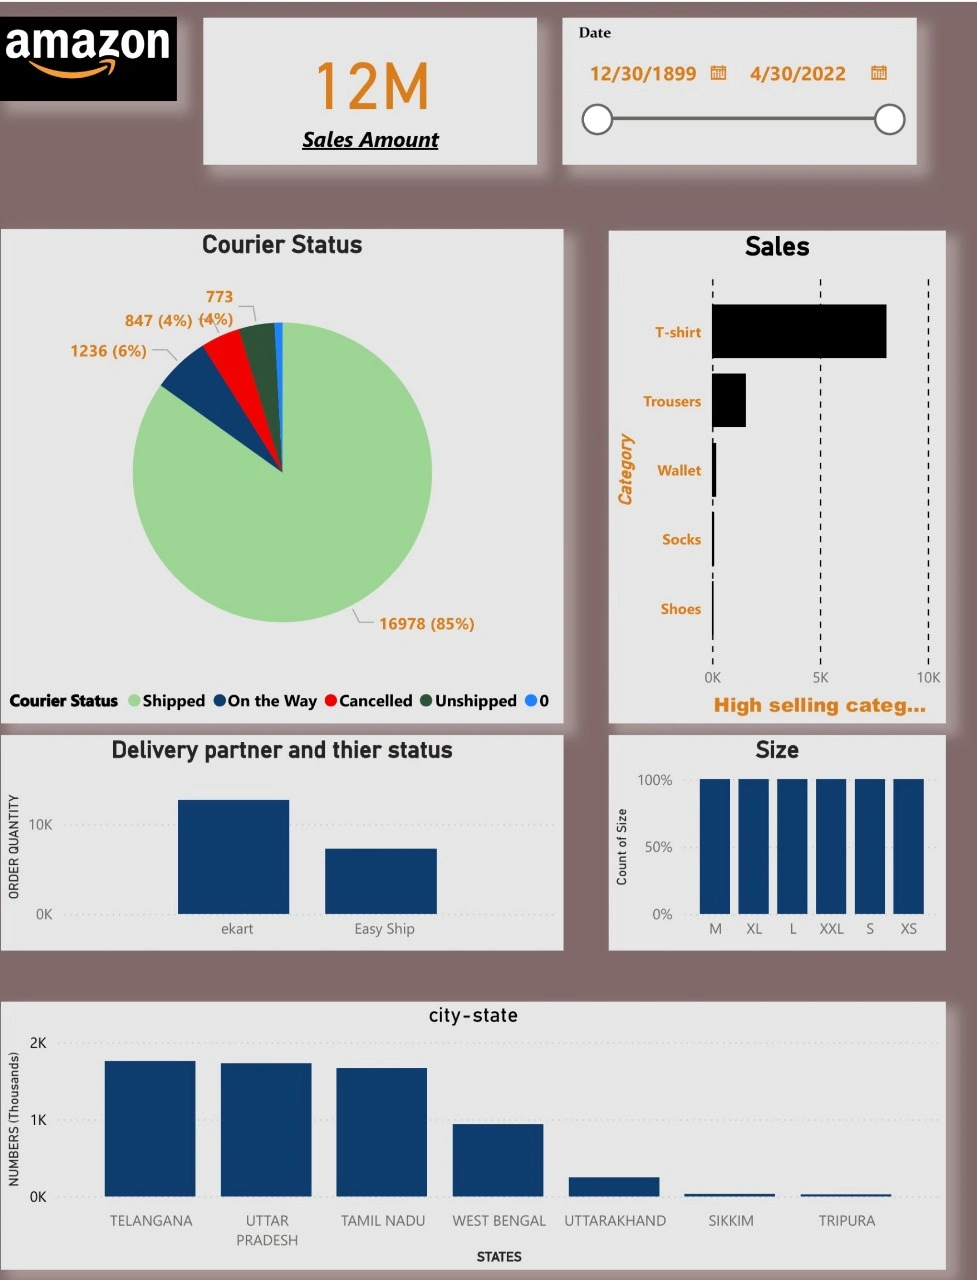
[1] Sales Overview:
Total Sales Amount: $12M
[2] Courier Status Performance
Shipped: 85% (16,978 orders)
On the Way: 6% (1,236 orders)
Cancelled: 4% (847 orders)
Unshipped: 4% (773 orders)
[3]High-Performing Product Categories:
T-Shirts: Highest sales among categories.
[4] Delivery Partner Analysis:
Ekart: Handles the majority of orders.
[5] Size Analysis:
Uniform distribution across sizes (M, L, XL, XXL, S, XS).
By addressing inefficiencies in courier performance and optimizing category-wise inventory, Amazon can enhance customer satisfaction and drive better operational efficiency
Like this project
Posted Dec 22, 2024
Contribute to Rohan30082004/AMAZON development by creating an account on GitHub.