Analytics Intelligence Dashboard
Waleed Ashraf Usmani
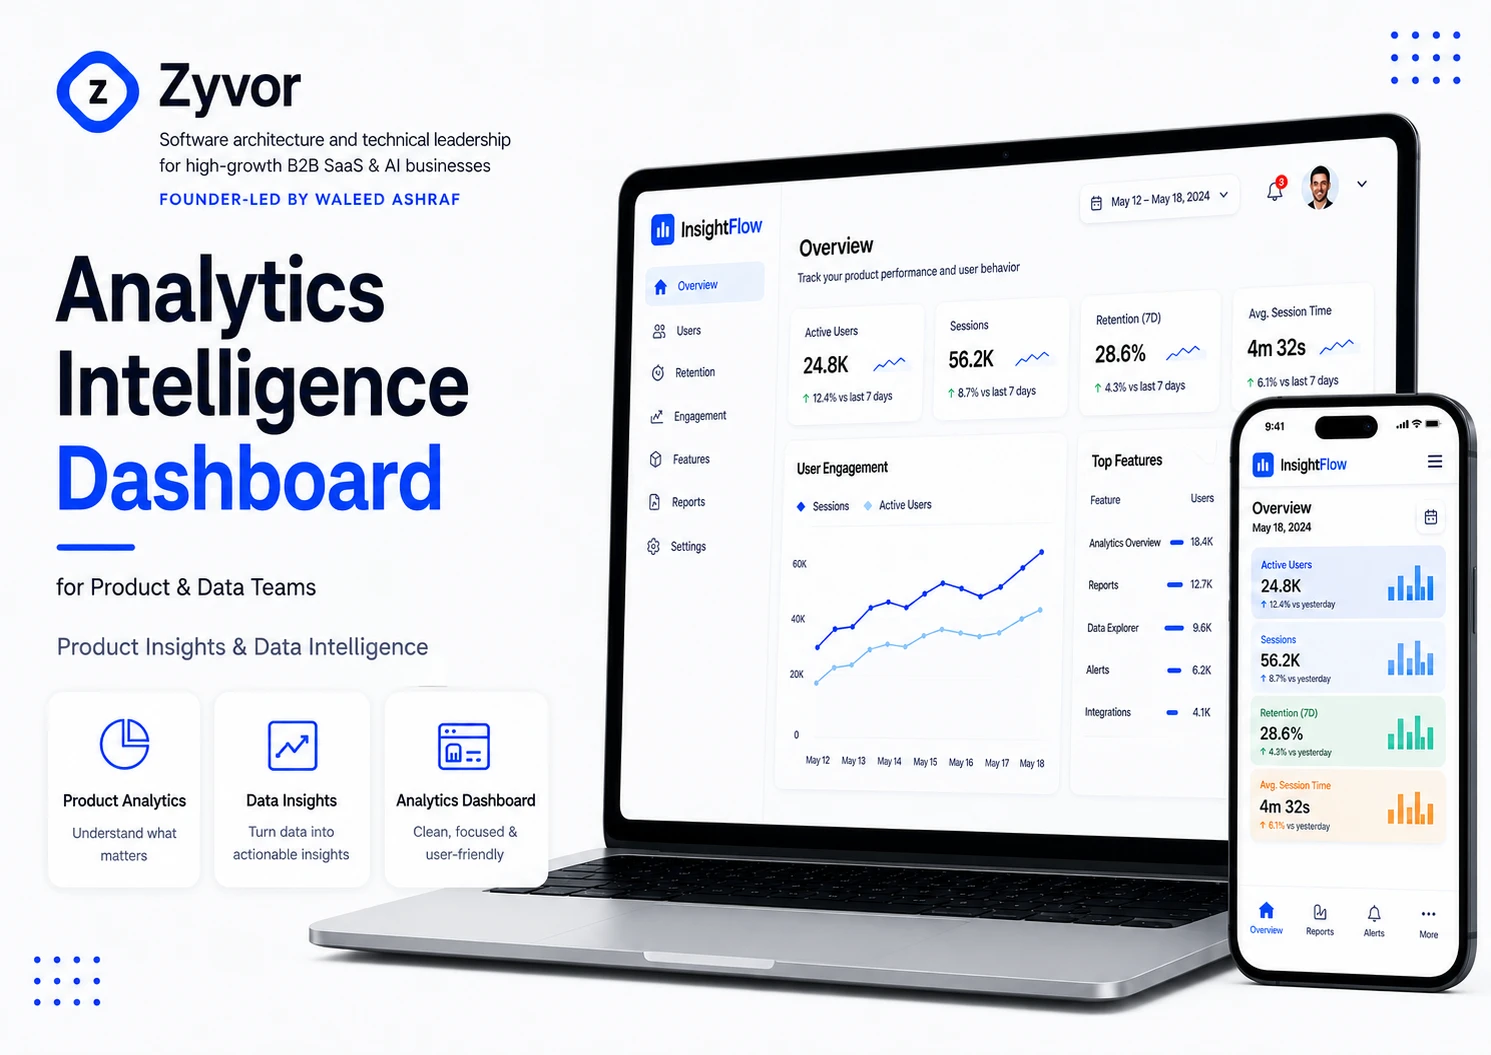
Analytics Intelligence Dashboard
The Problem
A B2B SaaS platform serving 18,000 active users was making million-dollar product decisions on gut feel. Not by choice, but because getting real behavioral data took longer than the sprint cycle itself.
Analytics stack fragmented across Mixpanel, Google Analytics, and Amplitude. Three tools, three schemas, three versions of the truth
Answering "what's our day-7 retention by acquisition channel?" required a Jira ticket, an engineer, CSV exports, spreadsheet cleanup, and 2 weeks of turnaround
A major onboarding redesign was greenlit based on 3 customer interviews because nobody could show where users actually dropped off
The company spent $3,200/month on analytics tools and still couldn't answer basic product questions in real time
2 engineering days per week burned on ad-hoc data requests instead of building product
The cost wasn't the tool spend. It was every product decision made without evidence and every sprint prioritized on assumption.
The Approach
I replaced the fragmented analytics stack with a single, purpose-built product intelligence platform. Core design principle: every question a product manager asks should be answerable in under 60 seconds without involving engineering.
Unified Event Architecture
Single ingestion pipeline replacing 3 conflicting tools with one source of truth.
✅ Structured event taxonomy capturing every user action: feature usage, navigation paths, errors, engagement depth
✅ Processing 50K+ events/hour with idempotency keys preventing data corruption from retries
✅ Sub-second write latency into partitioned PostgreSQL tables
📊 Outcome: One company-wide source of truth. Conflicting numbers between tools eliminated overnight
Cohort Engine Built for Product Thinking
Designed around how PMs actually think, not how databases query.
✅ Natural language-style queries: "Day-1, day-7, day-30 retention for paid ad signups last quarter, by plan tier"
✅ Pre-computes common cohort windows overnight, custom windows on demand
✅ Drag-and-drop configuration, no SQL required
📊 Outcome: Full-day spreadsheet analysis → 60-second self-service report
Visual Funnel Builder with Segment Comparison
See exactly where users drop off, and why different segments behave differently.
✅ Drag-and-drop funnel steps with conversion rates and drop-off percentages at each stage
✅ Side-by-side segment comparison (mobile vs. desktop, free vs. paid, channel A vs. channel B)
✅ Time-bounded conversions and branching funnel support
📊 Outcome: Revealed mobile onboarding converted at 23% vs. desktop at 41%. Gap was invisible for 8+ months
Self-Service Query Layer
Zero engineering dependency for any analytics question.
✅ Visual report builder: filtering, grouping, date ranges, metric calculations
✅ SQL mode for power users who want full control
✅ Query results feed directly into dashboard widgets, turning one-off analysis into persistent, auto-refreshing metrics
📊 Outcome: Engineering reclaimed 2 full days/week. PMs stopped filing Jira tickets for data
Role-Specific Live Dashboards
Every team sees exactly what they need. Nothing more, nothing less.
✅ Tailored views for product, growth, engineering, and leadership
✅ Leadership dashboard: 6 KPIs only (DAU/MAU, activation rate, retention curves, feature adoption, NPS trend, revenue/user)
✅ Widget-based with live refresh. No manual updates, no stale data
📊 Outcome: CEO went from monthly report requests to checking the dashboard every morning before standup
Architecture Decisions
Why I chose this stack and what tradeoffs I made.
PostgreSQL over ClickHouse — 50K+ events/hour is significant but not massive. Partitioned tables + materialized views kept 95% of queries under 200ms without the operational complexity of a dedicated OLAP system
Redis caching for dashboard reads — Widgets hit Redis first (sub-10ms), PostgreSQL on cache miss. 40 concurrent users on dashboards without database pressure
SQS event buffering — Decoupled ingestion from processing. Traffic spikes queue safely instead of dropping events. Zero data loss without over-provisioning
The Results
Timeframe | What Happened |
|---|---|
Week 1 | Funnel builder revealed a 34% drop-off at onboarding step 3 (email verification). Invisible for 8 months. Redesigned and shipped same sprint |
Month 1 | Engineering reclaimed 2 days/week. PMs self-serving 100% of data needs. Monday CSV ritual eliminated |
Month 3 | Cohort analysis: content marketing users retained 2.4x vs. paid social at day-30. $14K/month ad spend reallocated, CAC improved 18% |
Ongoing | 3 tools ($3,200/mo) → 1 platform. Monthly leadership deck → live daily dashboard. Activation rate up 12% from data-driven onboarding redesign |
Like this project
Posted May 6, 2026
Product analytics platform designed for user tracking, session metrics, retention analysis, engagement reporting, and real-time KPI dashboards for data-driven product decisions.
Likes
0
Views
7
Timeline
Jul 1, 2021 - Oct 31, 2021
Clients
PeopleI