Growth Intelligence Platform
Waleed Ashraf Usmani
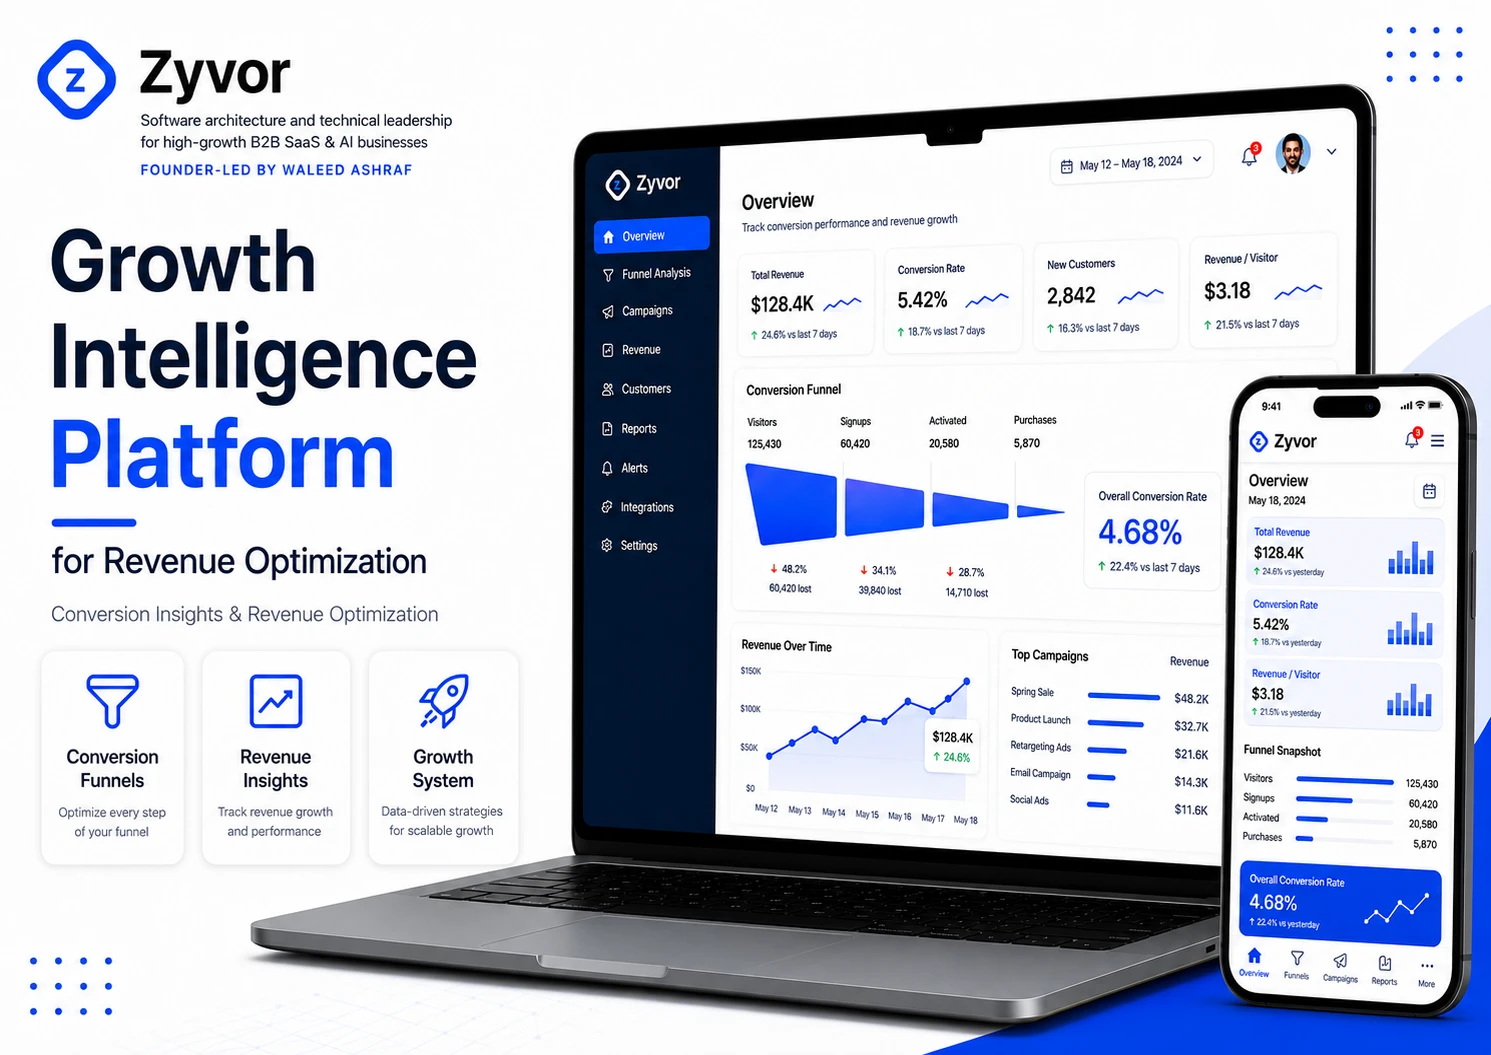
Growth Intelligence Platform
The Problem
A B2B SaaS company scaling past $2M ARR had no idea which channels were actually driving revenue. Marketing spent $45K/month across 6 acquisition channels, but attribution was a mess of UTM parameters, disconnected spreadsheets, and monthly reports that arrived 3 weeks late.
Google Analytics showed 12,000 monthly signups but couldn't connect a single one to revenue. "How much did that LinkedIn campaign actually earn us?" was unanswerable
Conversion funnel visibility ended at signup. Nobody knew what happened between "created account" and "first payment" because the data lived in 3 different systems
Campaign ROI calculations required a growth analyst, raw database exports, and 4 days of spreadsheet work. By the time the numbers arrived, the campaign was already over
Trial-to-paid conversion sat at 8% but nobody could explain why. Was it pricing? Onboarding friction? Wrong audience? No data to tell
The CEO reviewed a monthly growth deck that was already outdated by the time it was presented. Decisions about where to spend next month's budget were based on last month's guesses
Engineering spent 10+ hours per week pulling ad-hoc reports for the growth team instead of building product
The company wasn't short on traffic. It was short on intelligence about what that traffic was worth.
The Approach
I built a revenue-focused growth intelligence platform that connects every touchpoint from first click to first payment, giving the growth team real-time visibility into what's working, what's not, and where to double down.
Multi-Touch Attribution Engine
Know exactly which channels, campaigns, and touchpoints drive revenue, not just clicks.
✅ First-touch, last-touch, and linear attribution models running simultaneously across all acquisition channels
✅ Full journey tracking from ad impression → landing page → signup → activation → first payment, with every touchpoint timestamped
✅ Automatic UTM parameter normalization and deduplication across 6 channels (Google Ads, LinkedIn, Twitter, organic, referral, direct)
📊 Outcome: Discovered LinkedIn drove 34% of signups but only 11% of paid conversions. Organic content drove 18% of signups but 41% of revenue. $14K/month reallocated within the first sprint
Conversion Funnel Analytics
See exactly where prospects drop off and why different segments convert differently.
✅ Configurable funnel stages from awareness through activation to revenue, with drop-off rates and median time-between-steps at each stage
✅ Segment comparison: channel vs. channel, cohort vs. cohort, plan tier vs. plan tier, side by side in real time
✅ Anomaly detection flags unusual drop-off spikes within 4 hours instead of waiting for the monthly review
📊 Outcome: Identified that mobile signups converted to paid at 4% vs. desktop at 14%. Onboarding flow had a mobile-specific friction point at step 2 that was invisible in aggregate data
Campaign Performance Dashboard
Real-time ROI for every dollar spent, not a spreadsheet 3 weeks later.
✅ Live spend-to-revenue tracking per campaign with cost-per-acquisition, customer lifetime value estimates, and payback period calculations
✅ Automated daily and weekly performance snapshots replacing the manual monthly growth deck
✅ Budget pacing alerts when campaigns over-spend or under-deliver against targets
📊 Outcome: Growth team went from monthly ROI reviews to daily optimization. Campaign budget waste reduced 28% in the first 60 days
Cohort Revenue Tracking
Understand how different acquisition cohorts behave over time, not just at signup.
✅ Revenue cohorts by signup week, acquisition channel, plan tier, and geography with day-7, day-30, and day-90 retention curves
✅ Expansion revenue tracking: upgrades, add-ons, and seat increases attributed back to original acquisition source
✅ Churn prediction scoring based on engagement patterns in the first 14 days
📊 Outcome: Content marketing cohorts retained 2.4x better than paid social at day-30. Churn prediction model flagged at-risk accounts with 72% accuracy, enabling proactive outreach
Self-Service Reporting Layer
Zero engineering dependency for any growth question.
✅ Visual query builder with drag-and-drop metrics, dimensions, date ranges, and segment filters
✅ Scheduled report delivery to Slack and email for recurring metrics
✅ SQL mode for power users who need custom analysis beyond the visual builder
📊 Outcome: Engineering reclaimed 10+ hours/week. Growth team self-serving 100% of data needs within 2 weeks of launch
Architecture Decisions
Why I chose this stack and what tradeoffs I made.
PostgreSQL with materialized views over a data warehouse — At this data volume (50K events/day), a dedicated warehouse like BigQuery or Redshift adds operational complexity without proportional benefit. Materialized views pre-compute attribution and cohort tables overnight, keeping 90% of dashboard queries under 150ms
Redis for real-time dashboard caching — Campaign dashboards hit Redis first (sub-15ms response). Background workers refresh cache every 5 minutes. 20+ concurrent dashboard users without database pressure
SQS for event ingestion buffering — Attribution events from 6 channels arrive in bursts. SQS absorbs spikes and feeds a steady processing stream. Zero dropped events during peak campaign periods
Next.js with ISR for report pages — Shared report URLs (board decks, investor updates) use incremental static regeneration for instant loads. Interactive dashboards stay server-rendered for real-time data
The Results
Timeframe | What Happened |
|---|---|
Week 1 | Attribution engine revealed LinkedIn drove 34% of signups but only 11% of paid conversions. $14K/month in ad spend flagged for reallocation |
Week 2 | Funnel analysis exposed mobile onboarding converting at 4% vs. desktop at 14%. Mobile-specific friction point identified and prioritized |
Month 1 | Growth team fully self-serving. Engineering reclaimed 10+ hours/week. Monthly growth deck replaced with live daily dashboard |
Month 2 | Campaign budget waste reduced 28%. Trial-to-paid conversion improved from 8% to 12% through data-driven onboarding changes |
Month 4 | CAC improved 18% from channel reallocation. Churn prediction model flagging at-risk accounts at 72% accuracy. Content marketing budget doubled based on cohort retention data |
Like this project
Posted May 6, 2026
Revenue growth platform designed for conversion funnel tracking, campaign analytics, acquisition metrics, and data-driven growth strategies for scaling SaaS businesses.
Likes
0
Views
5
Timeline
May 1, 2022 - Aug 31, 2022
Clients
Sehgal Motors