VP Dashboard

Miranda Logioia

Client: Energy Infrastructure Company Project
Goal: Develop an MVP Dashboard for C-Suite, VP & Senior Management to present key metrics around Risk, Compliance, Asset Management, Safety, Finance, and Operations.
Overview
I led the UX/UI design for a VP Dashboard as part of a 21-day challenge to build an MVP in the Energy Infrastructure industry. The objective was to create a comprehensive, data-driven dashboard for senior leadership, delivering insights on critical business metrics within a limited timeline.
🪄 Key Contributions:
Discovery Process: Conducted interviews with high-ranking executives to gather insights despite limited availability.
UX/UI Design: Designed the dashboard interface, including multiple tabs and customizable filters for enhanced data exploration.
Collaboration: Worked closely with a Power BI Expert and a Power BI Data Engineer to ensure data visualization accuracy and user expectations alignment.
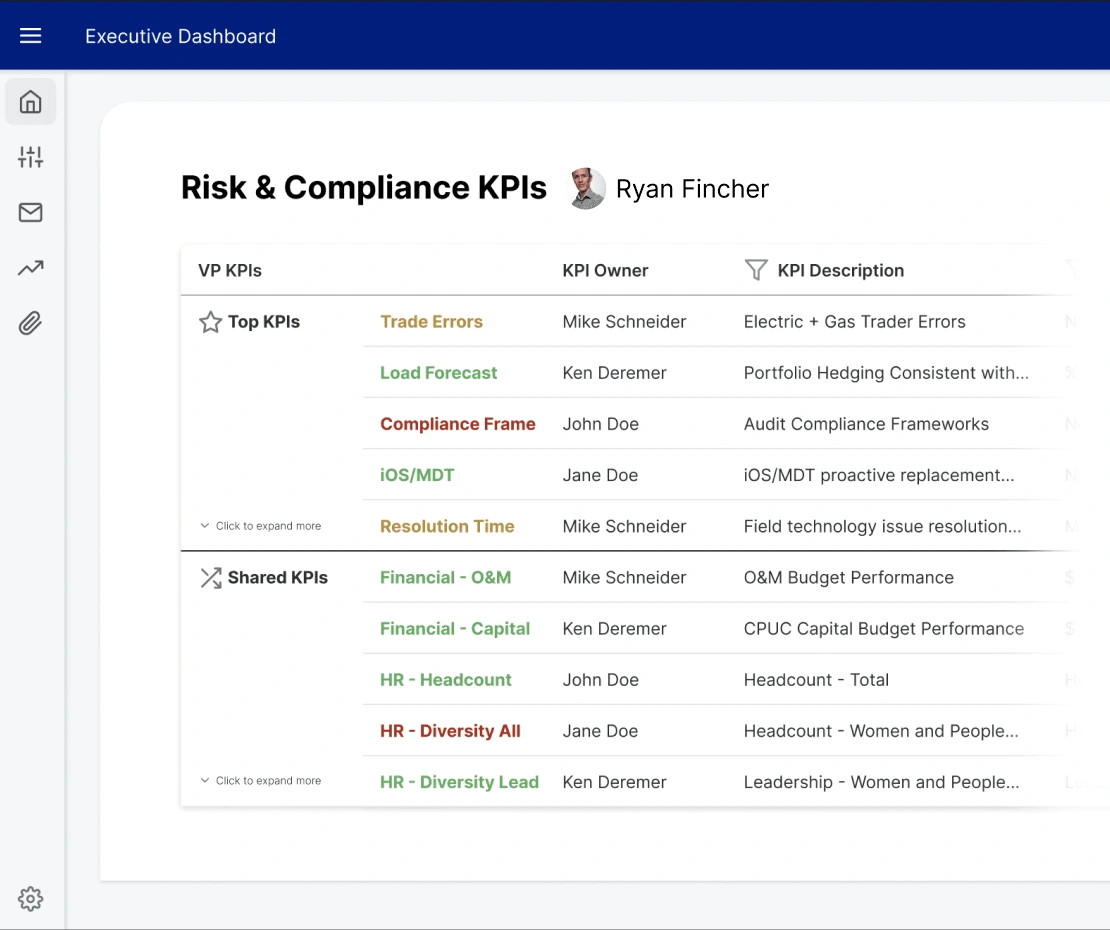
💎 Dashboard Features
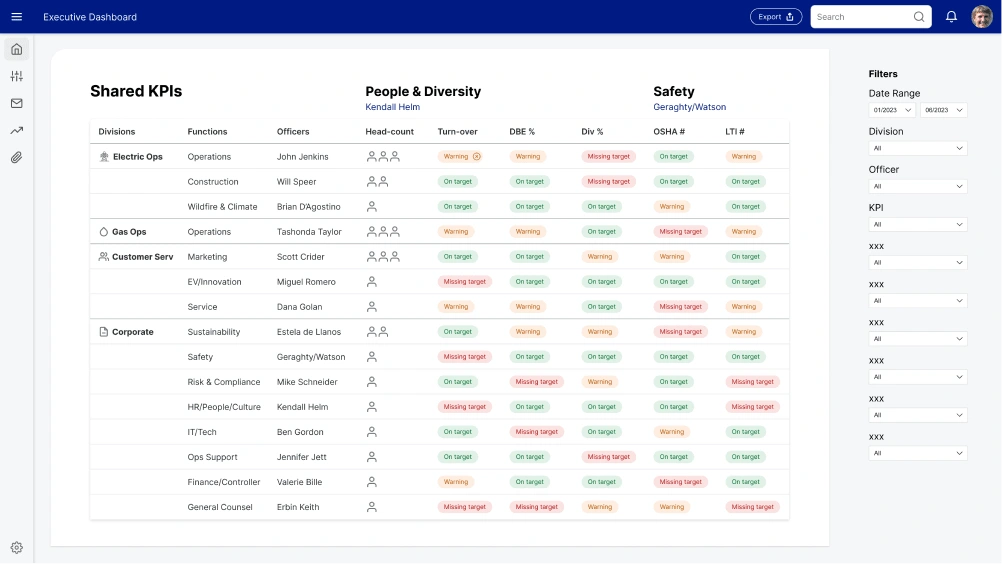
Multi-tab structure for various business metrics.
Customizable filters for a tailored data view.
High-level insights on performance metrics across multiple categories.
💡 Outcome
The VP Dashboard exceeded expectations, delivering a clear, interactive platform that provided a holistic view of essential business metrics, empowering data-driven decision-making.
Mockups
Like this project
Posted Jan 7, 2025
Designed a VP Dashboard in a 21-day MVP challenge, interviewing C-Suite execs under tight timelines. Delivered a filterable, multi-tab dashboard.
Likes
0
Views
15


Machine Learning Tool
Supply Chain Dashboard Powered by Gen AI
Contracting Summary
AI Dashboard
HR + ML Tool