Operations Monitoring & Incident Triage

Taras Migulko

Project overview
Product: AI Ops
Project type: Client MVP for an enterprise AI operations platform
My role: Product design, UX/UI, information architecture, data visualization and motion direction
Tools: Figma
The challenge
The client needed a single workspace for monitoring request volume, model health, latency, error rate, provider status and cost. The central UX challenge was making dense operational data scannable while keeping incidents and expensive changes visible.
THE OPERATING MODEL
I structured the product around two levels of attention: scan the entire AI fleet, then investigate the signal that requires action. Global KPIs establish system context, comparable model rows expose changes, and detailed signal views help the user understand severity, affected scope and recent activity without losing orientation.
THREE CORE WORKFLOWS
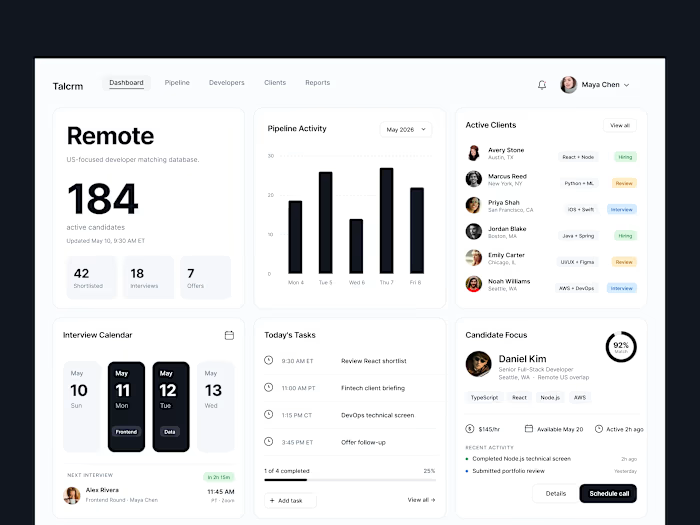
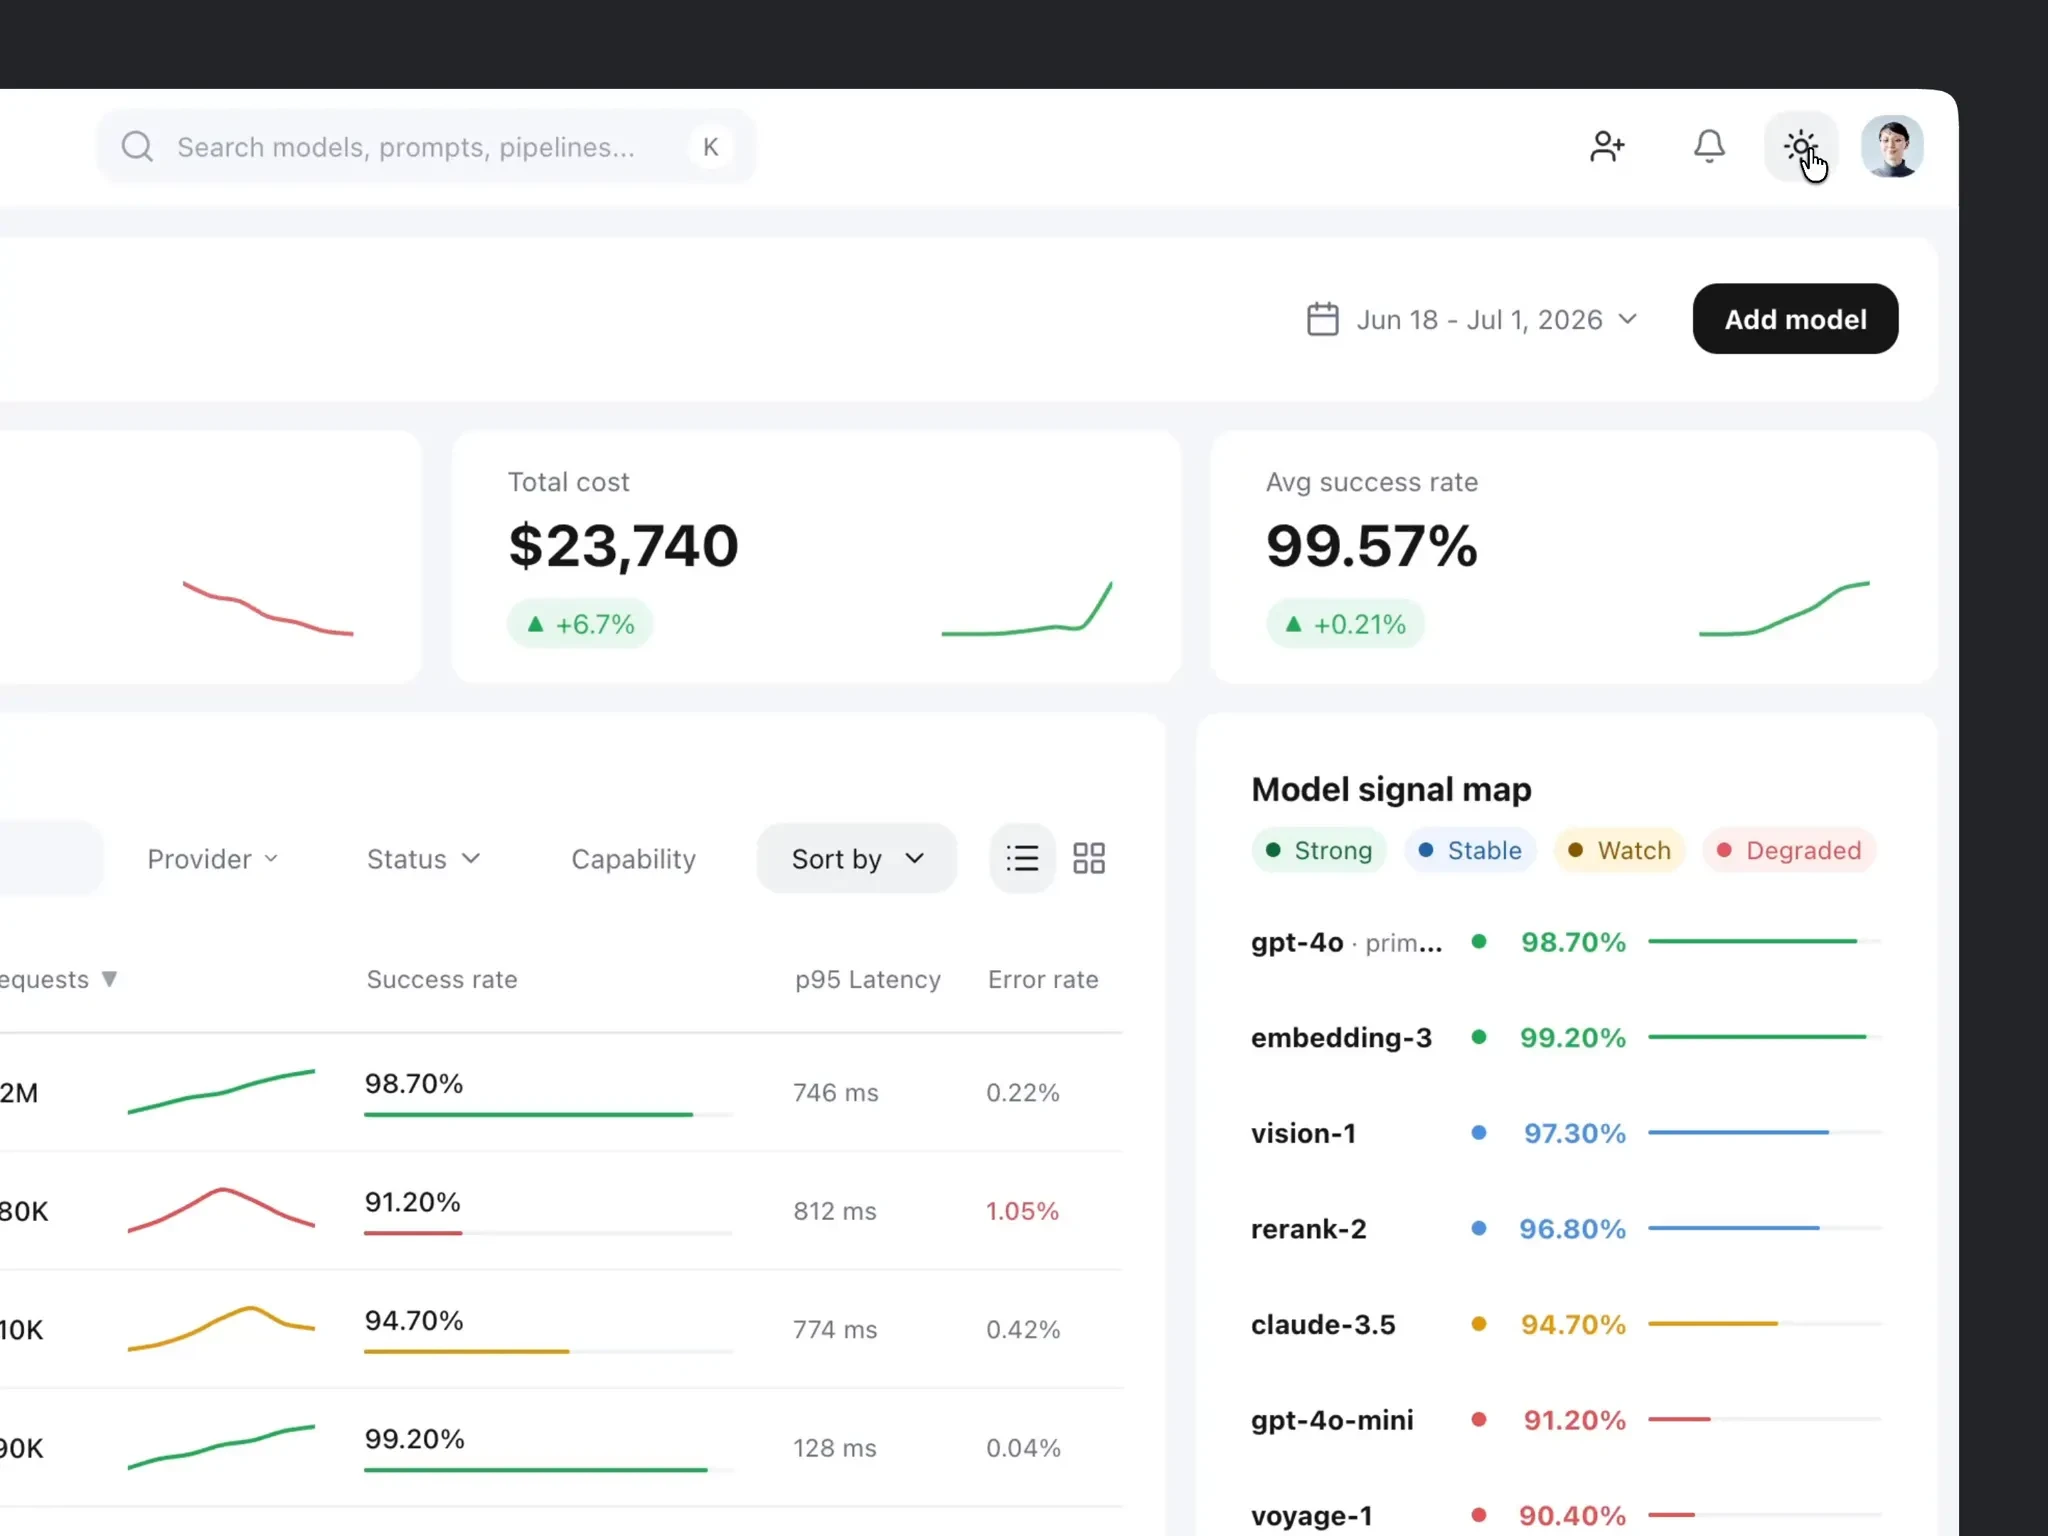
Overview: A high-level operational view combines request volume, latency, error rate, cost and success rate with health mapping, recent pipeline activity, insights and tasks.
Models: A comparison workspace helps teams scan every active model by provider, capability, status, traffic, success rate, latency and error rate. Filters and compact trends make anomalies visible without opening each model individually.
Signals: An incident-focused workspace groups active, critical and acknowledged events. Severity, source and status filters support triage, while the detail panel brings together current metrics, trend history, affected scope and available actions.
DATA VISUALIZATION SYSTEM
Dense telemetry uses a consistent visual language: compact sparklines for direction, restrained semantic colors for health states, aligned numeric typography for comparison and progressive disclosure for investigation. The interface prioritizes operational meaning over decorative charts.
LIGHT AND DARK INTERFACE SYSTEM
The interface system uses light and dark directions for different monitoring contexts. The light version supports long sessions and rapid comparison across dense tables, while the dark version increases contrast around incidents, severity states and detailed signal analysis.
INTERACTION DIRECTION
Motion demonstrates how filters, charts, tooltips, side panels and state changes behave during real monitoring tasks. The transitions are intentionally short and functional so the interface remains calm while the underlying data changes.
OUTCOME
The result is a client MVP spanning fleet overview, model monitoring and signal triage. The product system establishes the core operational workflows and interface patterns needed to connect production telemetry and scale alert-prioritization rules.
Deliverables
Product architecture, fleet overview, model comparison, signal triage, status system, cost and health visualizations, filters, detail panels and motion direction.
PRODUCT WALKTHROUGH
01. Operations overview
02. Model monitoring and comparison
03. Signal triage and incident investigation
01. Operations overview: requests, latency, error rate, cost and model health.
02. Model monitoring: fleet comparison, filters and model-level signals.
03. Signal triage: severity filters, incident details and affected scope.
Like this project
Posted Aug 3, 2026
Client MVP for monitoring system health, latency, cost, and incidents across overview, comparison, and signal-triage workflows.
Likes
0
Views
7