
The brief
The channel development team for Starbucks ready-to-drink (RTD) coffee in France and Belgium needed one place to see how the brand performs against the whole RTD market, by country, brand, format and time period, from retail market data.
What I built
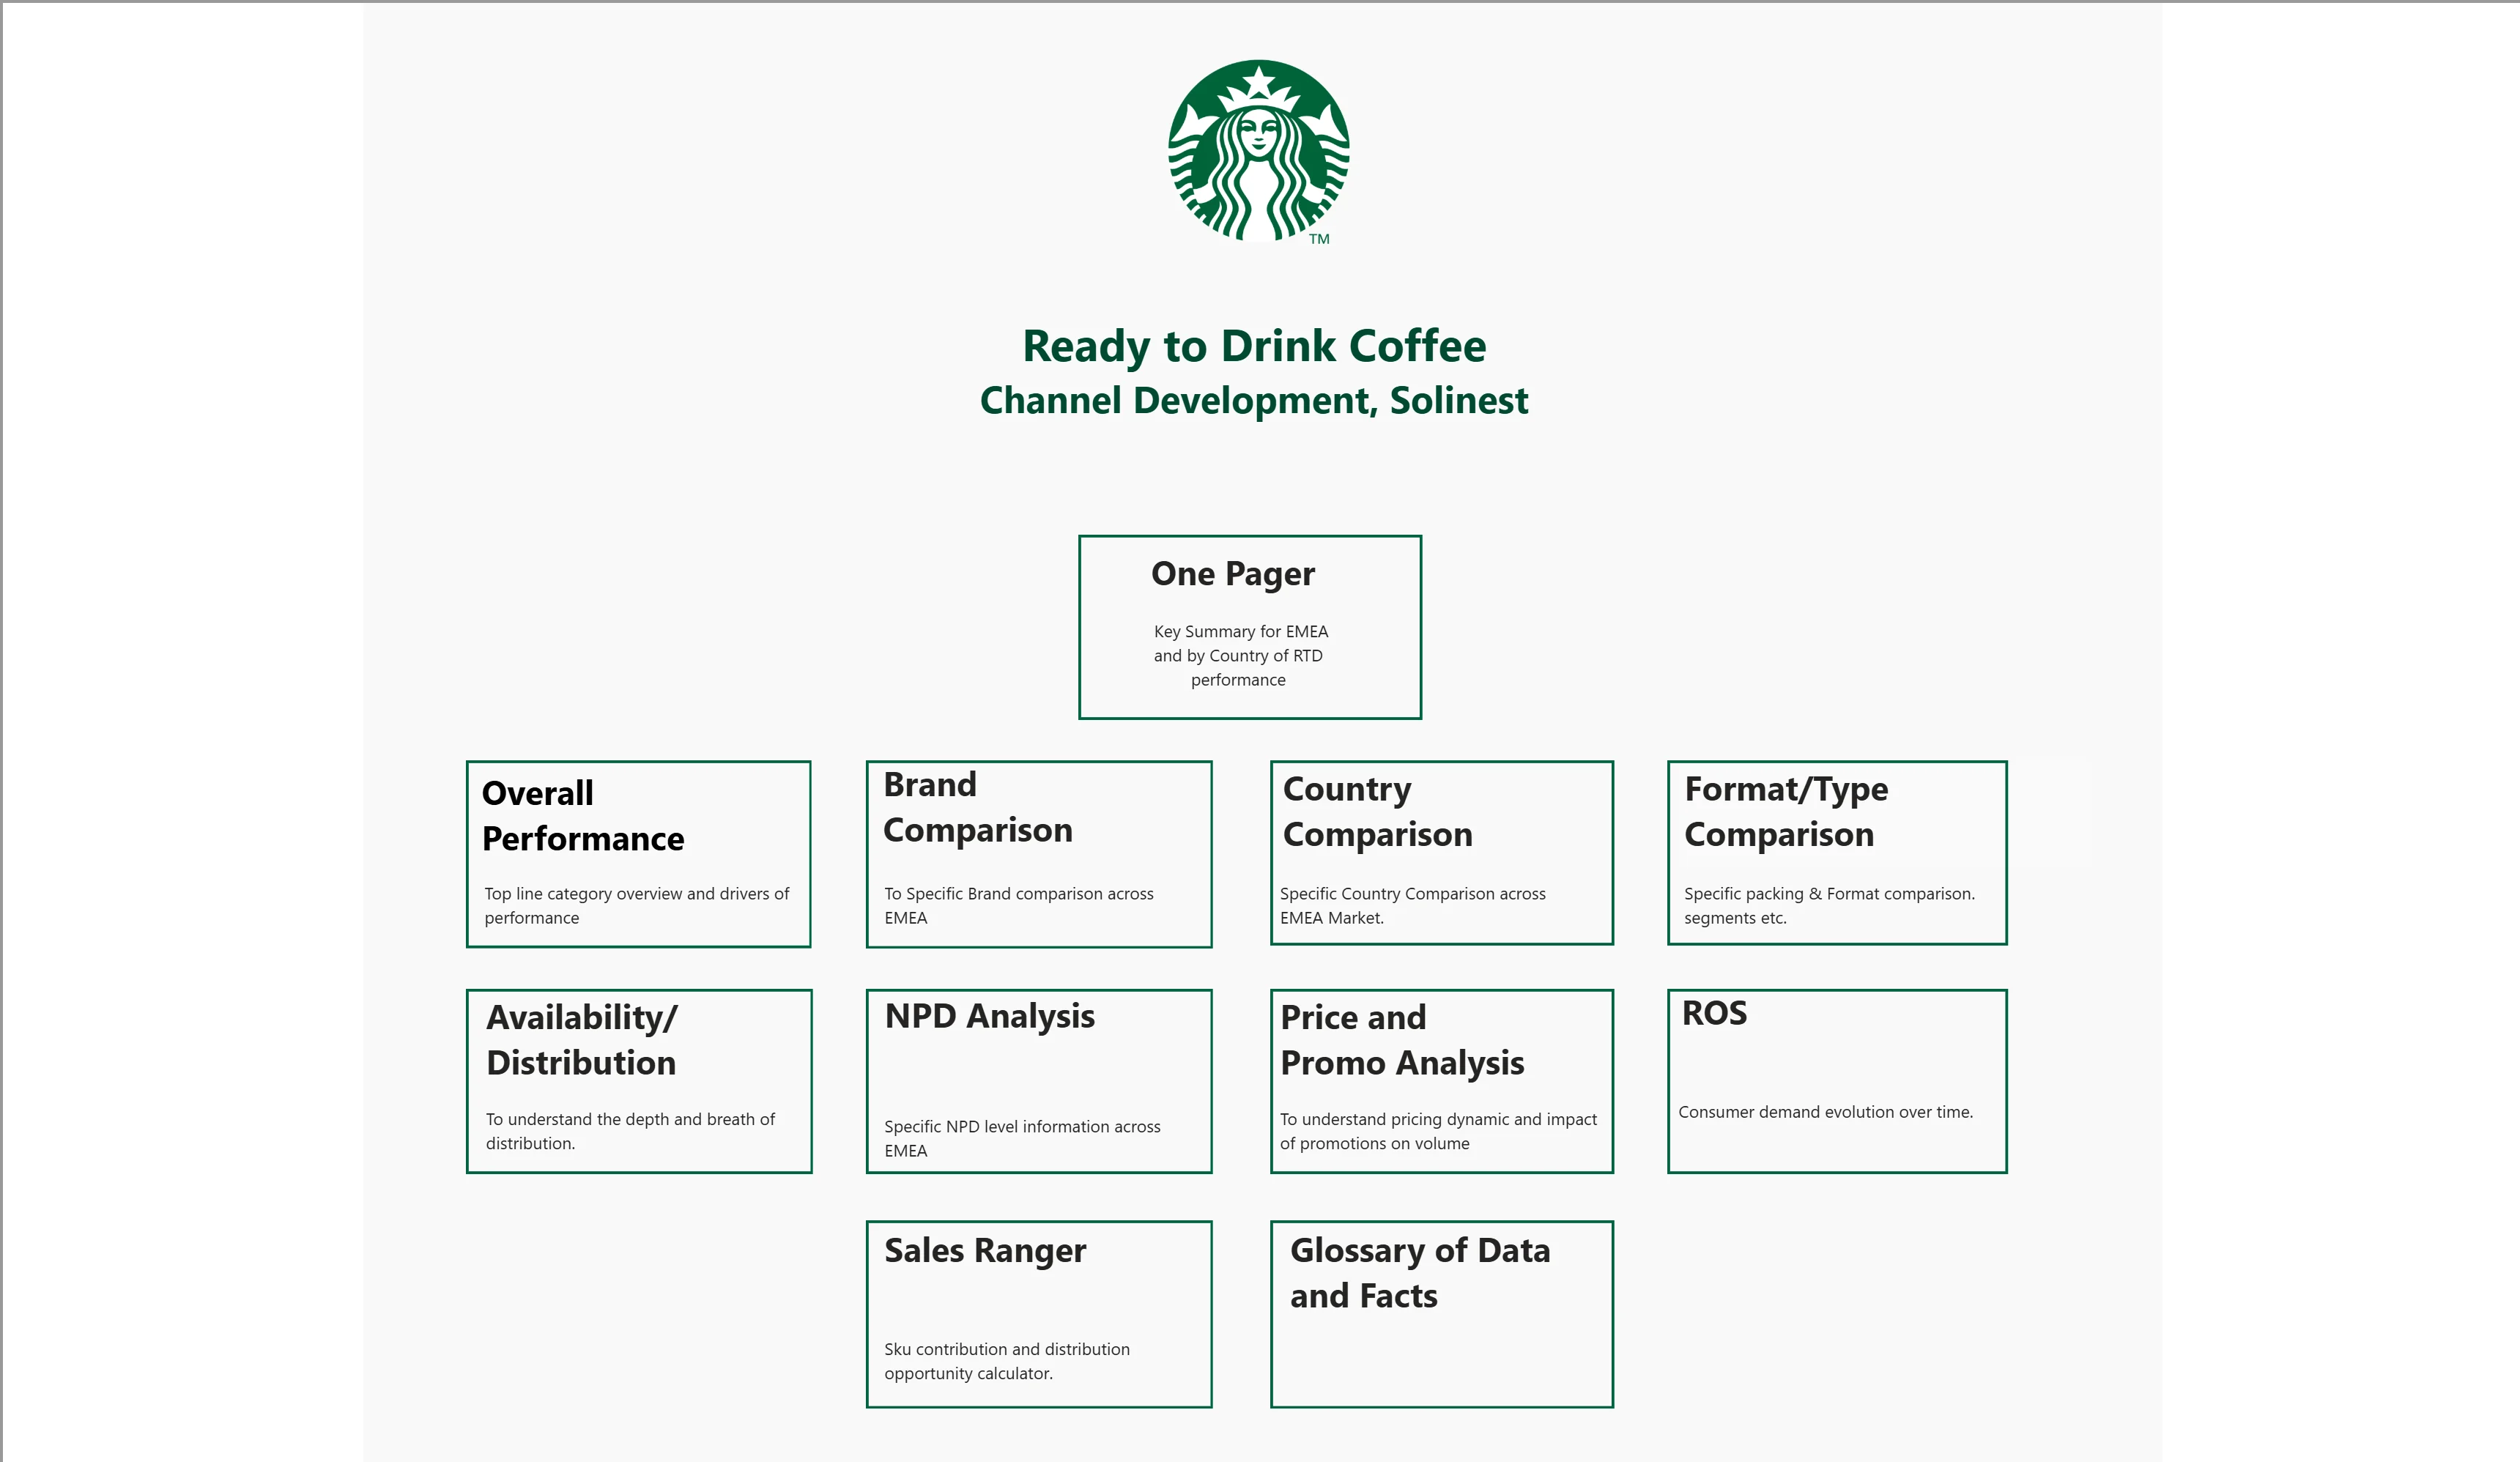
An 11-page Power BI report with a landing page that sends each question to the right page
Brand, country and format comparisons across the region
Price and promotion, distribution depth and breadth, new product launches and rate of sale
A "Sales Ranger" calculator for SKU contribution and distribution opportunity
A glossary of data and measures, so every reader uses the same definitions
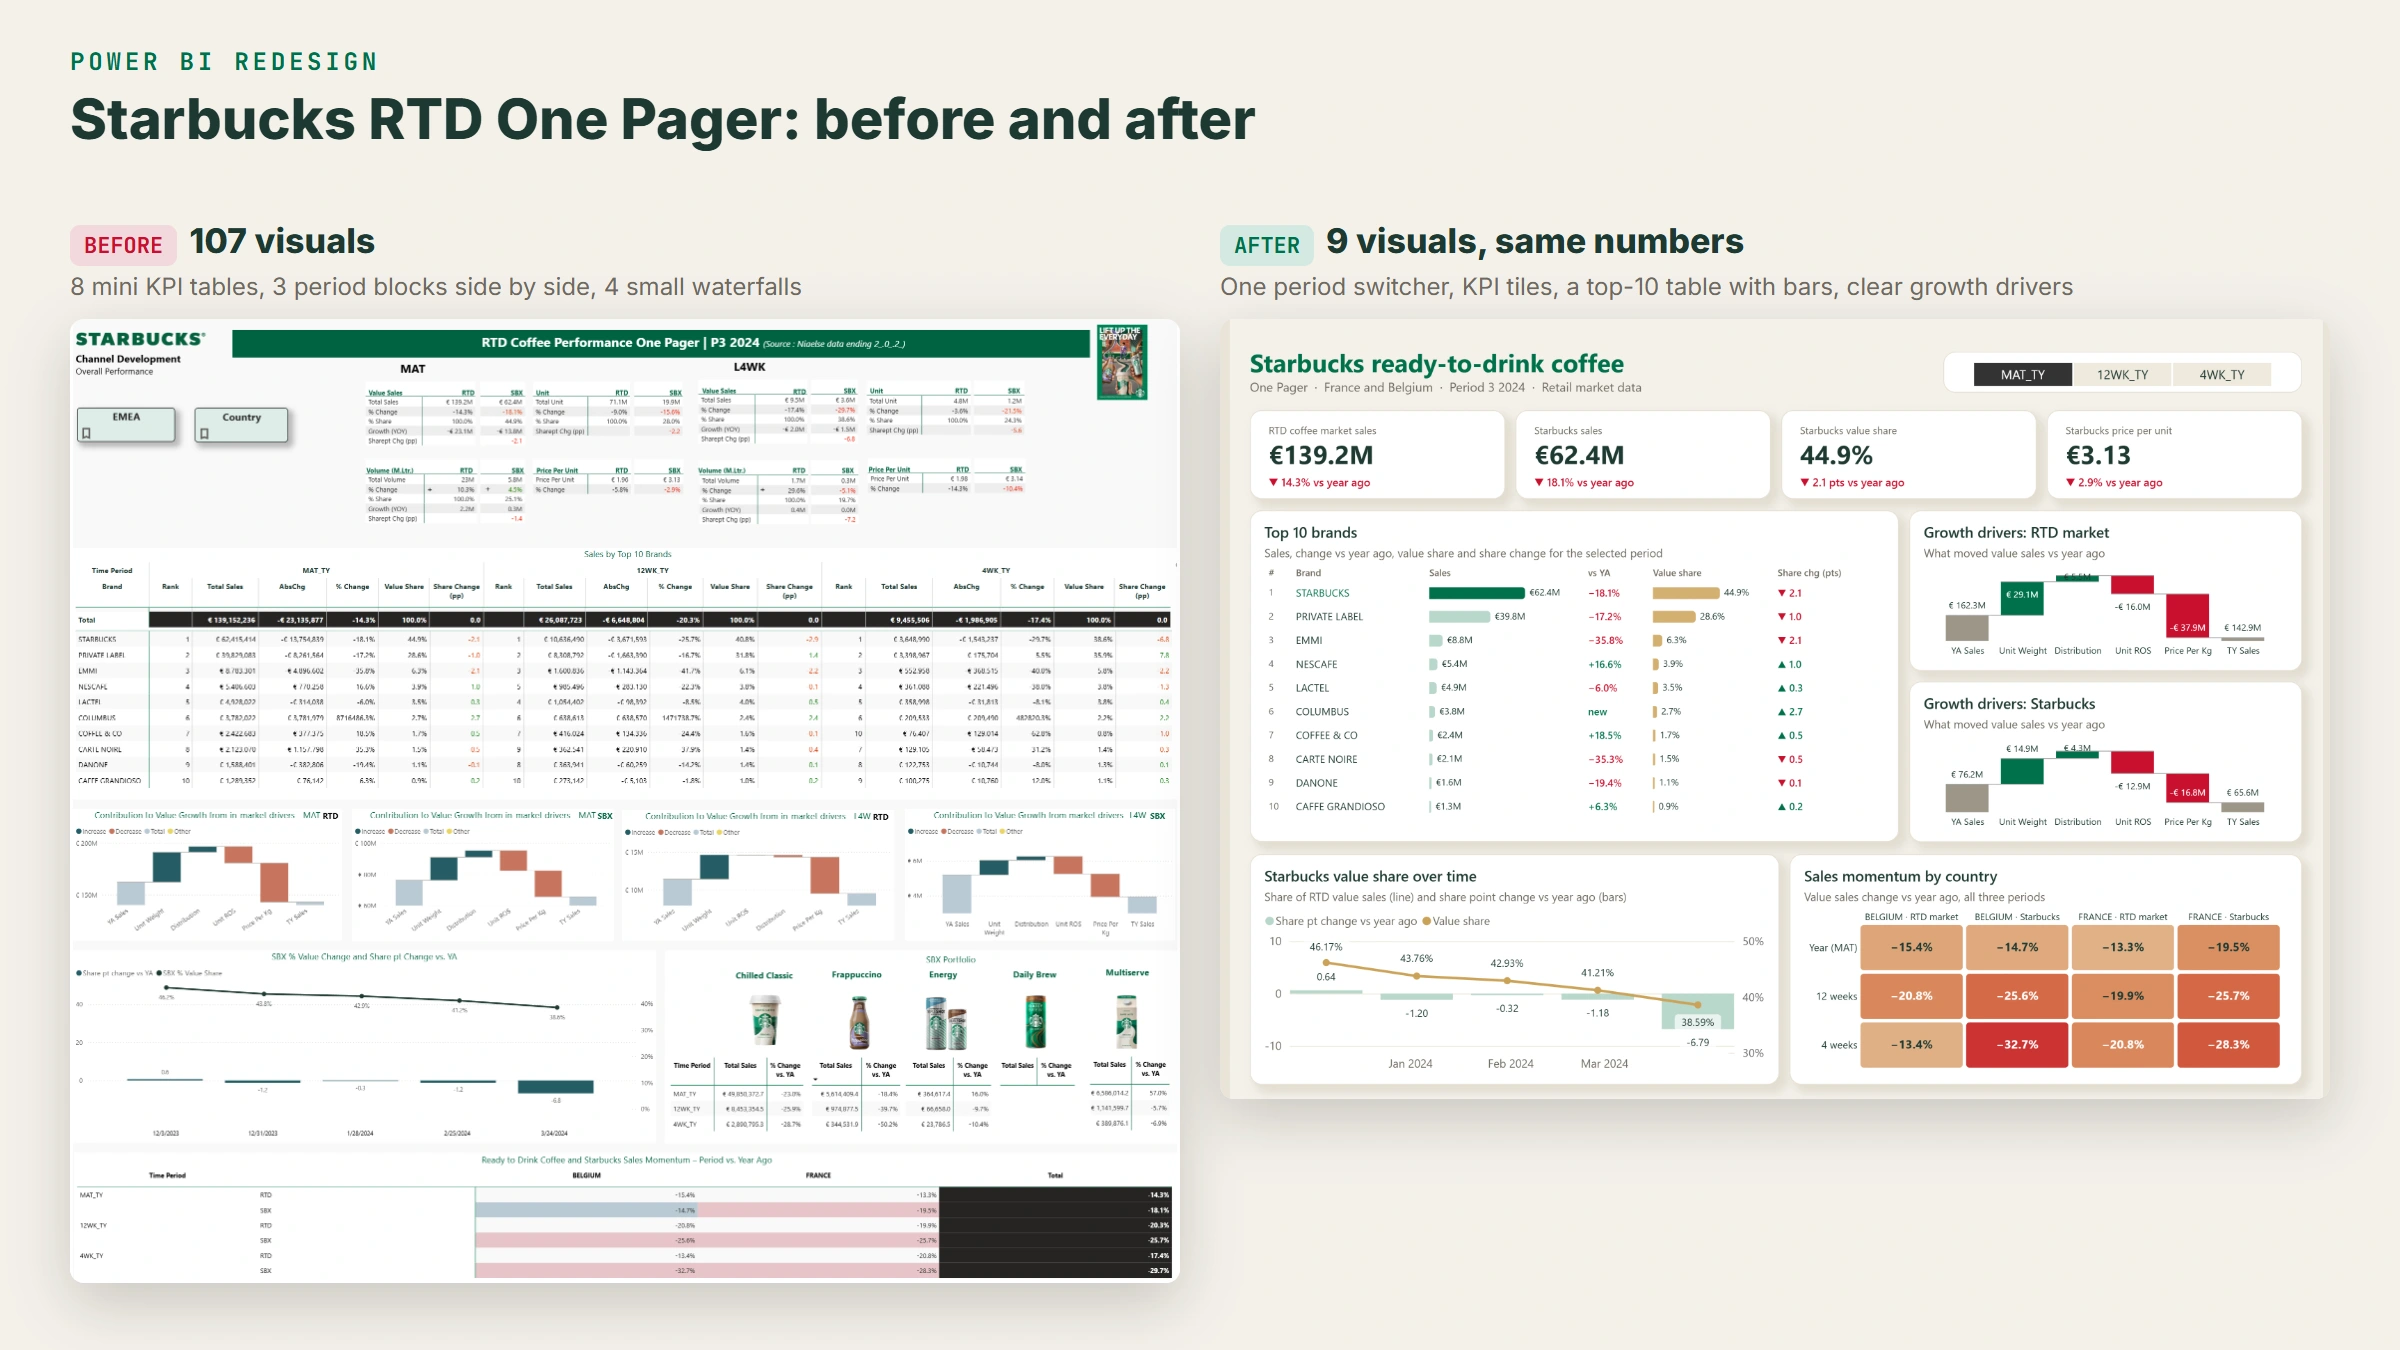
The redesign: One Pager, before and after
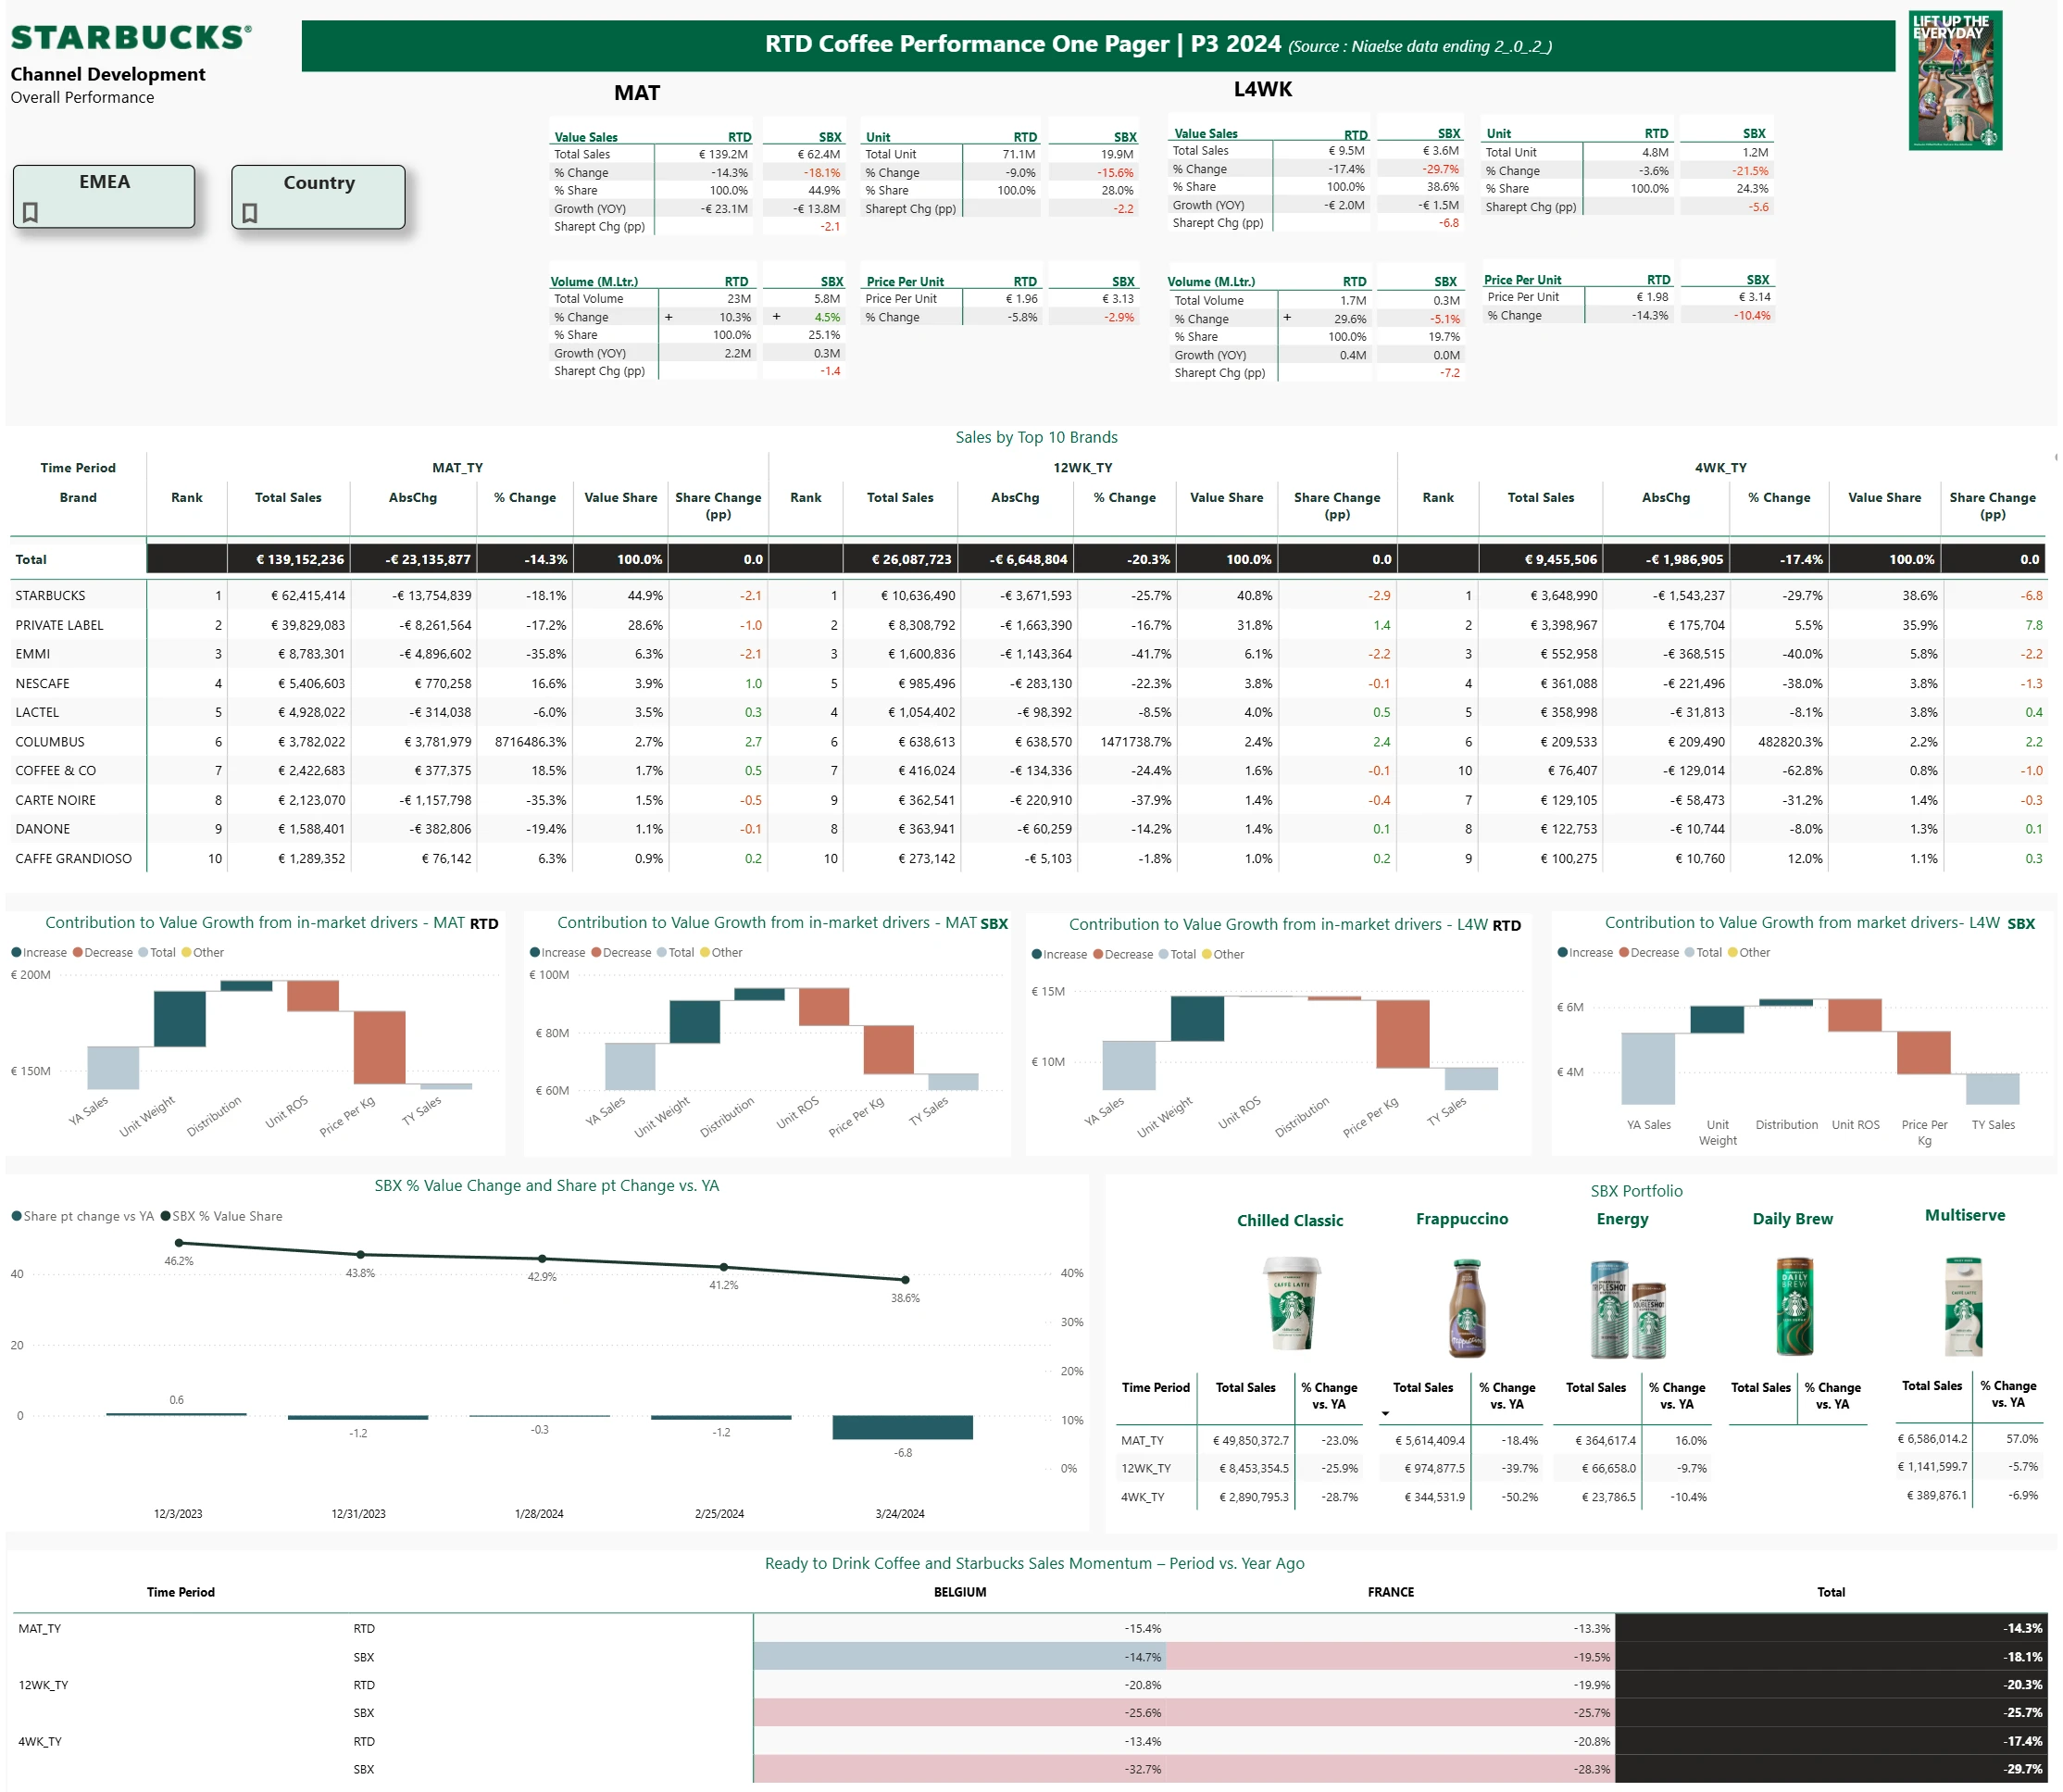
The original One Pager answered every question, but with 107 visuals: 8 mini KPI tables, three period blocks side by side and four small waterfalls. I rebuilt it on the same data model, with the same numbers:
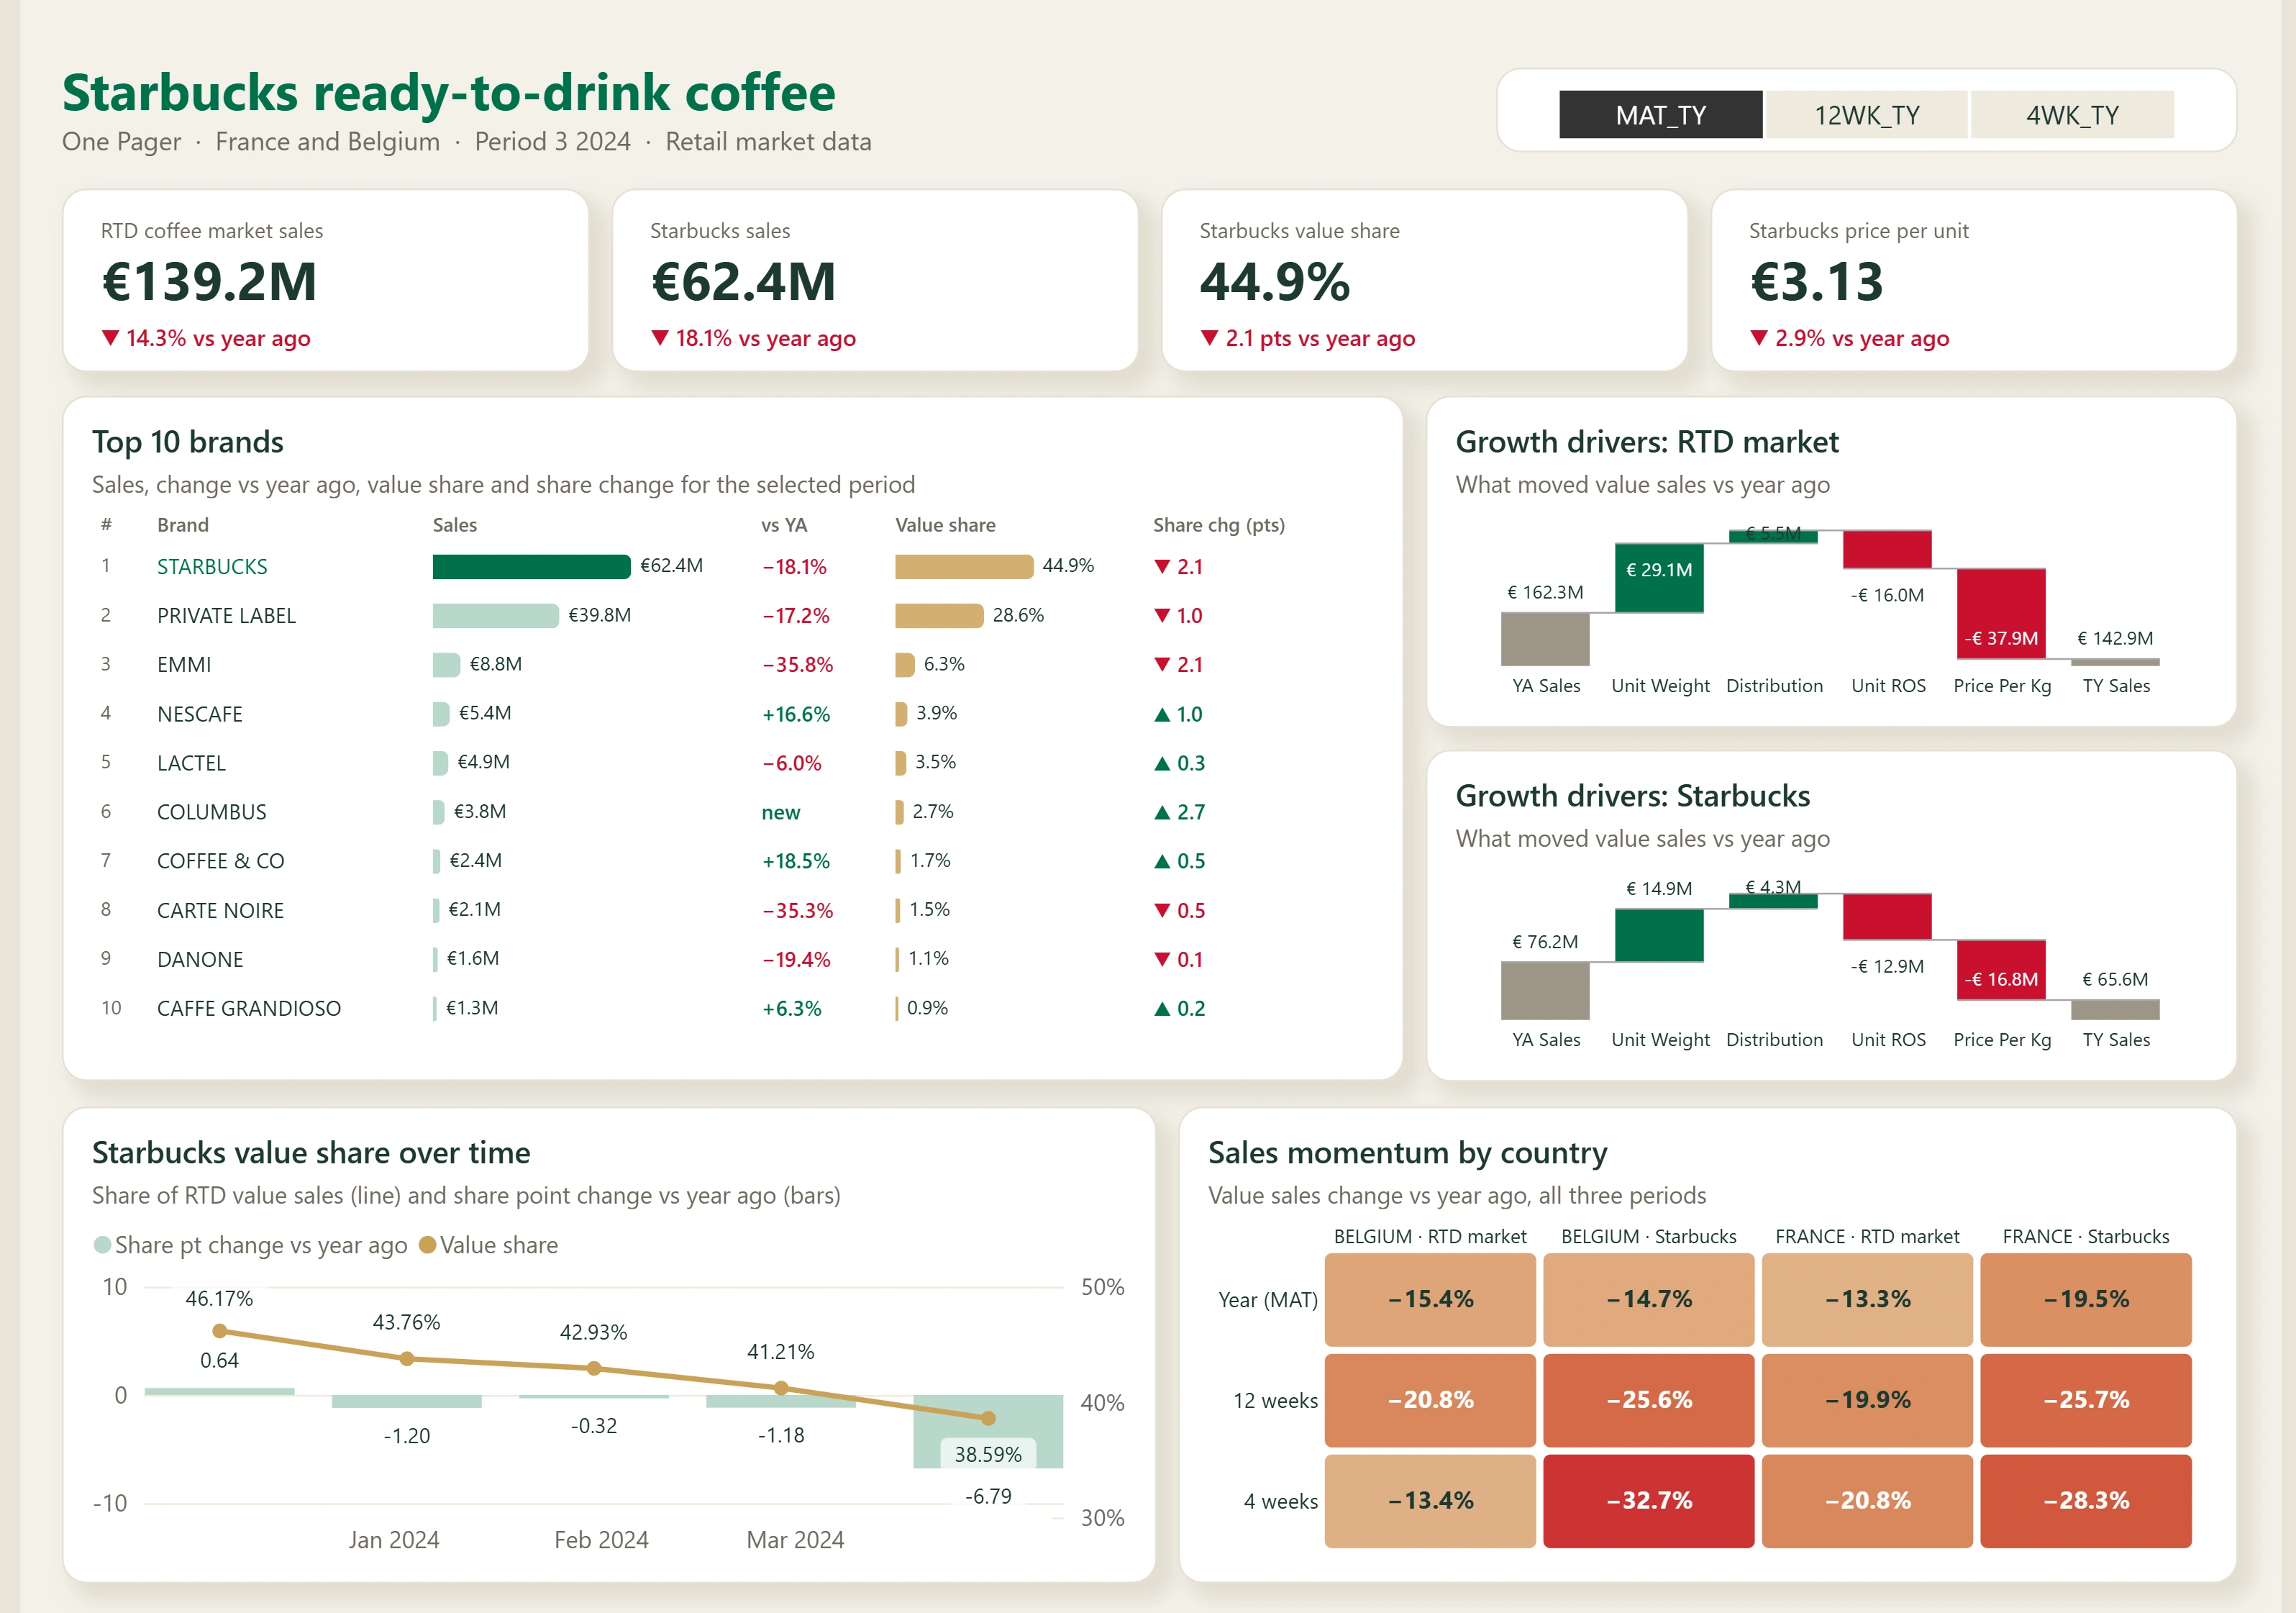
One period switcher (year, 12 weeks, 4 weeks) instead of three repeated blocks
Four KPI tiles leadership reads first: market sales, Starbucks sales, value share and price per unit, each with its change vs year ago
A top-10 brand table with in-cell bars and share-change arrows instead of a wall of numbers
Market vs Starbucks growth drivers side by side
The share trend and a country momentum grid for all three periods
107 visuals became 9. Real client project; figures are scaled.
1 like · 54 views · Apr 7, 2025
11-page Power BI report for Starbucks RTD coffee in France and Belgium, plus a One Pager redesign: 107 visuals down to 9, same numbers.
