

The brief
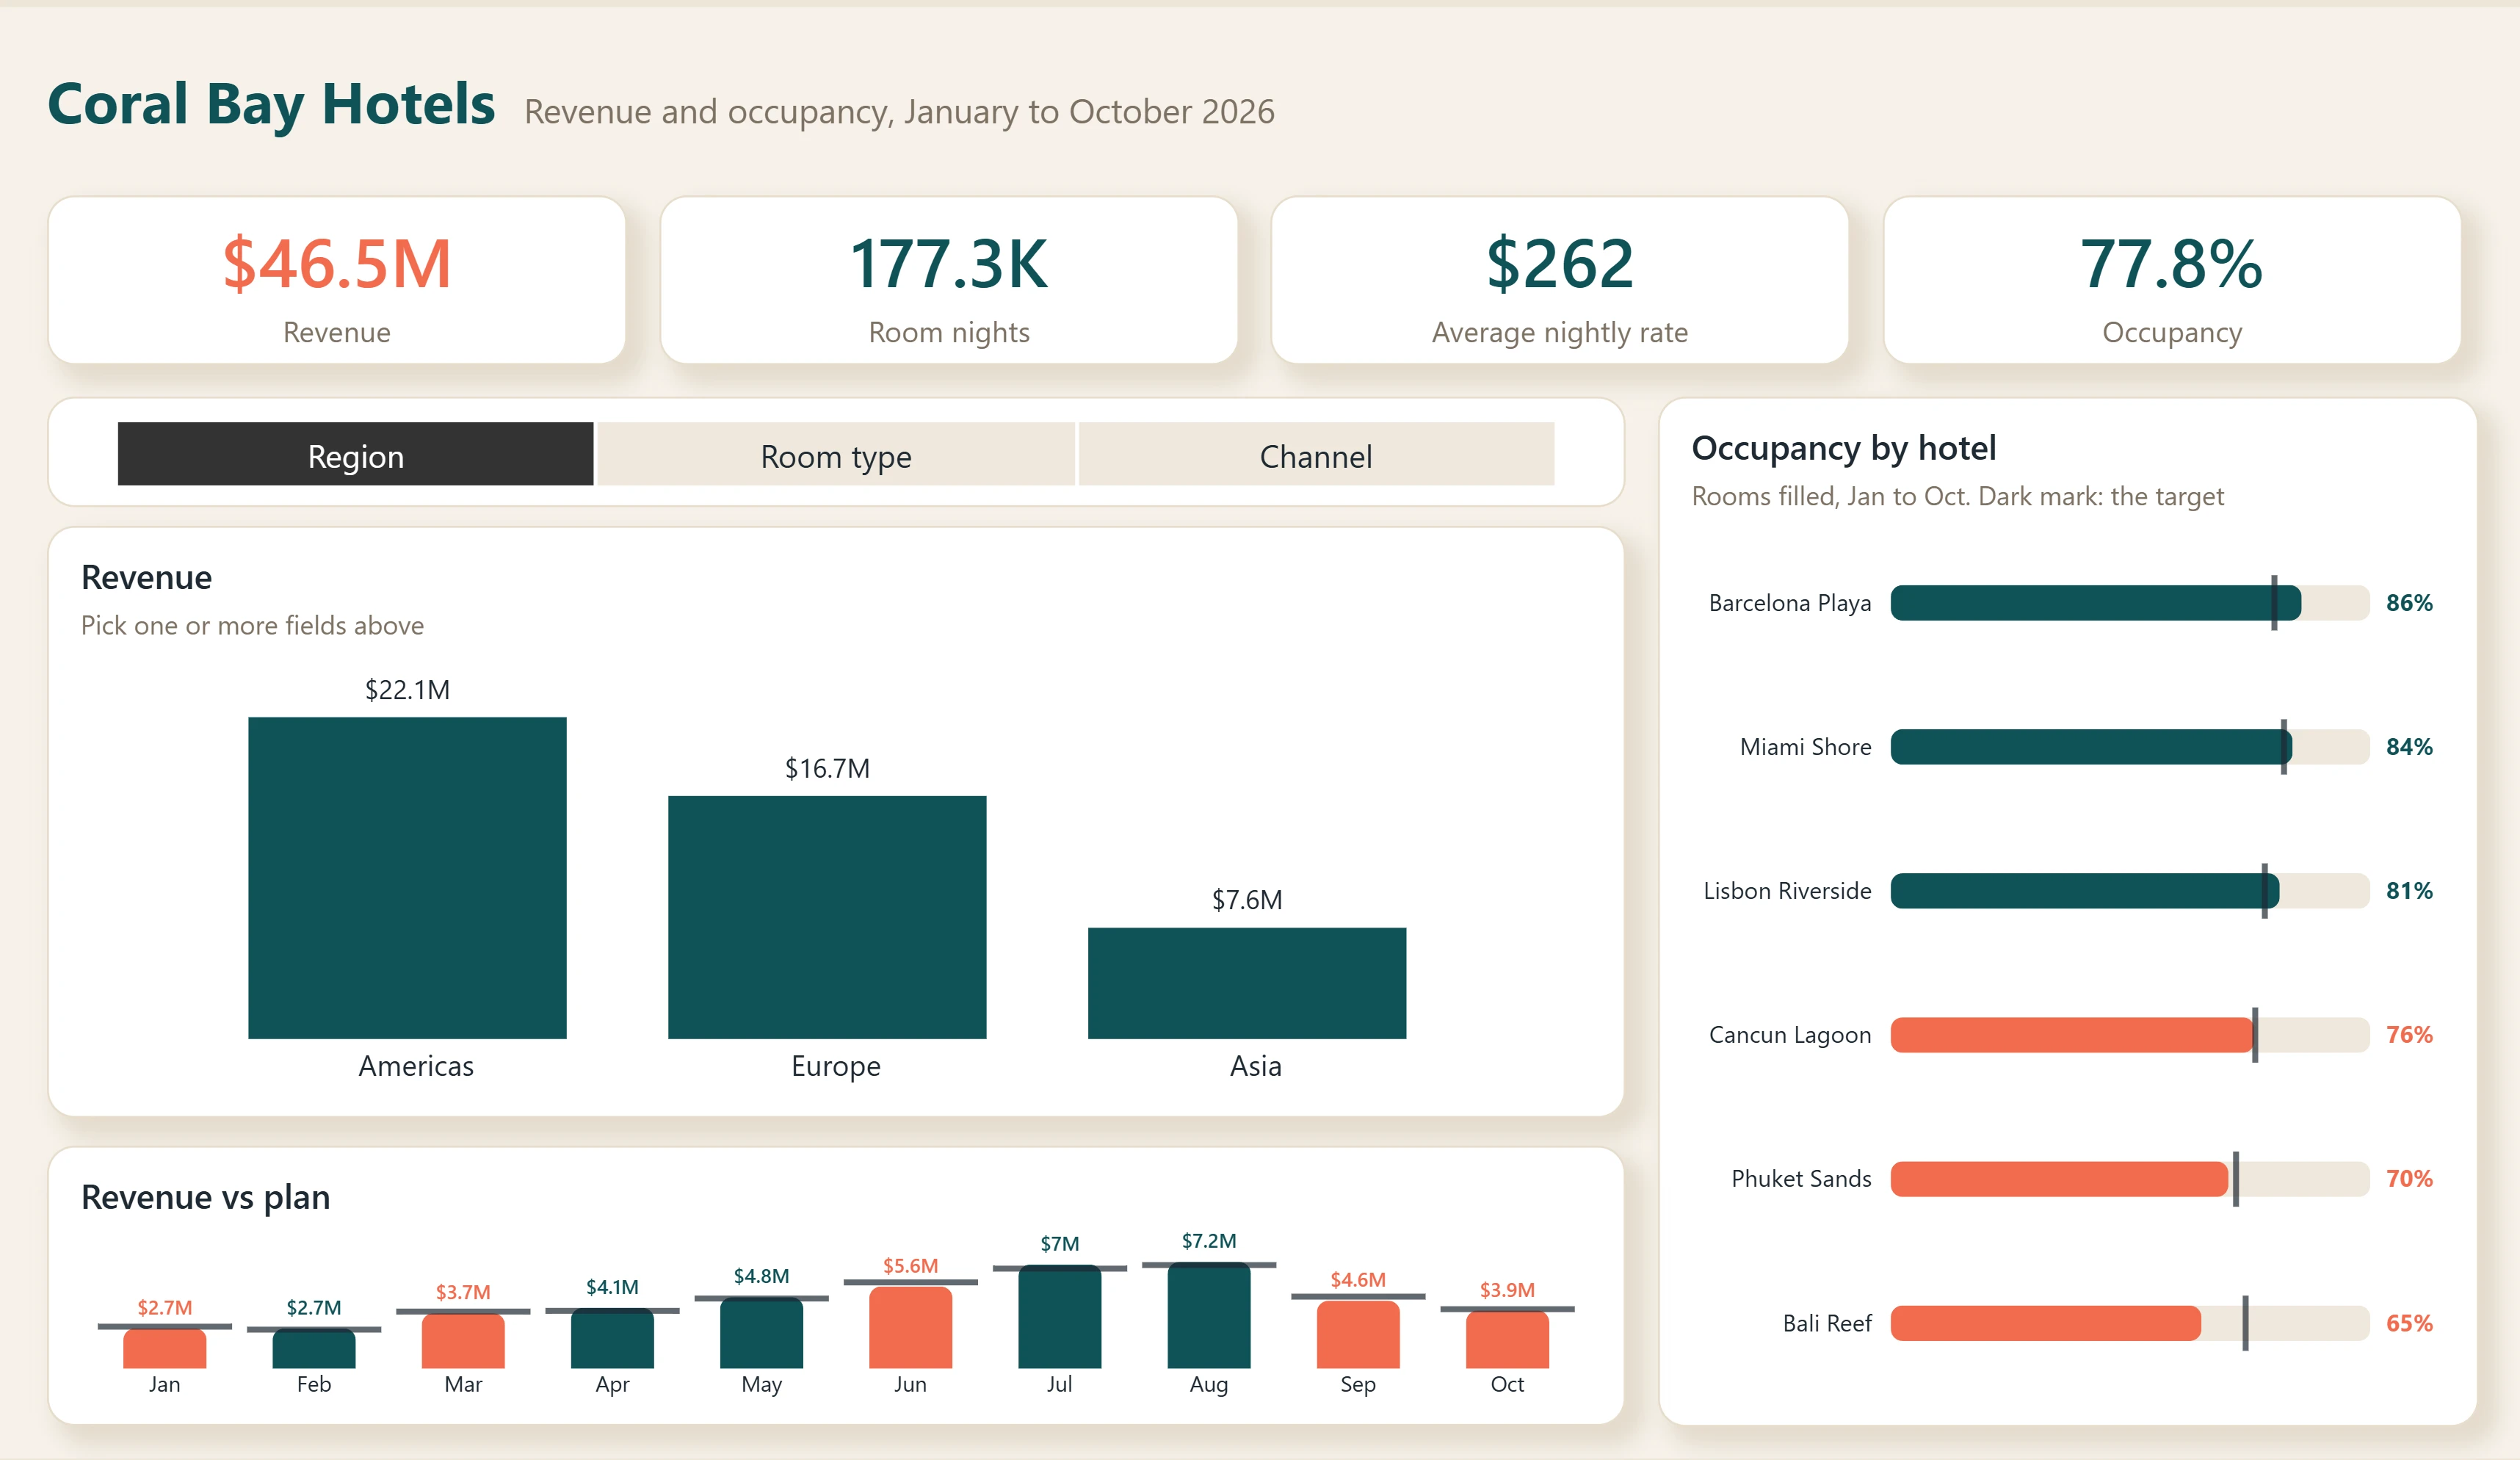
A hotel group's revenue manager wants to look at revenue by region, room type or sales channel, without a page of near-identical charts, and see at once which months and which hotels are behind.
Design decisions
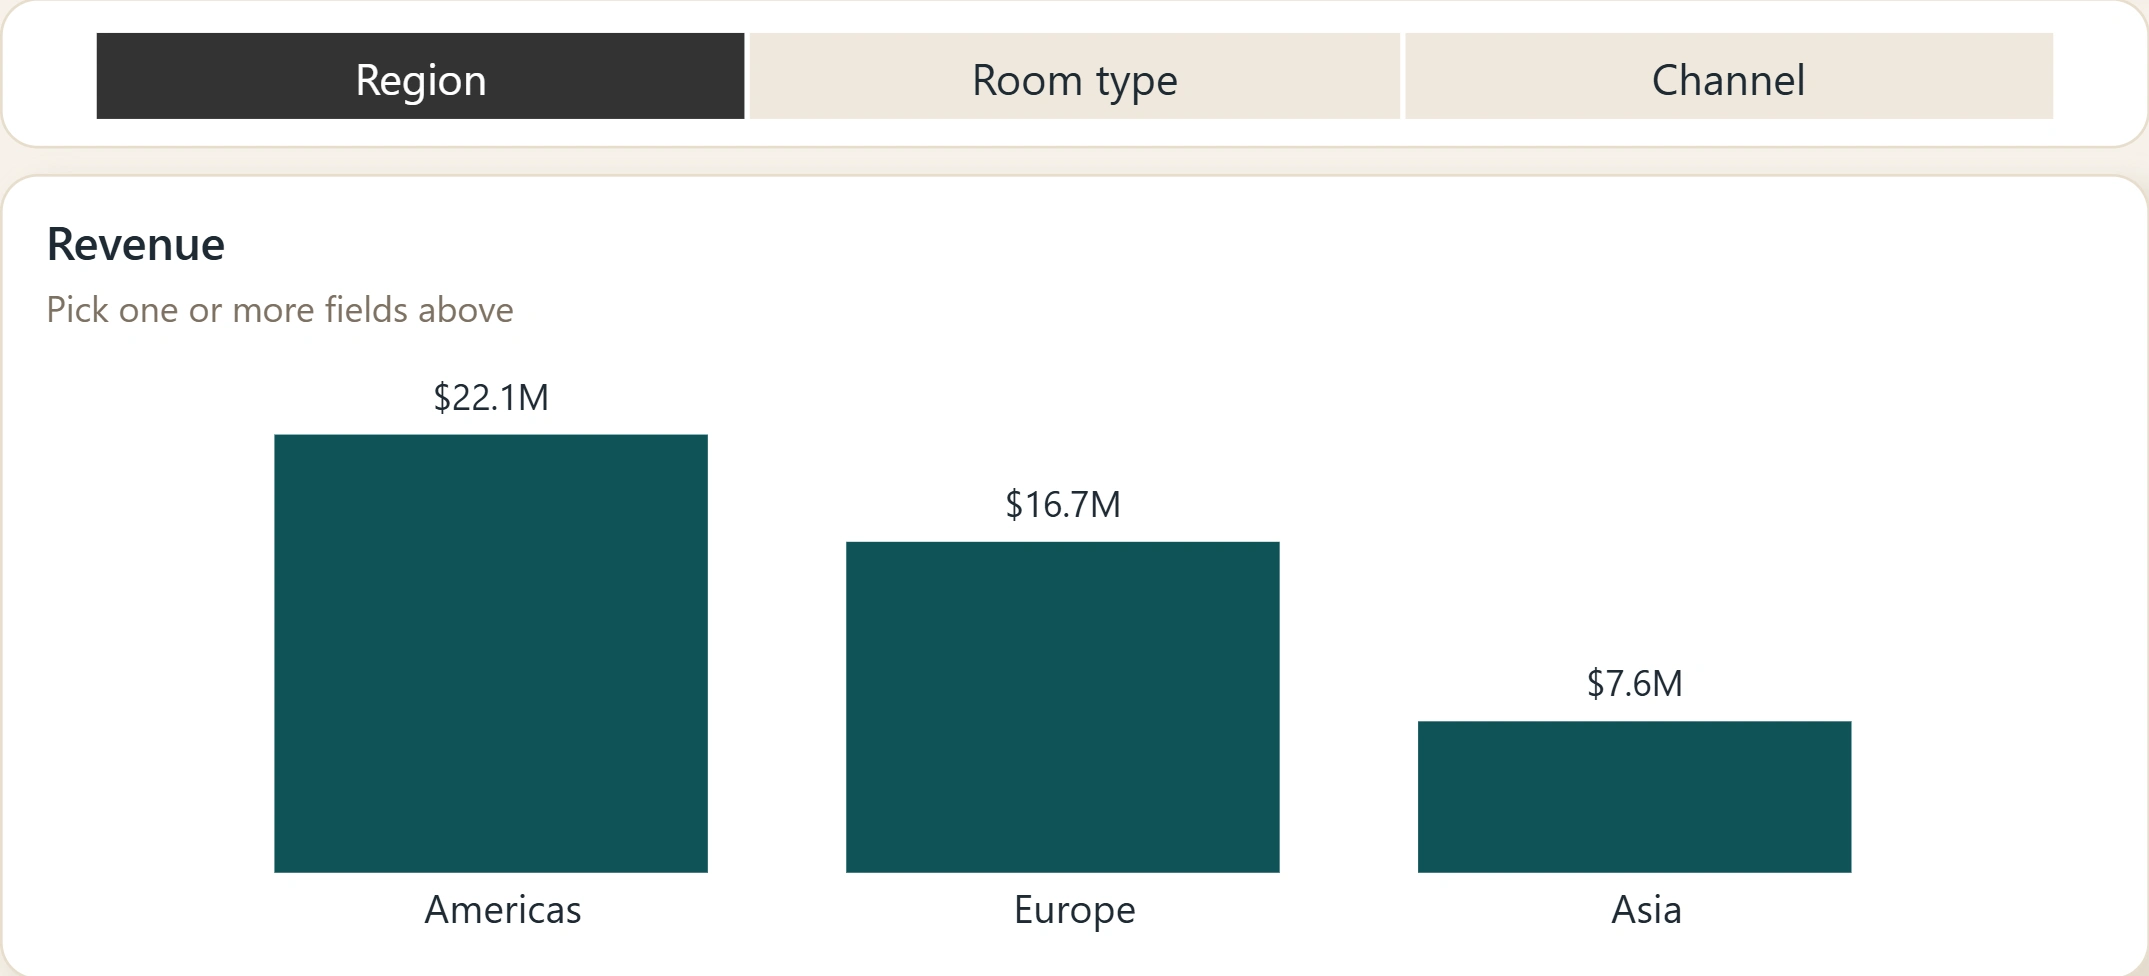
One revenue chart with a "View by" switcher (Region, Room type, Channel) instead of three charts. Pick two and the axis expands to both levels, so "Deluxe rooms in the Americas" is one click away.
The switcher is set up for viewers on the web and on touch: plain clicks add a field, no Ctrl key needed.
Revenue vs plan shows the plan as a mark on each bar, and only the months below plan turn coral. The eye goes straight to the problem months.
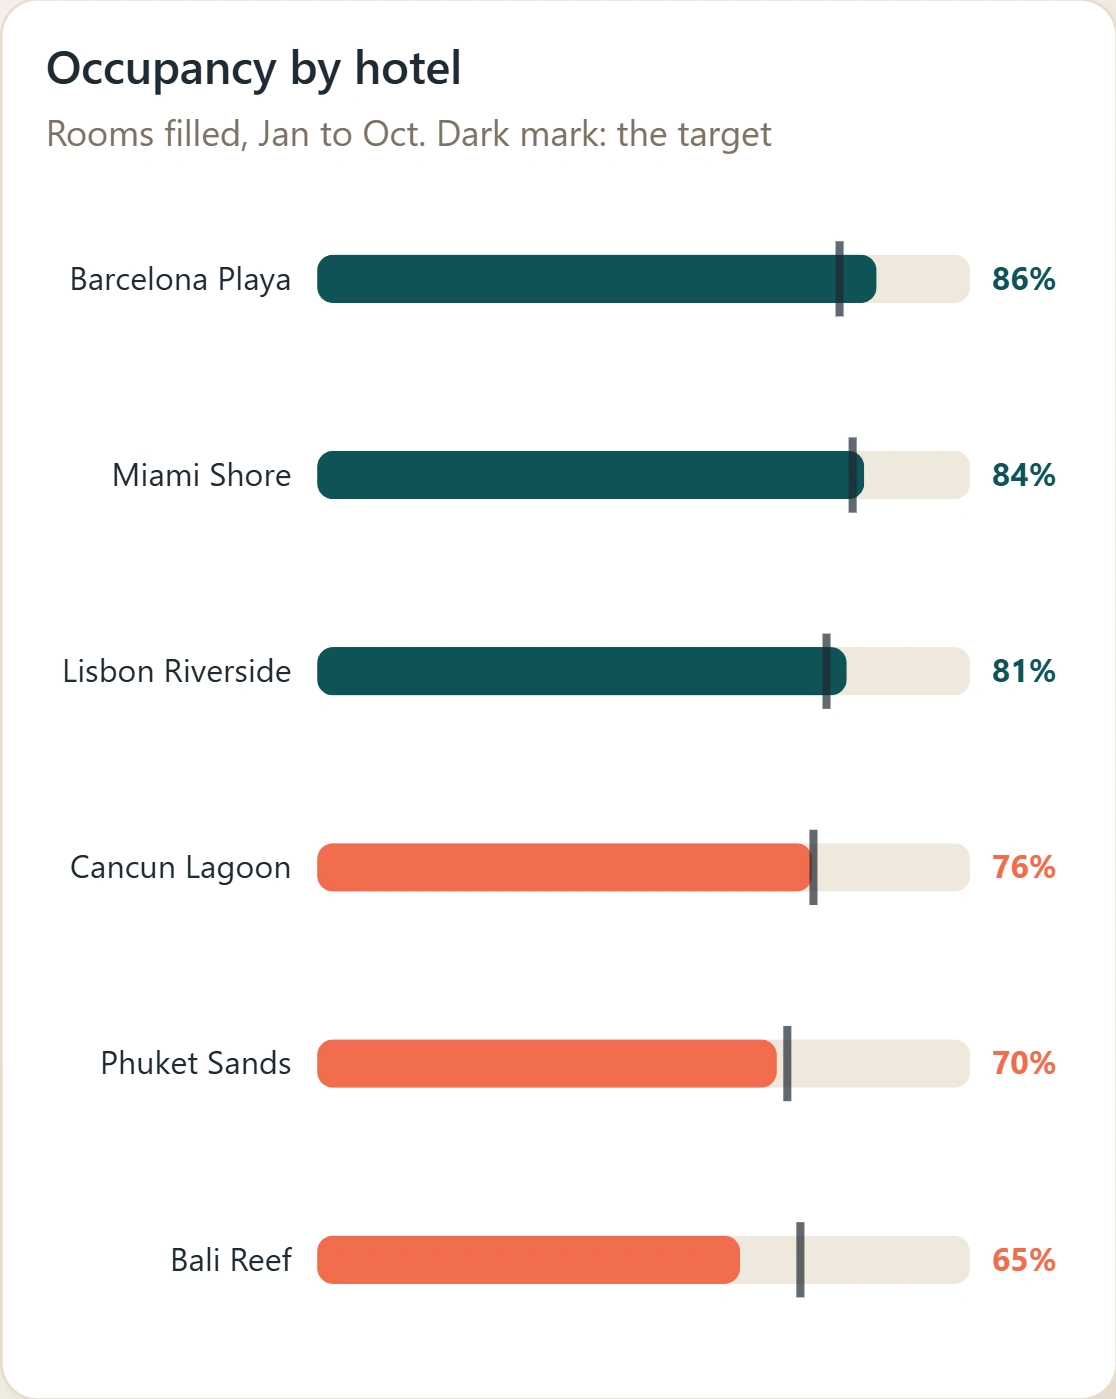
Occupancy by hotel uses bars with a target mark, sorted best to worst; hotels under target turn coral.
A warm, light theme with one alert colour, so coral always means "look here".
What I built
Power BI report and semantic model with a field parameter switcher, two Deneb charts (revenue vs plan, occupancy vs target), a custom theme, and a single-parameter data source. Published to the Power BI service and tested the way viewers use it. Sample data, fictional company. Used in my Tiny Fixes episode 10.
0 likes · 0 views · Nov 11, 2026
A demo hotel dashboard: KPI cards, one revenue chart you switch by region, room type or channel, revenue vs plan, and occupancy vs target.
