
The brief
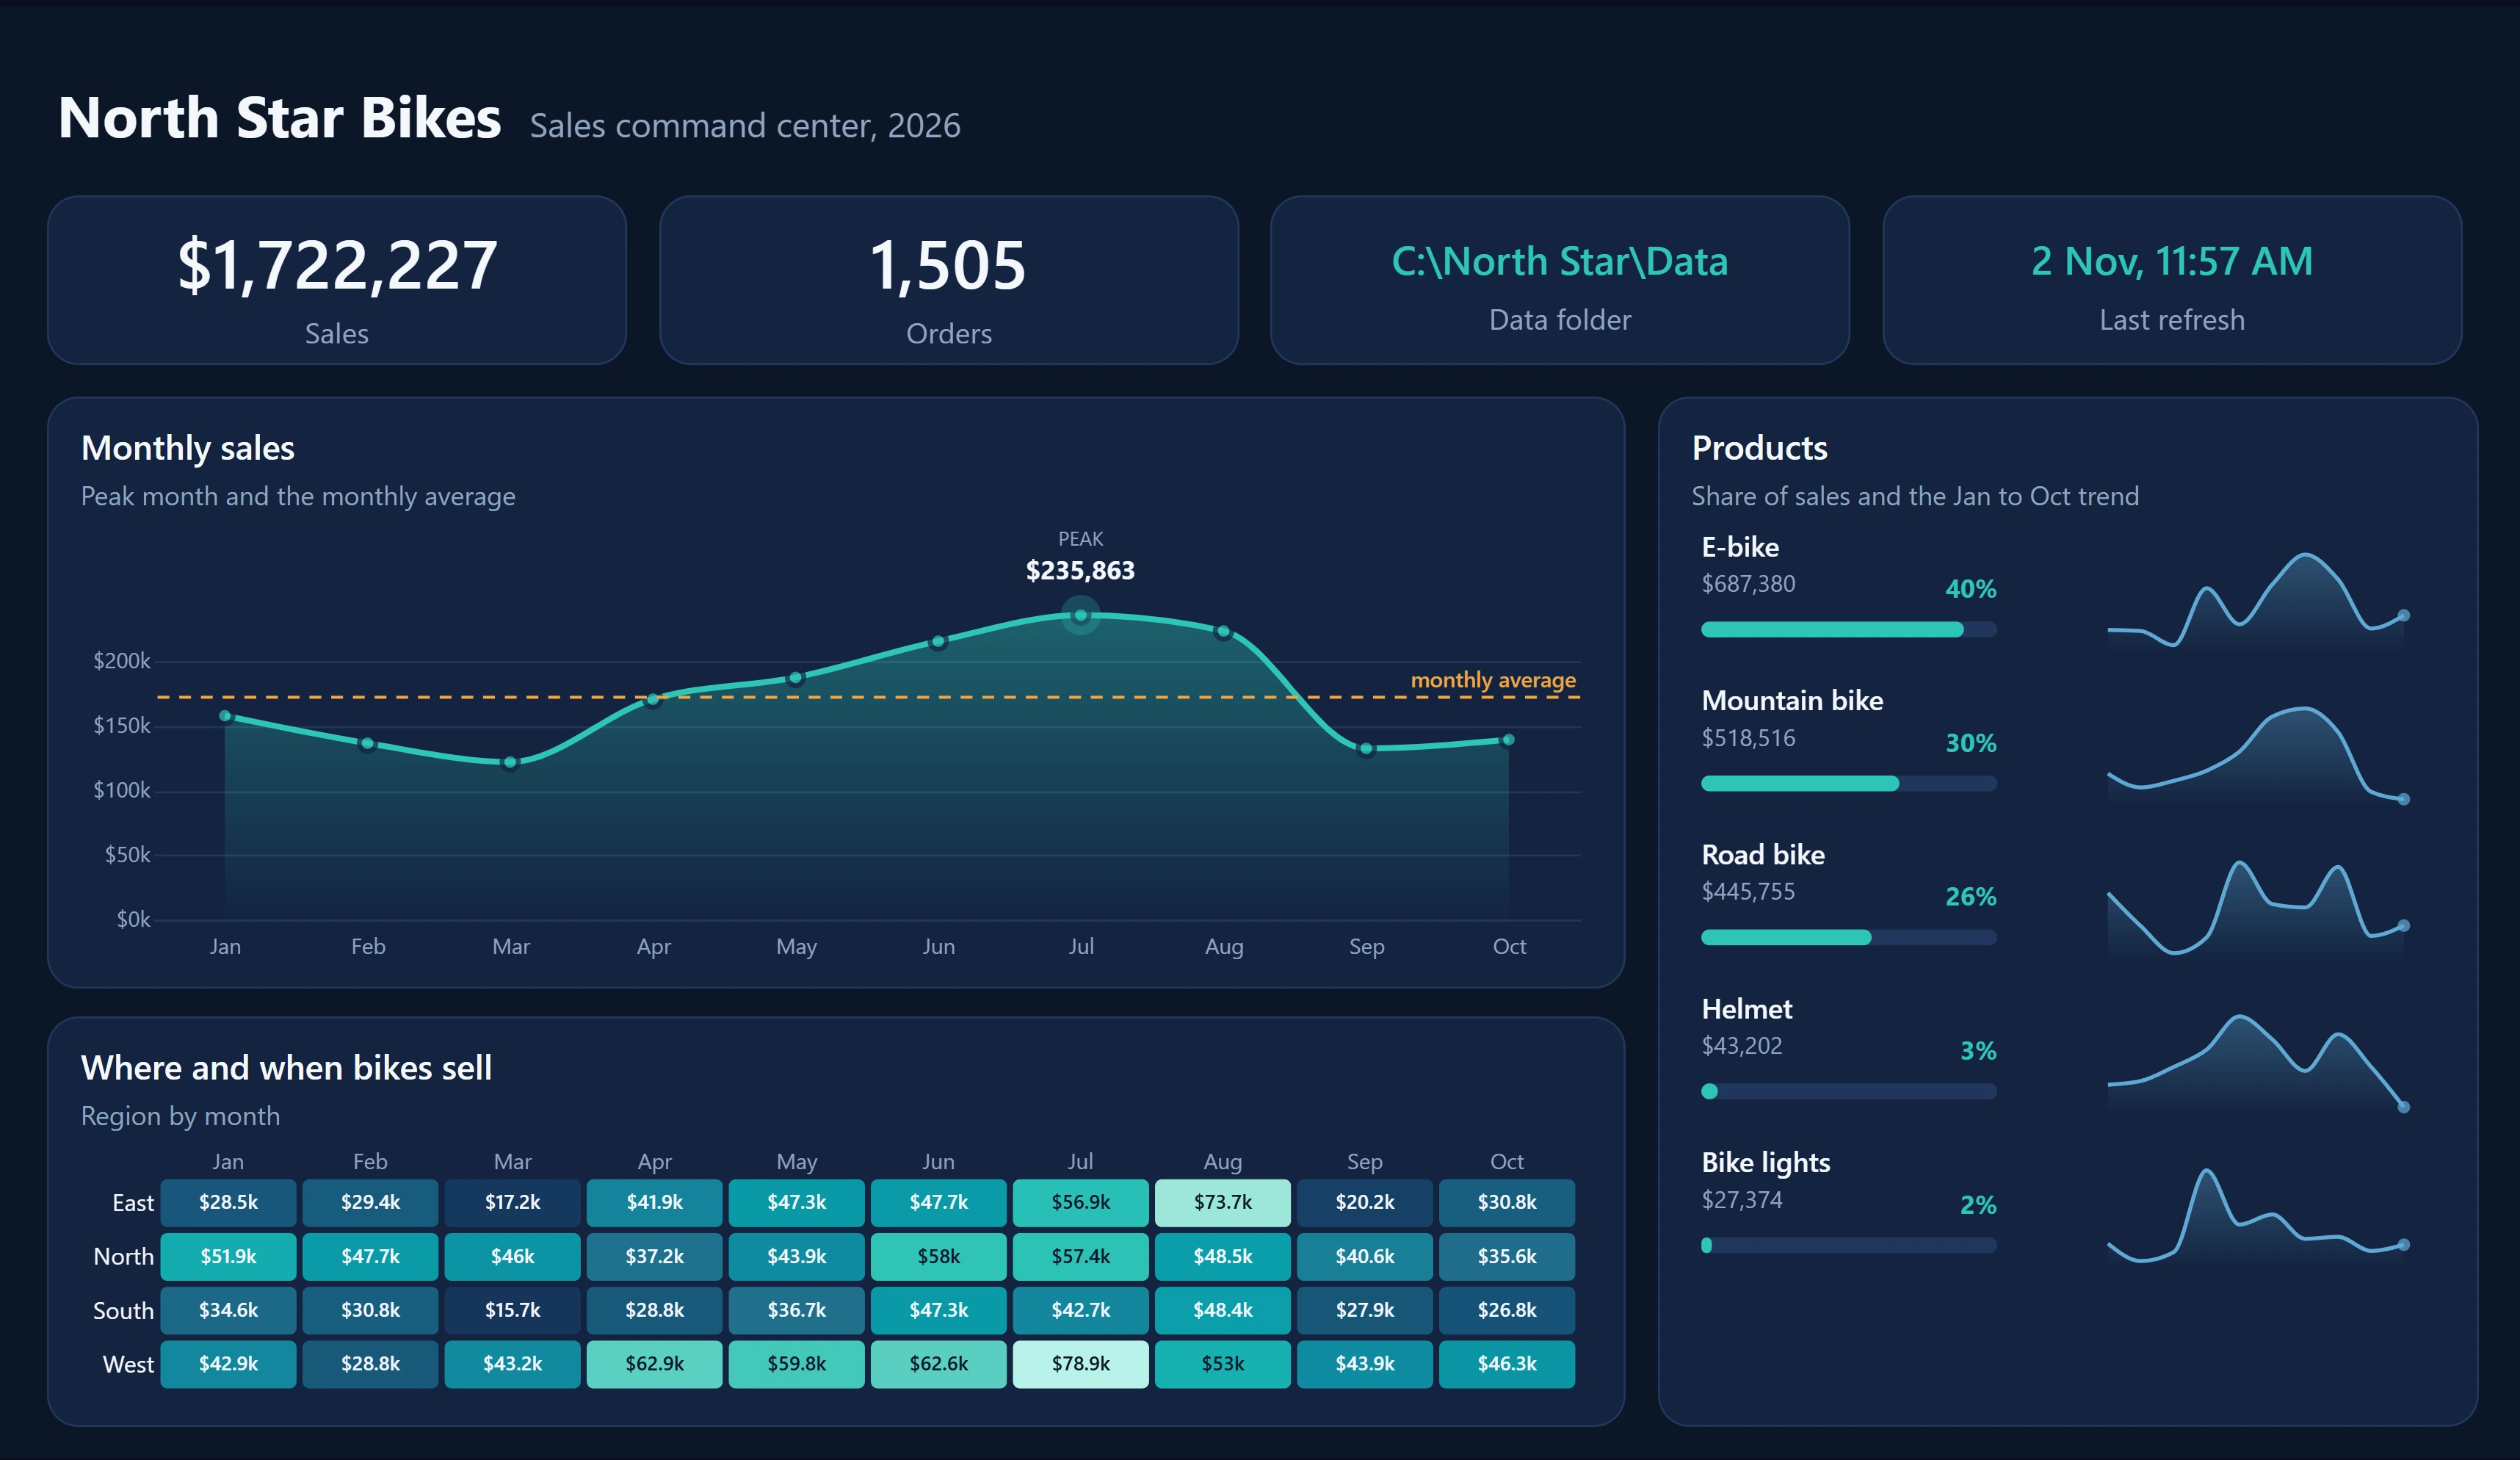
A bike retailer's sales team meets every Monday in front of one screen. They need three answers in under a minute: are we on track, where and when do bikes sell, and which products carry the business?
Design decisions
One question per panel, written as the panel's subtitle, so nobody has to guess what a chart is for.
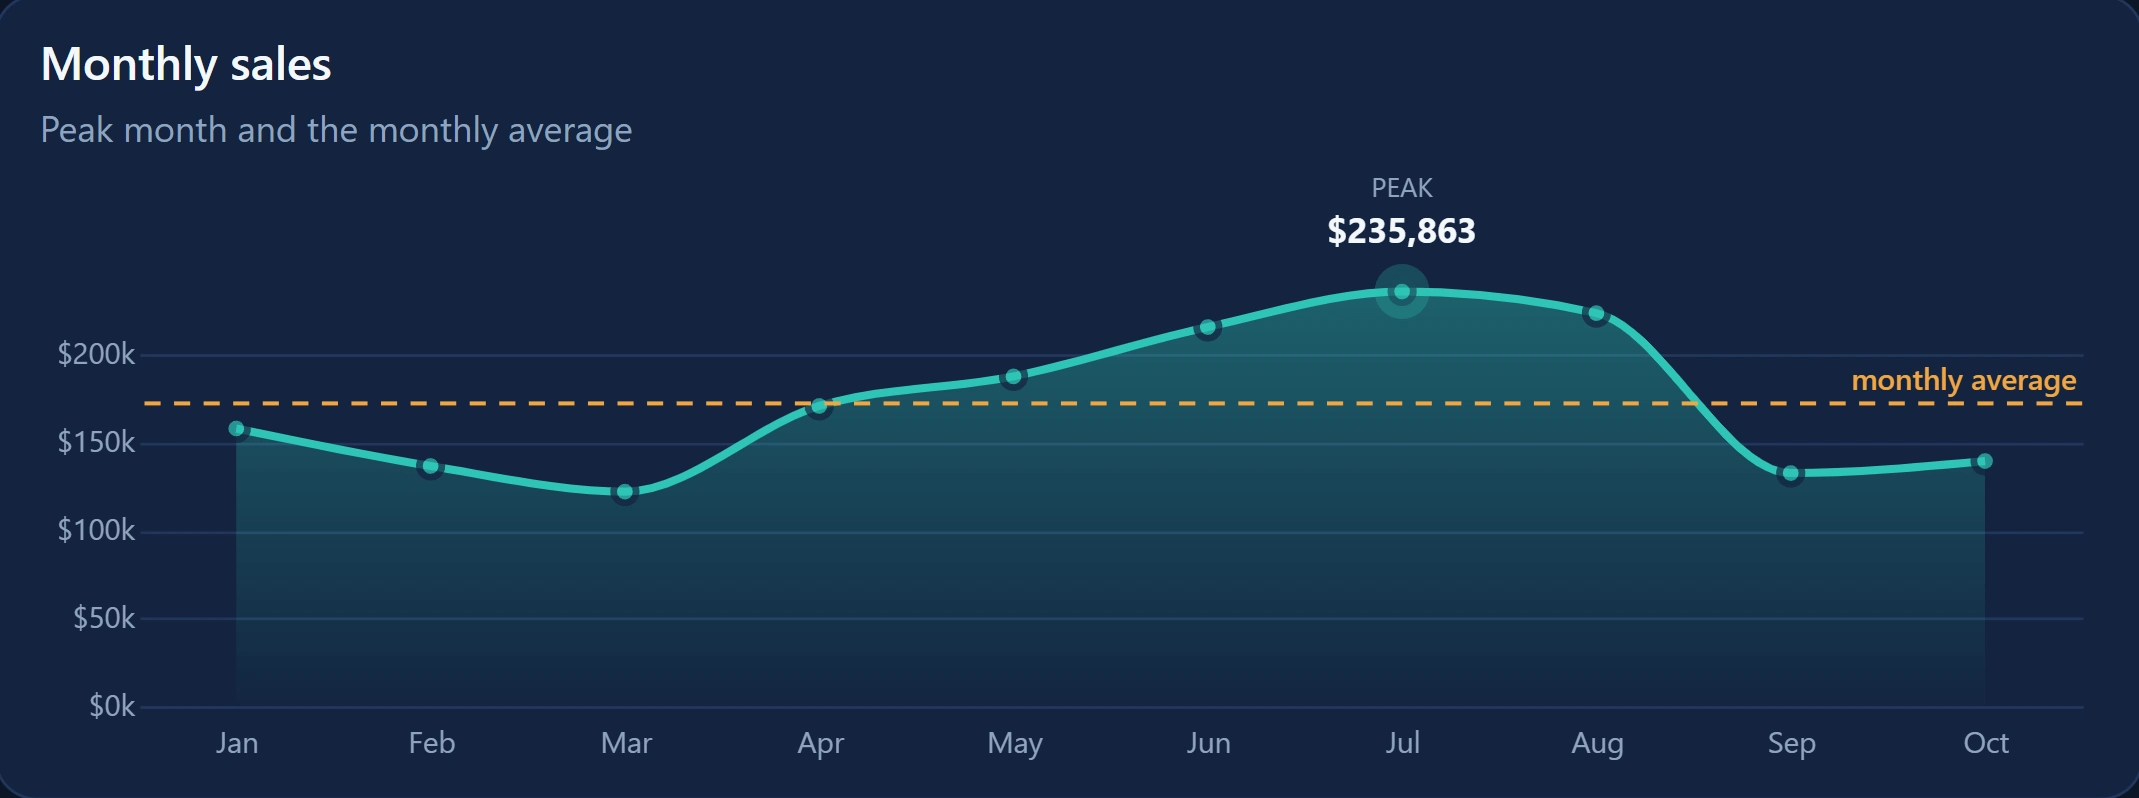
The peak month and the monthly average are drawn on the trend, so "good month or bad month?" needs no mental maths.
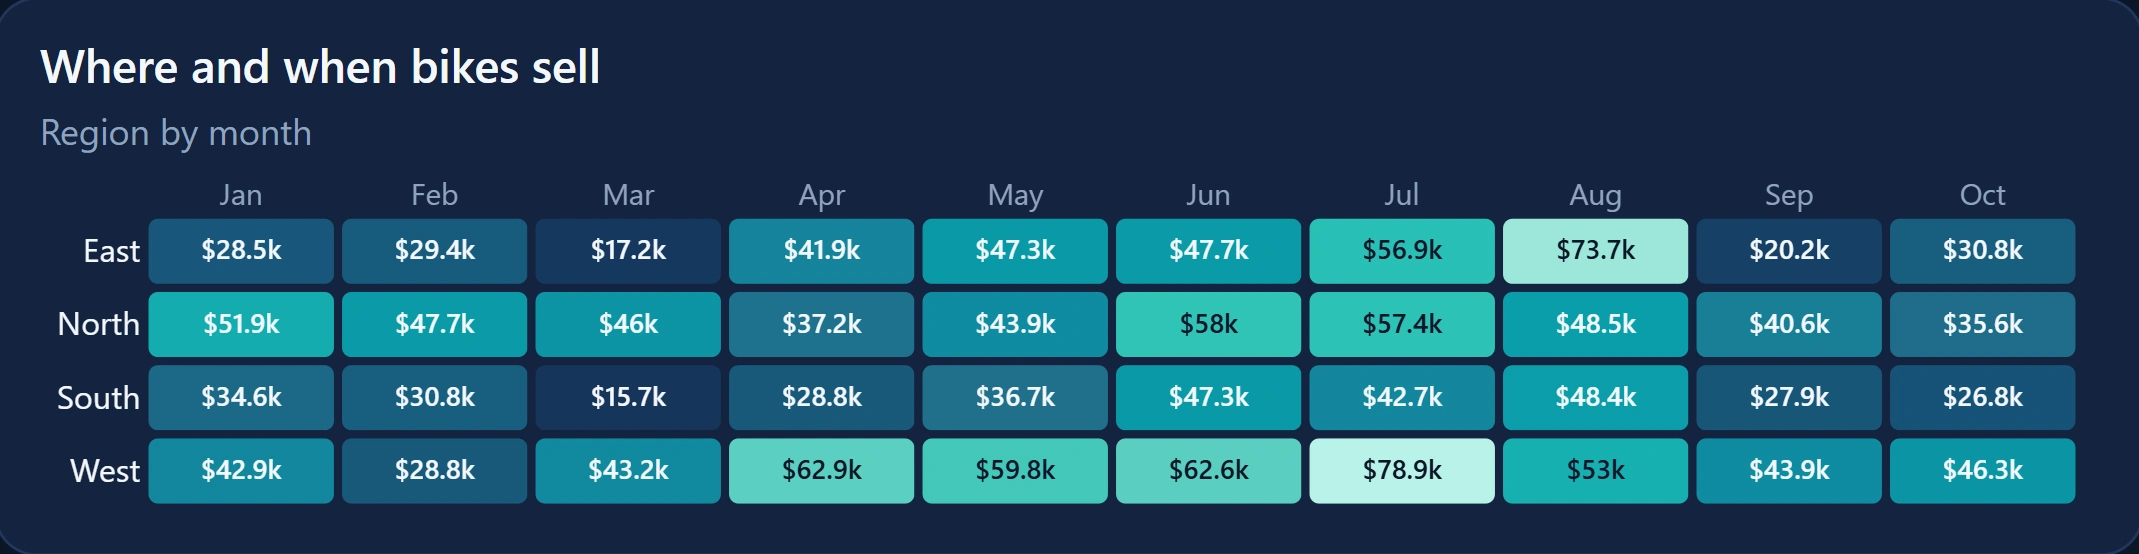
A region by month heatmap replaces four separate line charts: patterns jump out in one look.
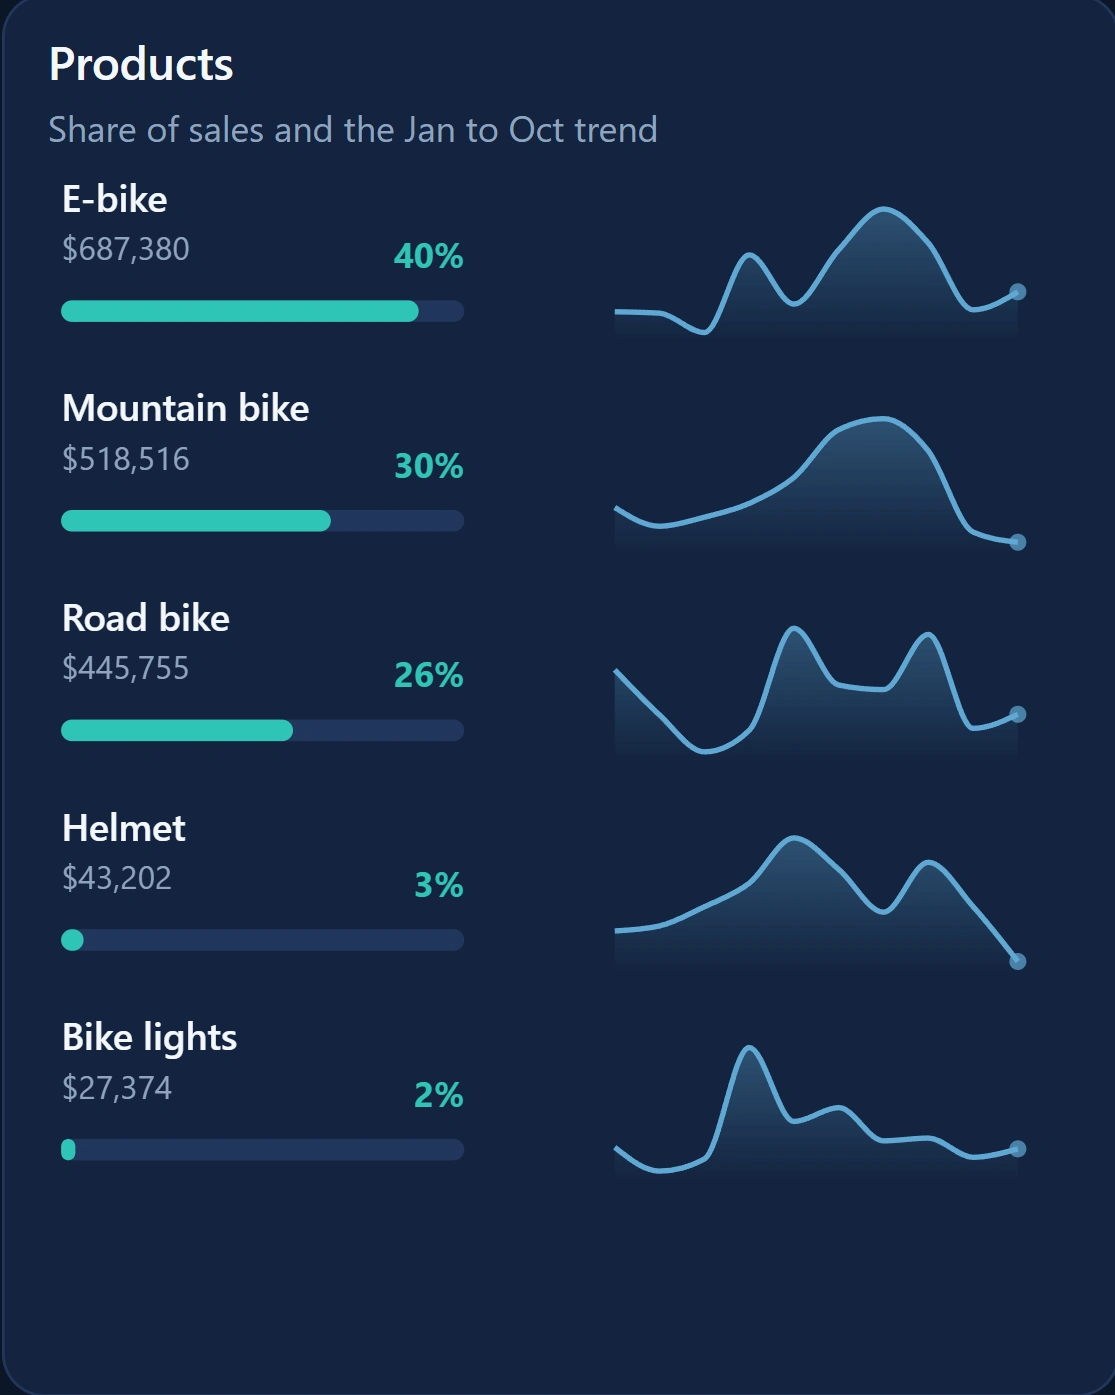
Each product gets its share of sales, a progress bar and a 10-month sparkline in one card, so mix and momentum sit side by side.
A dark theme with one accent colour, built for a wall screen in a bright office. Three charts are custom-built with Deneb where the standard visuals could not show peak, average and trend this cleanly.
Trust signals in the KPI row: the data folder in use and the last refresh time, so the team knows the numbers are current.
What I built
Power BI report and semantic model, custom theme, three Deneb charts, and a single-parameter data source so the same report runs on any folder. Sample data, fictional company. Used as the demo report in my Tiny Fixes episode 9.
0 likes · 0 views · Nov 11, 2026
A demo sales dashboard for a bike retailer: monthly trend with peak and average, a region by month heatmap, and product share with sparklines.
