
The brief
A B2B SaaS founder needs one page for the board and for investors: how big is recurring revenue, is it growing, where does growth come from, and do customers stay and spend more over time?
Design decisions
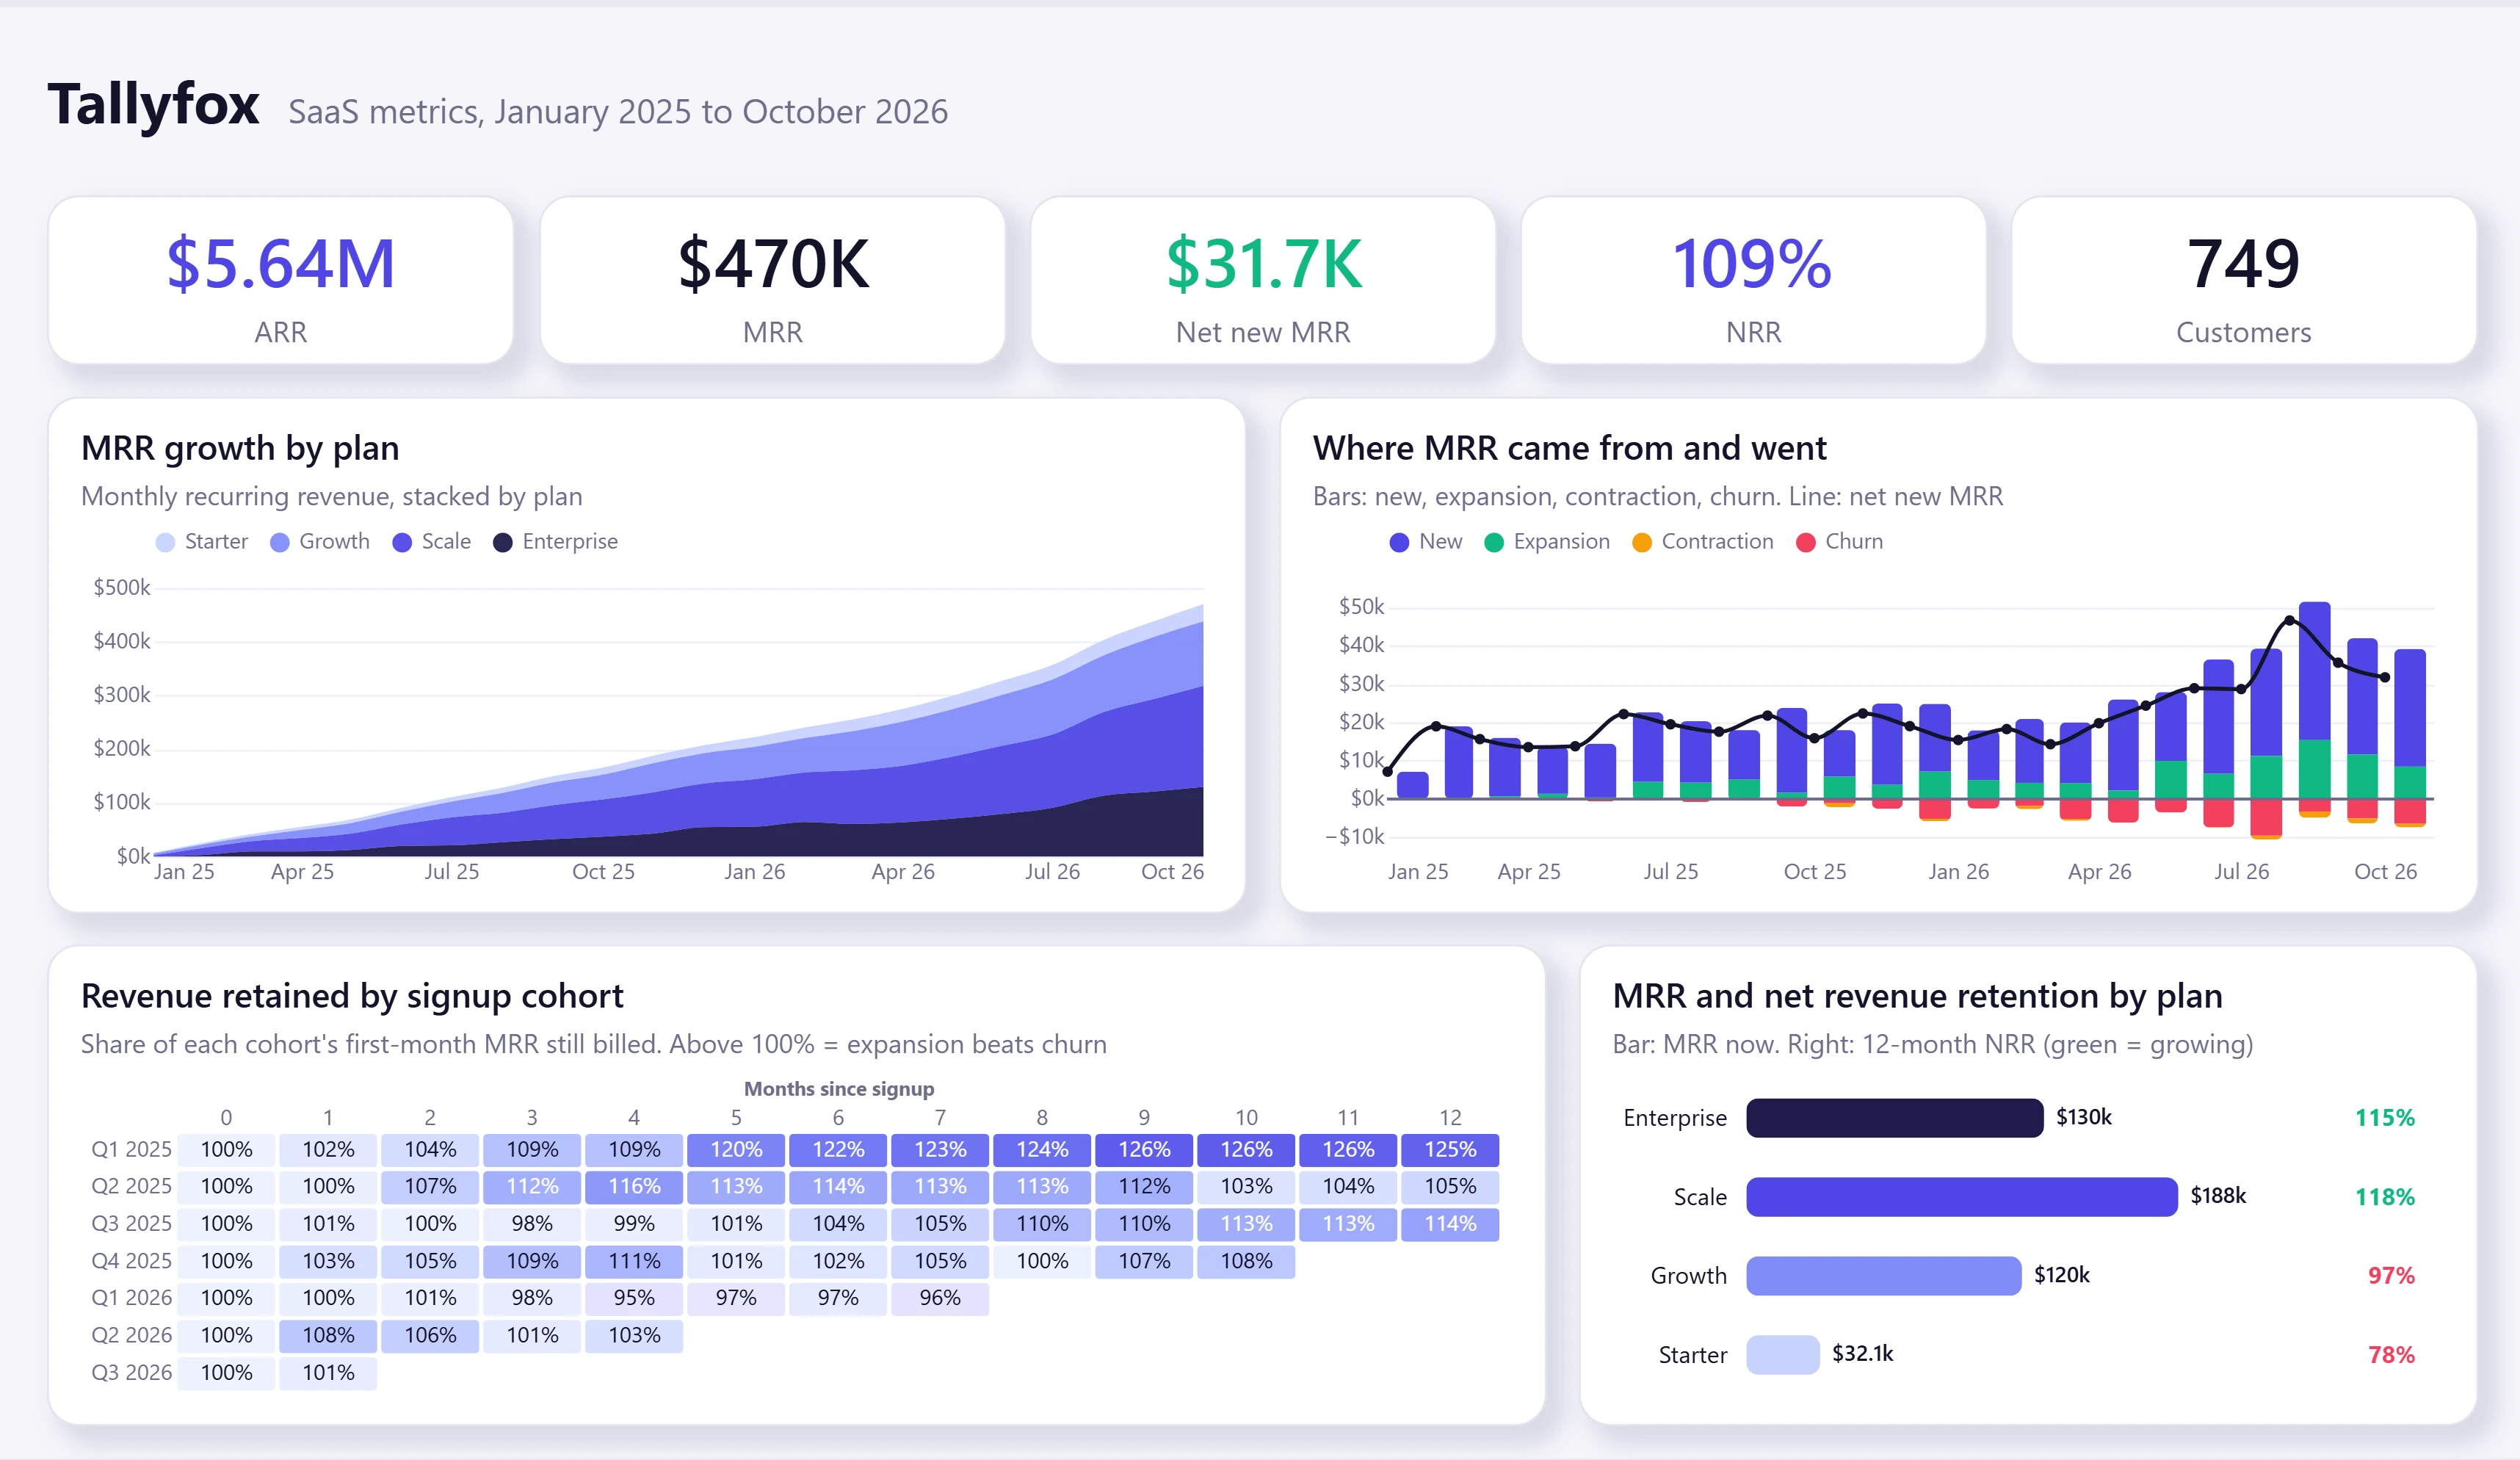
Five numbers first, the ones investors ask for: ARR, MRR, net new MRR this month, net revenue retention (NRR) and customers.
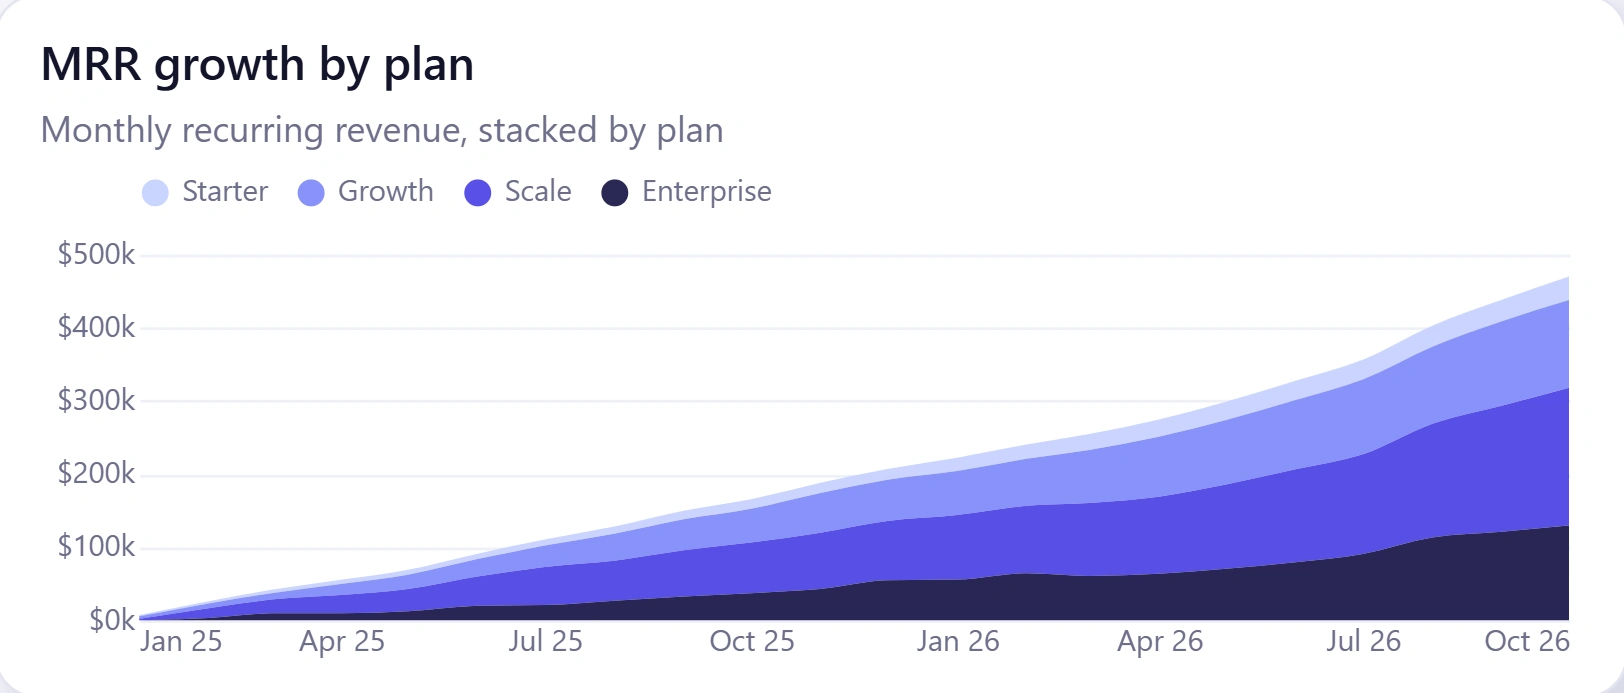
MRR growth is stacked by plan, so you see both the total and which plans drive it.
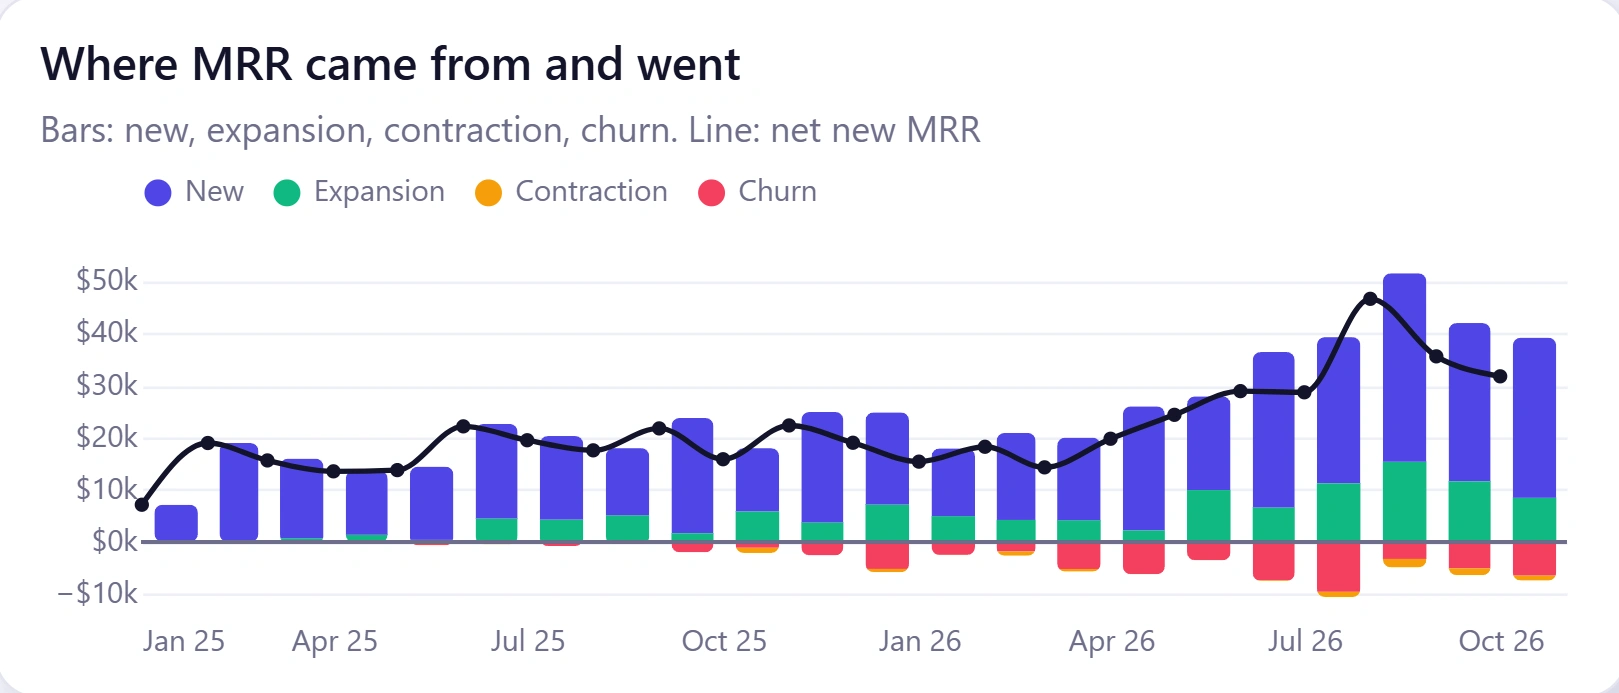
"Where MRR came from and went": new and expansion above the line, contraction and churn below it, with net new MRR as a line. Growth quality in one chart.
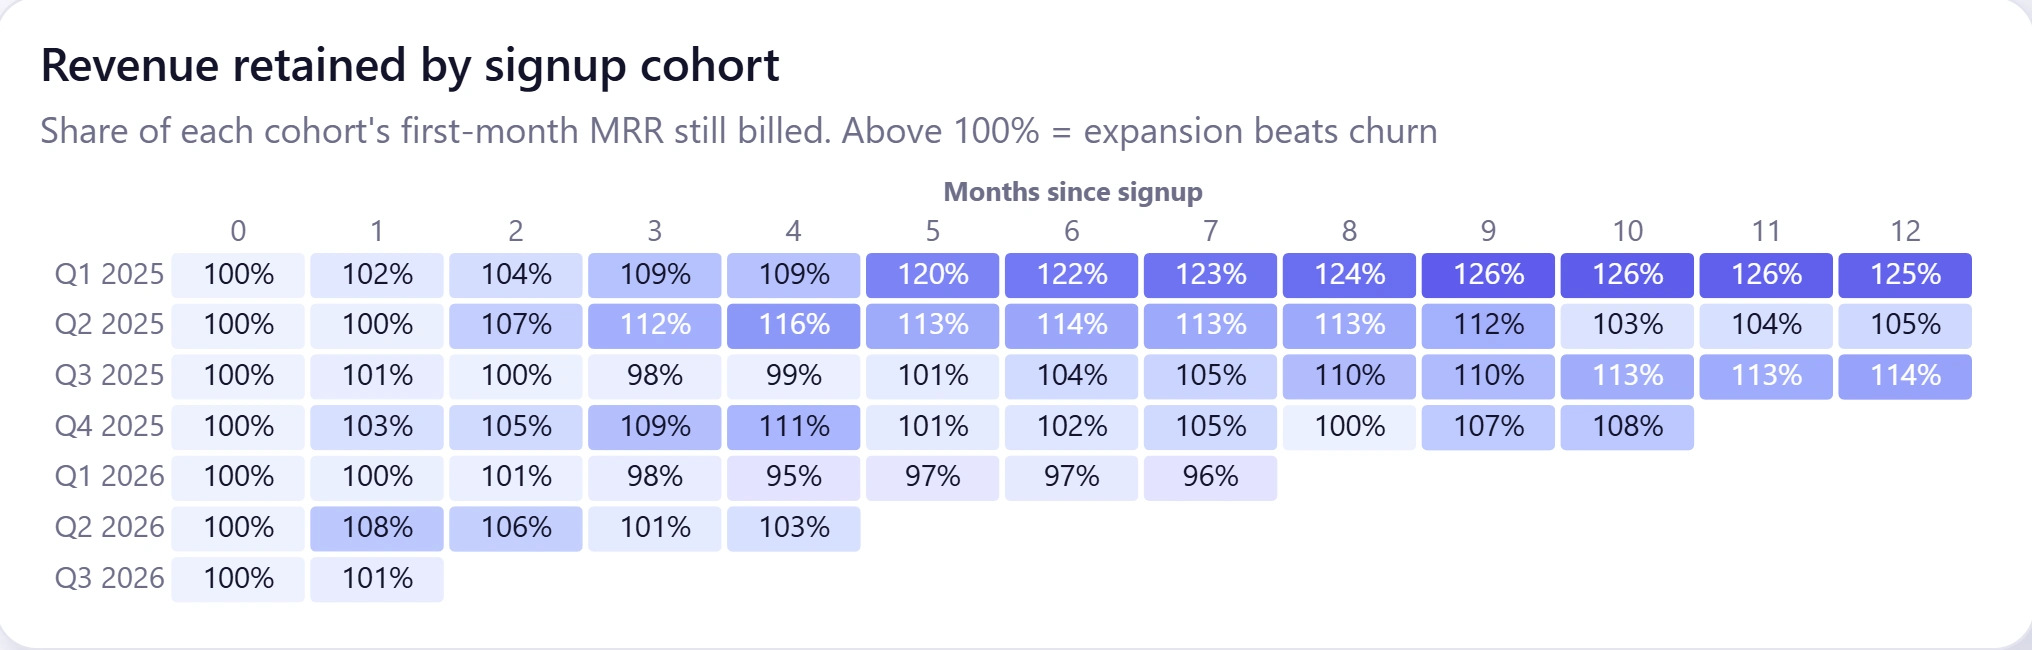
A cohort grid groups customers by signup quarter and shows how much of their first-month revenue is still billed each month after. Above 100% means expansion beats churn.
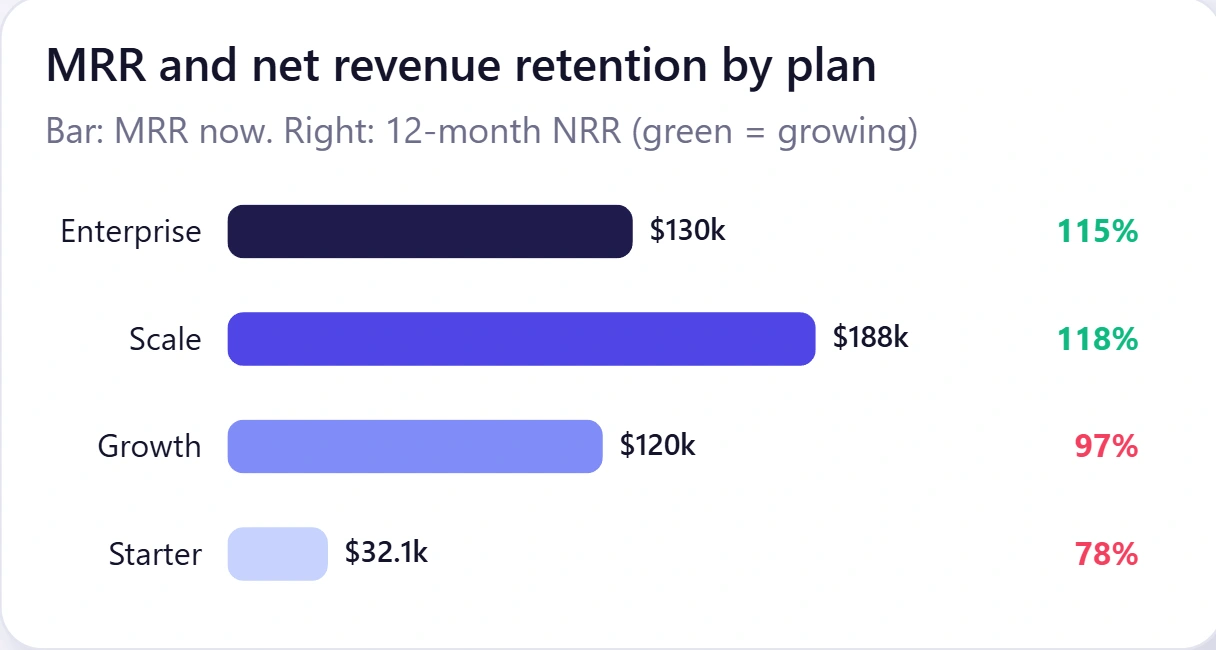
Retention by plan is measured against the plan each customer started on, so upgrades count as growth, not as churn.
A light, modern look with one meaning per colour: indigo for revenue, green for gains, rose for losses.
What I built
Power BI report and semantic model: MRR, ARR, NRR and cohort measures in DAX, four custom charts built with Deneb, a custom theme, and 22 months of simulated subscription data (965 customers, fictional company), embedded so it refreshes in the Power BI service with no gateway.
1 like · 0 views · Nov 12, 2026
An investor-ready SaaS dashboard: ARR, MRR, net revenue retention, MRR movements and cohort retention on one page.
