
Muhammad Mammadzada
PO & APM optimizing product performance and system reliable.


Many teams track CPU, memory and uptime, but nobody knows what “good” means. There are no targets, no error budget, and alerts fire without an owner. Customers feel the pain before the dashboard does.
What I do
In one week I define how reliable your service should be, and set up the targets and alerts to prove it.
What you get
3–5 SLIs and SLOs based on your real user journeys (availability, latency, error-free requests)
An error-budget policy: what happens when the budget runs low
Burn-rate alert rules, with clear “page” vs “ticket” thresholds
A dashboard design with SLO status, budget burn-down and a summary table
A short handover document and a 30-minute walkthrough call
How it works
Day 1: a short call about your service and users
Days 2–3: I draft the SLIs and SLOs
Days 4–5: alert rules, dashboard design and handover
Good fit if you
Run a production web or API service
Get alerts but still feel blind
Want SRE practices without hiring a full-time SRE
0
17
The problem
Teams often get over a thousand alerts a day. Real incidents get buried, on-call engineers burn out, and nobody trusts the dashboards.
What I do
Audit existing alerts and find the noisy, duplicate and non-actionable ones
Rebuild alerting around SLOs (availability, latency, error rate)
Design one clear dashboard: key metrics, latency percentiles, error budget, and active problems with root cause
Sample result shown in the video (demo data)
Alerts per day: 1,284 → 12 actionable
Availability: 97.8% → 99.95%
p95 latency: 842 ms → 187 ms
Error rate: 4.8% → 0.21%
Good fit if you
Run a production service and feel alert fatigue
Use Dynatrace or a similar APM tool and want better dashboards
Need a clear fix plan, not just a report
Message me with your stack and your biggest alerting pain, and I’ll reply with a quick plan.
0
27
Description
0
29
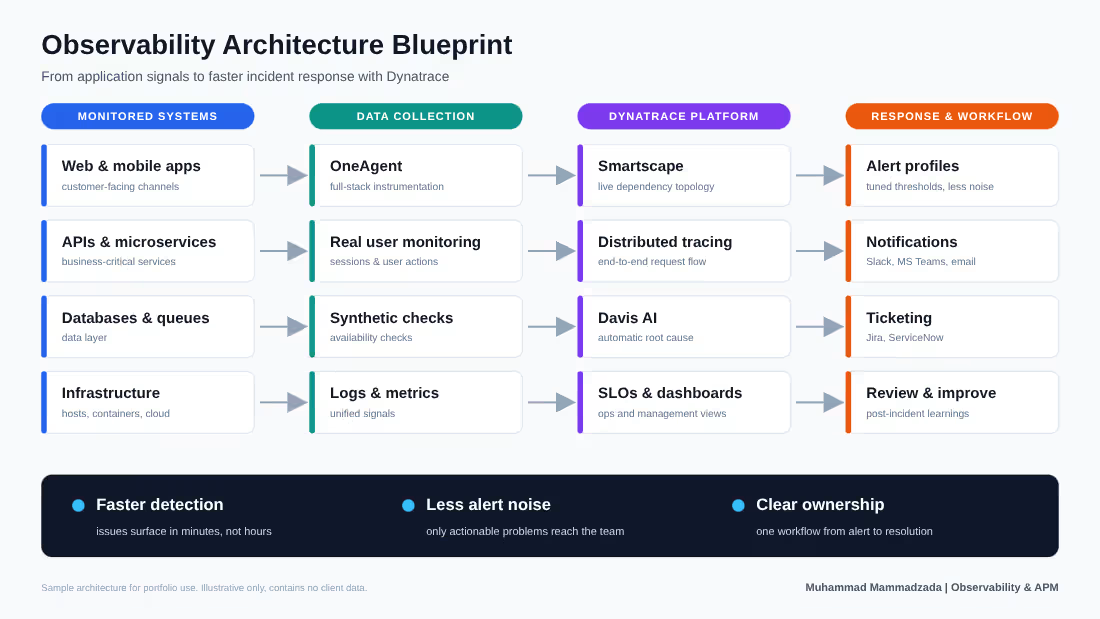
A sample observability architecture I designed to show how a team can go from raw application signals to faster incident response using Dynatrace.
The challenge: Growing teams often have logs, metrics and traces scattered across tools, so finding the root cause of a production issue takes too long and alerts become noise.
What I did:
Mapped the full flow: monitored systems → data collection → Dynatrace platform → alerting and workflow
Covered APM, real user monitoring, synthetic checks, distributed tracing and logs in one view
Defined how alerts reach the right people through Slack/Teams and Jira/ServiceNow
Planned SLO dashboards for both operations and management
Tools: Dynatrace, Smartscape, Davis AI, Jira, ServiceNow
This is a generic blueprint with no client data. I can adapt it to your stack and run a short audit of your current monitoring setup.
0
78