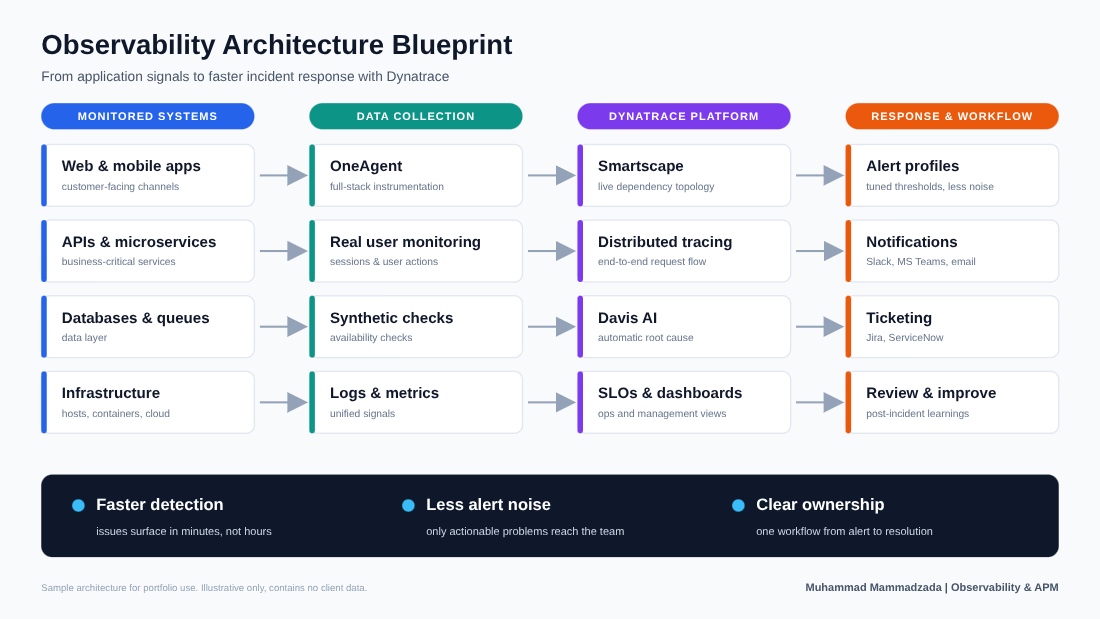
A sample project showing how I bring six dashboards together on one page, so a team can see what is happening in production at a glance.

The six dashboards
• Service health: is anything down right now?
• Traffic & latency: how fast is it for customers?
• Infrastructure: are servers under strain?
• User experience: what do real users feel?
• Alerts: what needs attention, and who owns it?
• SLOs & error budget: are we meeting reliability goals?

What the video shows
At the 15-second mark a problem opens. Response time spikes, database CPU rises, a critical alert fires, and the SLO compliance bar turns orange. The symptom and the likely cause appear on one page.

What I can build for you
• Dashboards for your key services and infrastructure
• Alert rules that are tuned to real impact and routed to the right person
• SLOs and error budget tracking
• A monitoring audit to find gaps and noise in your current setup