
Ihar Yanouski
Data Visualization Expert | Design & Development | D3/Svelte



Meet Ihar
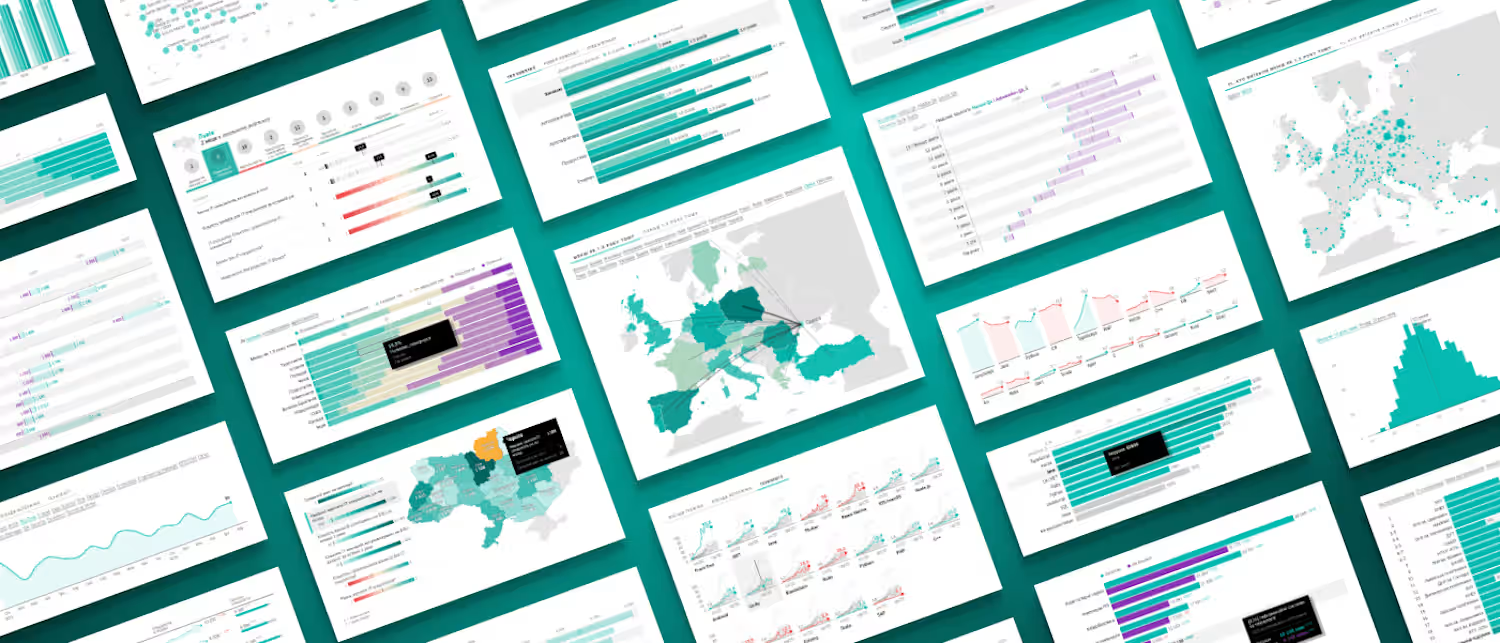
I’m a data visualization designer and developer with 10+ years of experience turning complex data into clear, engaging stories for editorial products.
I work with NGOs, newsrooms, and research organizations, usually alongside editors and researchers. My work spans web and print, from analytical and narrative charts to custom interactive tools that let audiences explore data for themselves.
I can take a project from brief analysis and data preparation through visual concepting, prototyping, and final production. For interactive work, I design in Figma and build bespoke visualizations with D3.js and Svelte. For static and print work, I use Adobe Illustrator. R and tidyverse are part of my research and data-preparation process.
I’m particularly drawn to exploratory visual tools, data-rich editorial features, and projects where the format reveals patterns that a spreadsheet or conventional article can’t. I can join at any stage, or lead the full process through to a working web app, embed-ready widget, or print-ready layout.
Availability and payment structure vary by scope, so get in touch to discuss your project.
Rate
$100 - $150/hr
Skills and tools


Details
Minsk, Belarus
(GMT+2) Eastern European Time (EET), ±2 hours
Fluent in English, Ukrainian, and Russian