


What is your project's main goal when hiring a data visualizer on Contra?
Knowing your project's main goal helps you choose the right data visualizer. Are you looking to make complex data easy to understand? Or maybe you need to tell a powerful story through visuals? Defining your goal guides the visualizer in creating meaningful graphics that meet your needs.
How can you ensure that the data visualizer understands your project's requirements?
Clear communication is the key. Start by providing a detailed brief that outlines your expectations and deliverables. Use examples or references to help the visualizer see your vision. A shared understanding ensures a smooth project and quality results.
What timeline do you need to establish to hire a data visualizer successfully?
A realistic timeline keeps everyone on track. Consider how long you need for onboarding, work sessions, and receiving drafts. Discuss the timeline with the visualizer to agree on deadlines that suit both parties. Proper planning avoids delays and ensures timely project completion.
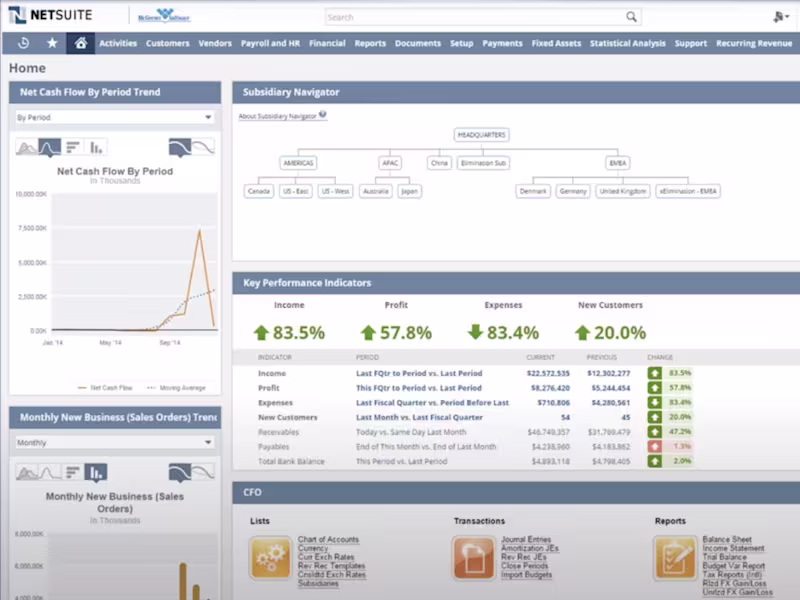
Which tools and technologies should be agreed upon for your data visualization project?
Choosing the right tools can enhance the project's outcome. Decide whether you need specific software like Tableau, D3.js, or Microsoft Power BI. Align on tools and technologies in advance to ensure compatibility and efficiency throughout the project.
How can you ensure quality control in your data visualization project?
Setting up checkpoints is a great way to maintain quality. Decide on regular review stages during the project. These checkpoints allow for feedback and adjustments, ensuring the visualizations meet your standards. Collaboration at each step leads to a successful final product.
What style or brand guidelines should be followed for your data visualizations?
Consistency in visuals strengthens your brand. If you have existing style guides or brand elements, share them with the visualizer. They can use these to create visuals that align with your brand's message and look. This consistency enhances recognition and trust with your audience.
How do you determine the success of the data visualization project?
Start by defining what success looks like for your project. Is it increased engagement, better understanding, or another metric? Decide how you will measure these outcomes and share this with the visualizer. Clear success criteria help keep the project focused and results measurable.
What process should be used to gather feedback and implement changes in your project?
Establish a straightforward process for feedback. Decide how you will collect and communicate your thoughts on drafts. Ensure there’s a system in place for implementing changes promptly. A structured feedback loop leads to efficient iterations and successful outcomes.
How should you prepare for the first meeting with the data visualizer on Contra?
Preparation is key to a productive first meeting. Bring all necessary information about your project and goals. Prepare questions to fully understand how the visualizer works. A well-prepared meeting sets a positive tone and lays the groundwork for successful collaboration.
What documentation should you provide to the data visualizer to start the project?
Providing comprehensive documentation ensures clarity. Include project briefs, data sets, style guides, and any relevant background information. Clear documents help the visualizer start on the right foot, ensuring an efficient and effective workflow from the outset.
Who is Contra for?
Contra is designed for both freelancers (referred to as "independents") and clients. Freelancers can showcase their work, connect with clients, and manage projects commission-free. Clients can discover and hire top freelance talent for their projects.
What is the vision of Contra?
Contra aims to revolutionize the world of work by providing an all-in-one platform that empowers freelancers and clients to connect and collaborate seamlessly, eliminating traditional barriers and commission fees.