Freelancers using Grafana
Sign Up
Post a job
Sign Up
Log In
Filters
1
Projects
People
Tayyab Ali
Pakistan
AI System Architect | Database Expert | Data Analyst
$25k+
Earned
1x
Hired
5.0
Rating
72
Followers
Follow
Message
AI System Architect | Database Expert | Data Analyst
1
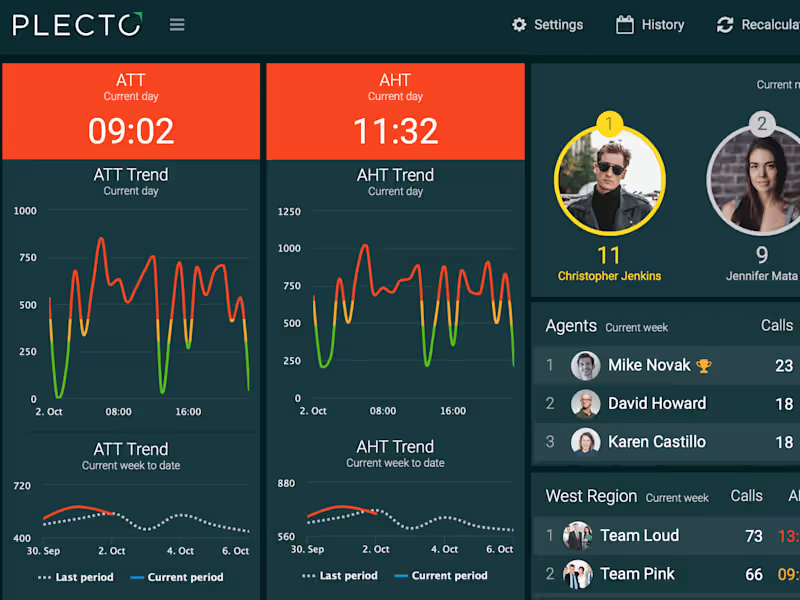
KPI Tracking in Plecto | Live TV Dashboards
1
151
2
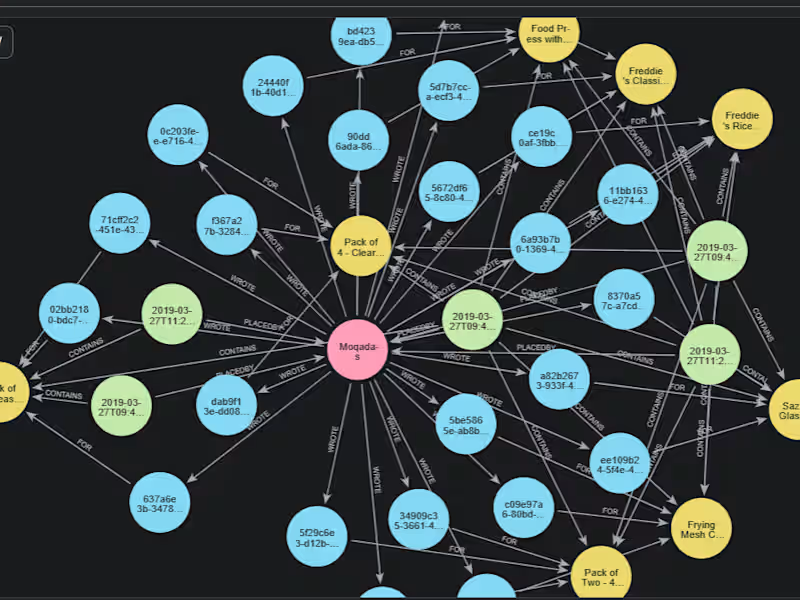
To get the real benefit of RAG/CAG systems for any business is only possible by the interconnectivity of data that can be developed in Graph Databases
2
537
1
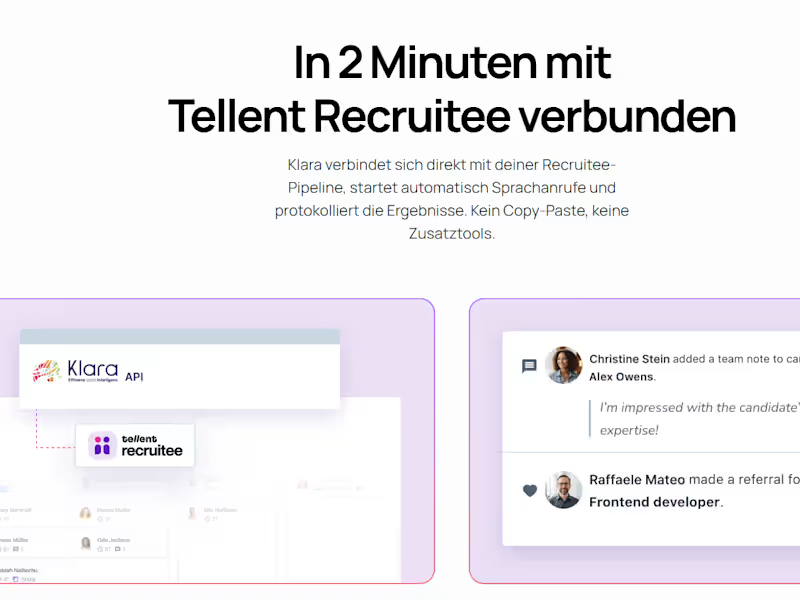
Klara AI - HR AI Voice calling agents in Germany
1
14
3
Graph & Vector Database Architectire Development
3
99
Grafana
(1)
Follow
Message
Kittipong Sorasuchart ✧
pro
Bangkok, Thailand
Senior Full Stack Developer. Founder/CEO of Mirimera.
$1k+
Earned
2x
Hired
5.0
Rating
32
Followers
Follow
Message
Senior Full Stack Developer. Founder/CEO of Mirimera.
6
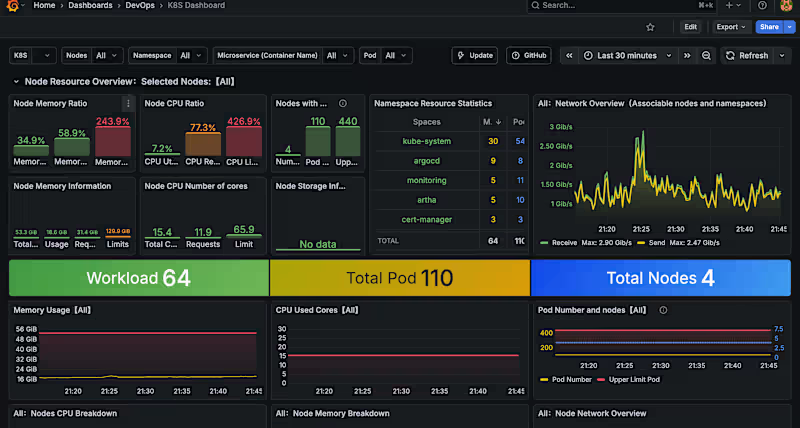
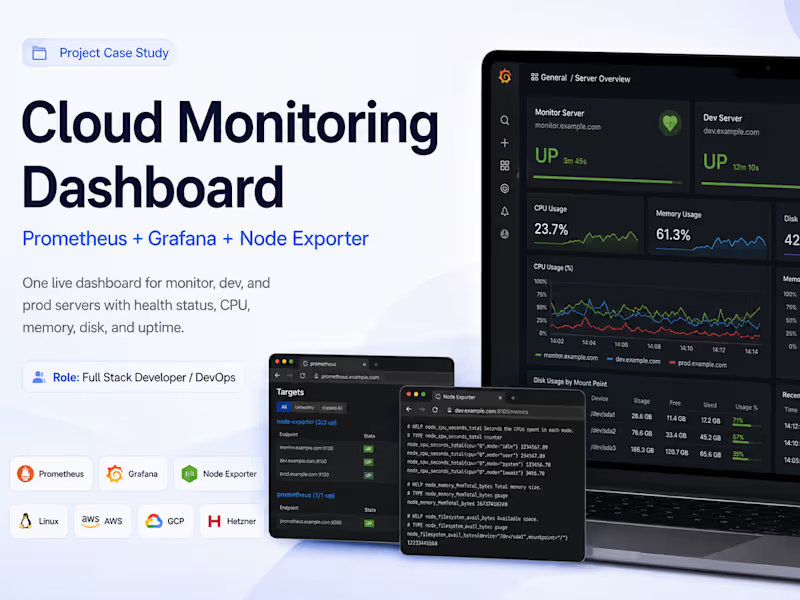
Centralized Server Monitoring System Implementation
6
24
2
Professional portfolio website
2
6
2
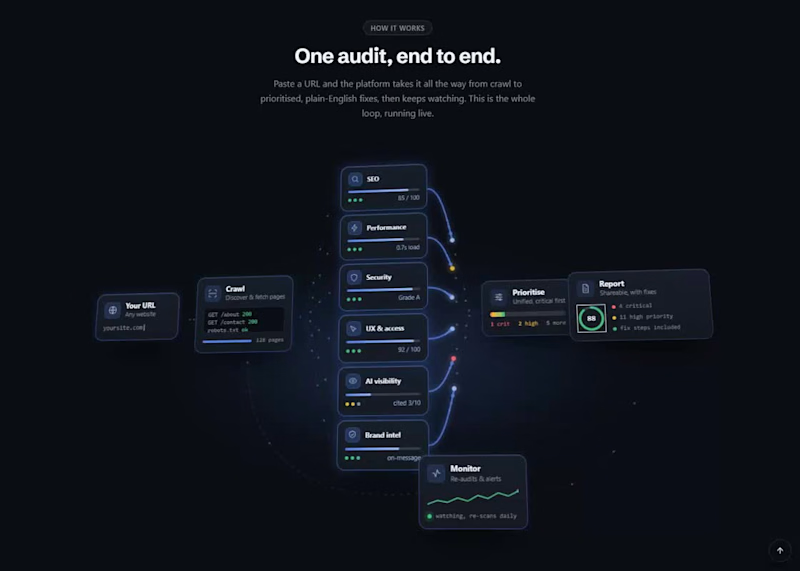
Website Performance and Visibility Auditing Platform
2
4
6
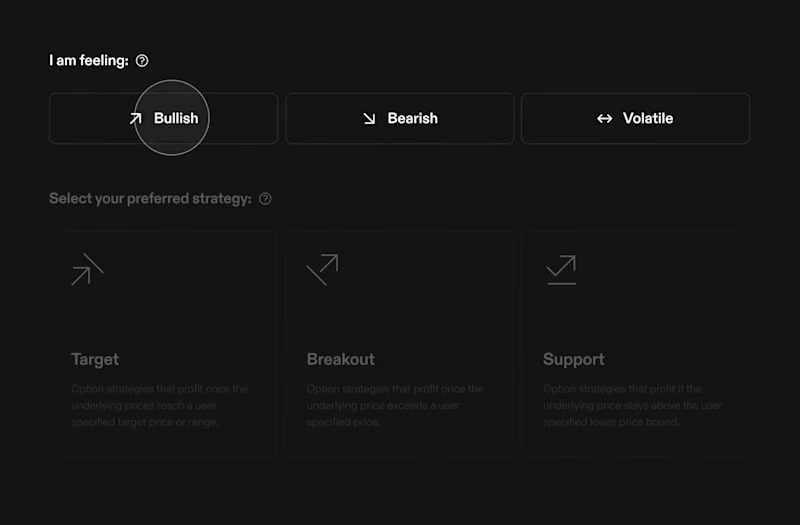
Options Trading Platform
2
6
328
Grafana
(1)
Follow
Message
Aduraleke faith Akintade
pro
Kigali, Rwanda
Devops Engineer delivering efficient software application.
$1k+
Earned
1x
Hired
5.0
Rating
10
Followers
Follow
Message
Devops Engineer delivering efficient software application.
0
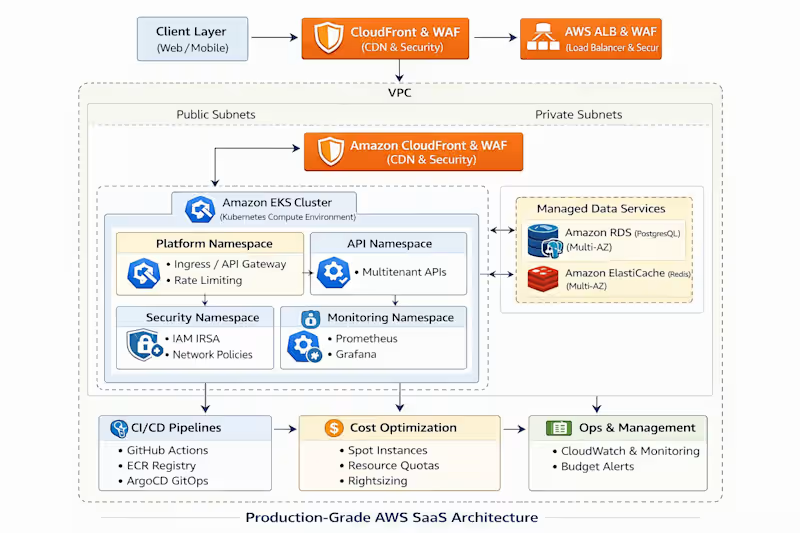
Multi-Tenant SaaS Platform on AWS EKS
0
12
0
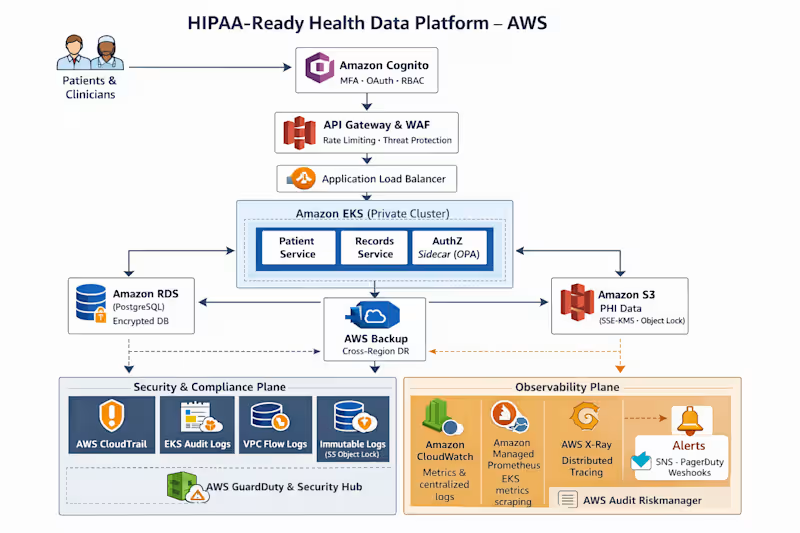
HIPAA-Ready Health Data Platform on AWS
0
1
0
which of these A or B would you pick.
2
0
99
0
sip, savor and enjoy your coffee.
0
88
Grafana
(2)
Follow
Message
Dhruv Mavani
Ahmedabad, India
DevOps
Follow
Message
DevOps
1
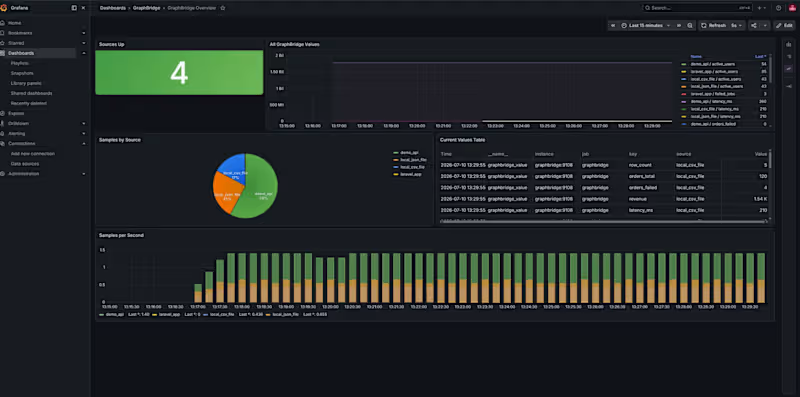
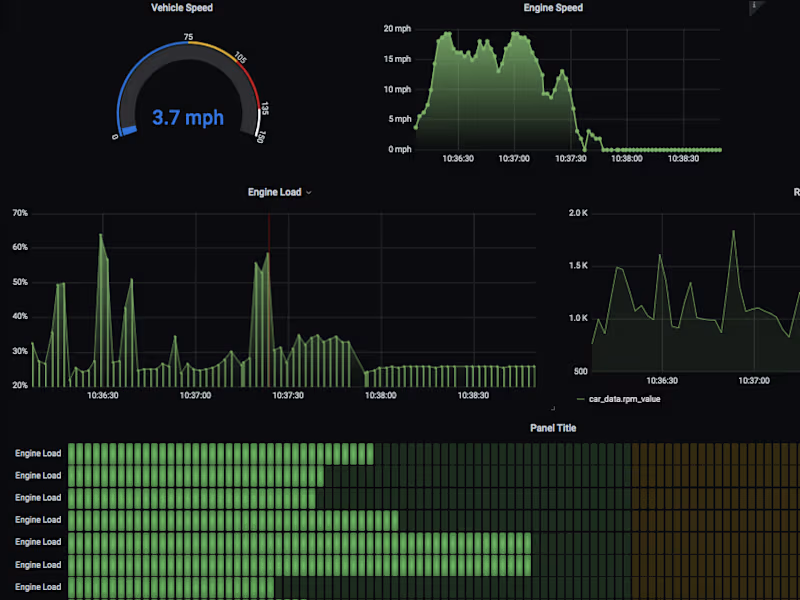
Grafana Monitoring for YOUR Production Server's
1
184
1
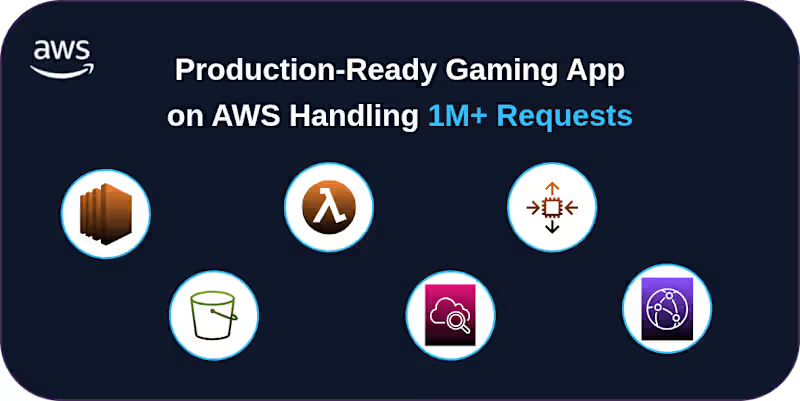
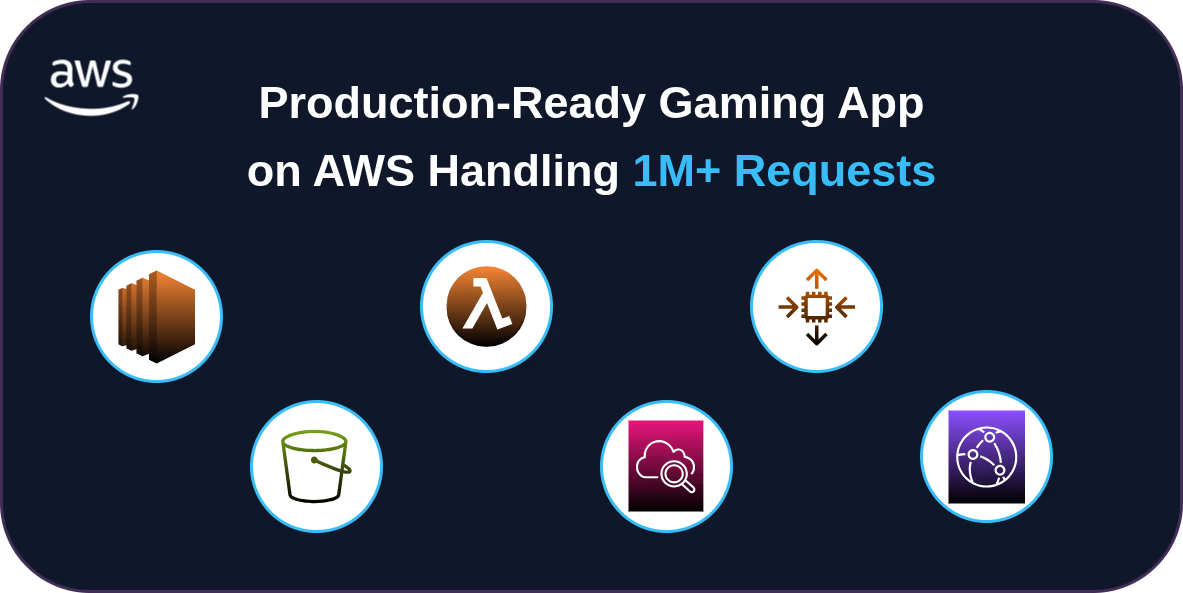
Production-Ready Ludo Gaming App on AWS
1
6
1
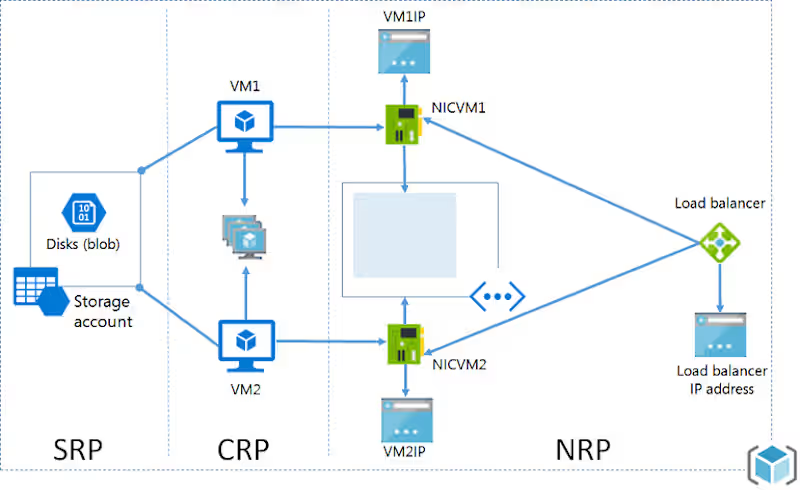
Azure Cloud Application Deployment
1
155
View more →
Grafana
(2)
Follow
Message
Serhii Lukash
Vinnytsia, 21000
AI Automation Engineer | Python Pipelines That Save 40+ Hour
New to Contra
Follow
Message
AI Automation Engineer | Python Pipelines That Save 40+ Hour
0
G-Mind: AI Email Automation Engine & Gmail Pipeline
0
0
0
BubbleBrain — AI Chatbot Backend for E-commerce
0
2
1
Serotonin Script: AI Medical Content Engine & RAG Pipeline
1
3
0
Async Domain Analyzer: Domain Intelligence Pipeline
0
2
Grafana
(1)
Follow
Message
HAMZA EL QADIRI
Madrid, Spain
Data Engineering & AI,
New to Contra
Follow
Message
Data Engineering & AI,
0
Spotify Loader Benchmark The Spotify Loader Benchmark is a comprehensive framework for evaluating different data loading strategies on the Spotify dataset, providing insights into the performance of various loading mechanisms. By comparing sequential, vectorized, multithreaded, raw SQL, Celery-based, and Flink-based loaders, this project helps developers optimize their data loading processes. With its robust architecture and flexible design, the Spotify Loader Benchmark is an essential tool for anyone working with large datasets.
0
51
0
The AI-Powered Modern Data Platform for E-Commerce is a cutting-edge solution that bridges the gap between complex data infrastructure and business users. This project combines a robust modern data stack with advanced AI capabilities, enabling natural language analytics over an enterprise-grade E-Commerce Data Warehouse. By leveraging Artificial Intelligence, Large Language Models, and Retrieval-Augmented Generation (RAG), this platform empowers business users to ask questions in natural language and receive actionable insights.
0
14
0
Sales & Customer Dashboard: Unlocking Insights with Tableau Analyzing sales performance and customer behavior is crucial for businesses to make informed decisions. The Sales & Customer Dashboard is designed to provide stakeholders with a comprehensive overview of sales metrics, trends, and customer insights. By leveraging Tableau's data visualization capabilities, this dashboard empowers sales managers, executives, and marketing teams to identify areas of improvement, optimize strategies, and drive growth.
0
43
0
Azure Data Pipeline for E-commerce Analytics : E-commerce teams drown in raw sales CSVs and scattered APIs—while revenue leaks hide in untracked product returns and regional stock-outs. I built a cloud-native, end-to-end analytics pipeline that turns chaotic transactional data into sub-minute Power BI insights, letting merchandisers act on trends before they become costly mistakes.
0
48
Grafana
(1)
Follow
Message
Joshua Valle
Palisades Park, USA
Building Intelligent Systems and Data-Driven Solutions
Follow
Message
Building Intelligent Systems and Data-Driven Solutions
1
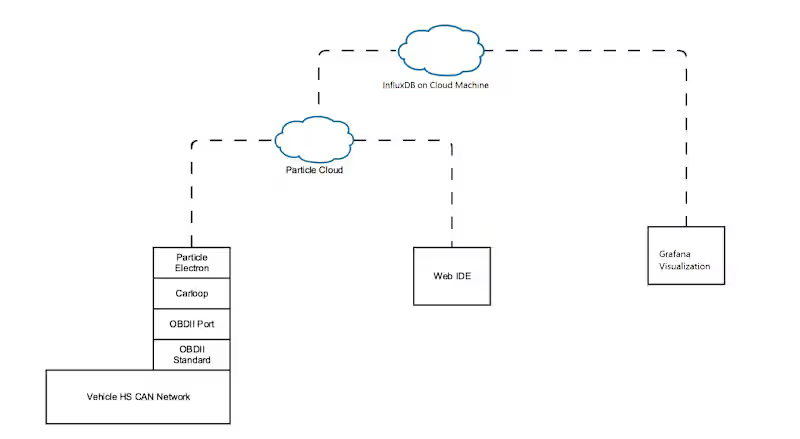
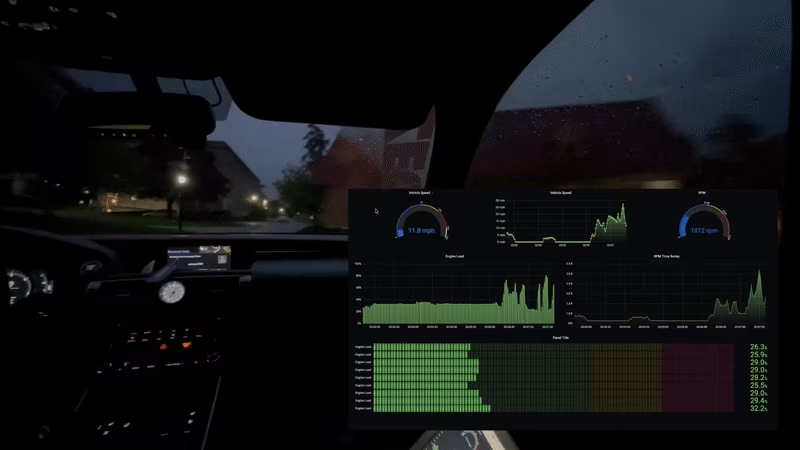
Low-Level Schematic of Developing a Web-Based System for Remote Collection and Analysis of Vehicle Electrical Systems Over CANBus Using Carloop (https://scholarworks.arcadia.edu/showcase/2023/comp_sci_math/5/)
1
64
0
Web-Based System for Remote Vehicle Data Collection
0
6
0
I'm offering 3 FREE automation audits to e-commerce businesses, individuals, and more this week (first-come, first-served). I'll review your current processes and show you exactly where you're losing time/money, and how to automate it. No obligation, just want to build my portfolio. Comment or DM if interested. You can also view my work online here: https://automated-business-solutions.netlify.app/
0
47
1
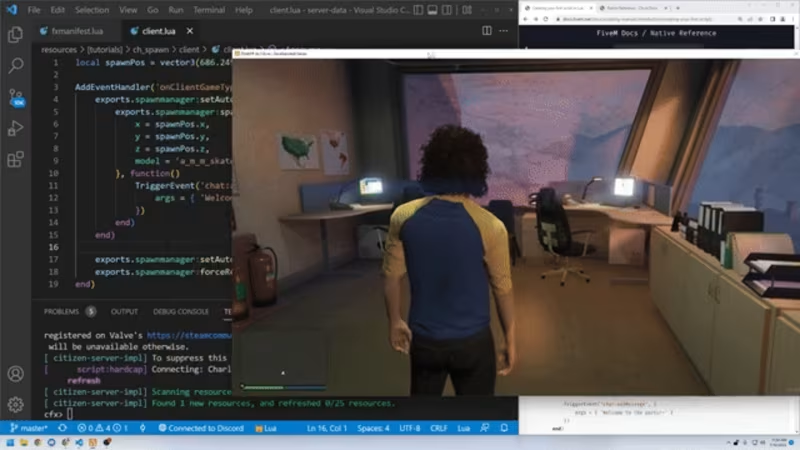
FiveM (GTA) Customer Server Development & Scripting Developed and maintained custom FiveM (GTA V) servers, specializing in advanced LUA scripting and automation. Built immersive gameplay systems, custom jobs, and server-side logic using QBCORE and ESX frameworks. Integrated third-party APIs, optimized server performance, and delivered engaging multiplayer experiences. Demonstrated expertise in resource management, anti-cheat scripting, and seamless deployment of new features for a vibrant player community.
1
74
Grafana
(2)
Follow
Message
Mohammed Abul Azad Faisal
pro
Dhaka, Bangladesh
DevOps & Cloud Infrastructure Engineer | Proxmox Expert
Follow
Message
DevOps & Cloud Infrastructure Engineer | Proxmox Expert
0
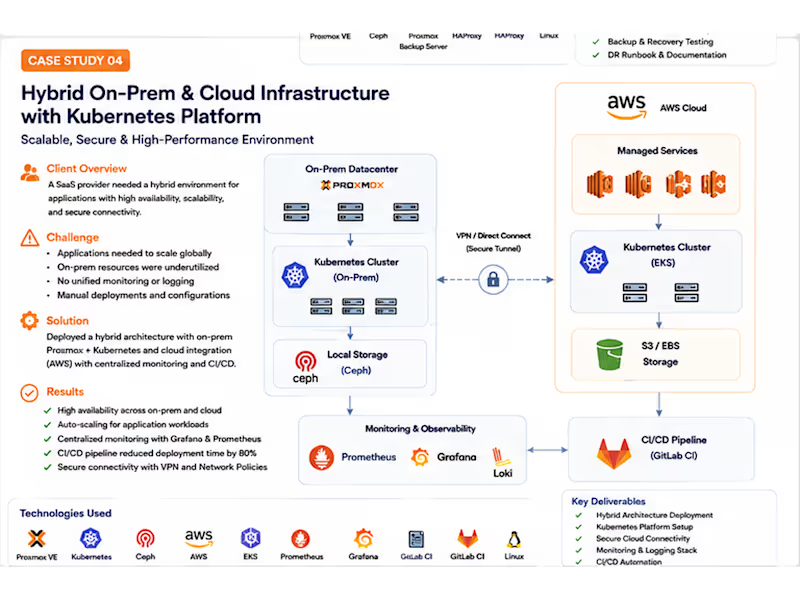
Hybrid On-Premises and Cloud Kubernetes Platform
0
0
0
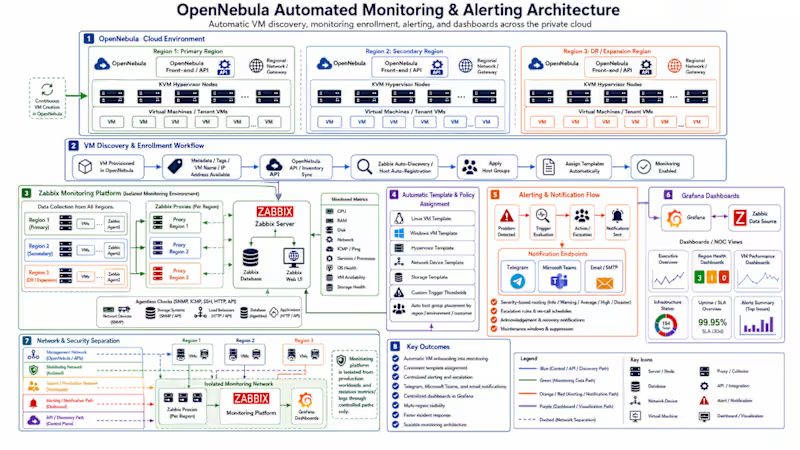
Automated OpenNebula Monitoring and Alerting Architecture Designed an automated monitoring and observability architecture for a multi-region OpenNebula private cloud environment. The solution automatically discovers newly created virtual machines through the OpenNebula API and registers them in Zabbix without requiring manual monitoring configuration. Once a VM is detected, it is assigned to the appropriate host group based on its region, environment, operating system, or customer. Monitoring templates are then applied automatically for Linux, Windows, hypervisor, network, and storage systems. This ensures that every newly provisioned VM receives consistent monitoring, trigger thresholds, availability checks, and alerting policies from the moment it becomes active. The architecture includes regional Zabbix proxies that collect monitoring data from each OpenNebula region and securely forward it to a centralized Zabbix Server. This reduces cross-region monitoring traffic and allows monitoring to continue locally during temporary network interruptions. The platform monitors: CPU and memory utilization Disk capacity and performance Network traffic and packet loss Operating system availability Services and running processes VM uptime and availability Hypervisor health Storage availability and performance Network devices using SNMP Web services and APIs using HTTP checks When a problem is detected, Zabbix evaluates the configured trigger and escalation policy. Notifications are then automatically routed to Telegram, Microsoft Teams, and email based on severity, environment, and operational responsibility. Grafana is integrated with Zabbix as a centralized visualization platform. It provides real-time dashboards for infrastructure health, regional availability, VM performance, uptime, service-level objectives, resource capacity, and active alerts. The monitoring environment is isolated from tenant and production networks using a dedicated monitoring network. Only controlled monitoring, API, and notification traffic is permitted between the cloud regions and the monitoring platform. Key outcomes of the solution include: Automatic VM discovery and monitoring enrollment Consistent monitoring across all OpenNebula regions Automated template and policy assignment Centralized alerting and escalation Telegram, Microsoft Teams, and email notifications Real-time Grafana dashboards Reduced manual administration Faster incident detection and response Scalable monitoring for future cloud expansion This project demonstrates my ability to integrate OpenNebula, Zabbix, Grafana, API-driven automation, multi-region monitoring, centralized alerting, and secure network segmentation into a complete private cloud observability platform.
0
15
0
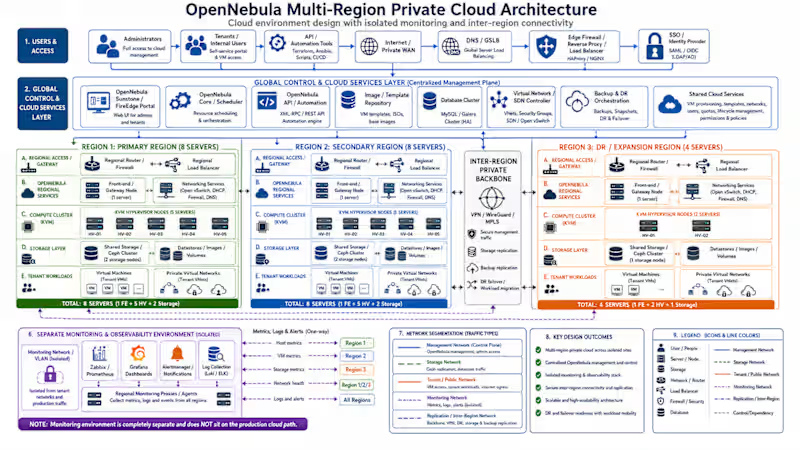
Designed a complete multi-region private cloud architecture using OpenNebula across three geographically separated regions with a total of 20 physical servers. The solution provides centralized cloud management, regional workload isolation, secure inter-region connectivity, shared cloud services, disaster recovery, backup replication, and dedicated monitoring for the complete infrastructure. The environment was structured as follows: Primary Region: 8 servers Secondary Region: 8 servers Disaster Recovery and Expansion Region: 4 servers Centralized OpenNebula management and scheduling KVM-based virtualization across all compute nodes Regional firewalls, routers, load balancers, and gateway services Separate compute, storage, management, tenant, replication, and monitoring networks Shared storage and Ceph-based storage architecture Cross-region backup replication and workload failover Centralized image, template, user, network, and lifecycle management Secure administrator and tenant access through SSO and role-based access control A dedicated monitoring and observability environment was also designed separately from the production cloud network. The monitoring stack included Prometheus or Zabbix for metrics collection, Grafana for dashboards, Alertmanager for notifications, and Loki or the ELK Stack for centralized log management. Regional monitoring proxies and agents collect host, VM, storage, application, and network metrics from each region while keeping the monitoring infrastructure isolated from tenant and production traffic. The architecture was designed to provide: High availability across multiple regions Centralized private cloud management Secure workload and tenant isolation Disaster recovery and regional failover Scalable compute and storage capacity Centralized monitoring, logging, and alerting Infrastructure automation through APIs, Terraform, Ansible, and CI/CD pipelines This project demonstrates my ability to design secure, scalable, highly available private cloud platforms using OpenNebula, KVM, software-defined networking, distributed storage, infrastructure automation, and enterprise monitoring technologies.
0
21
0
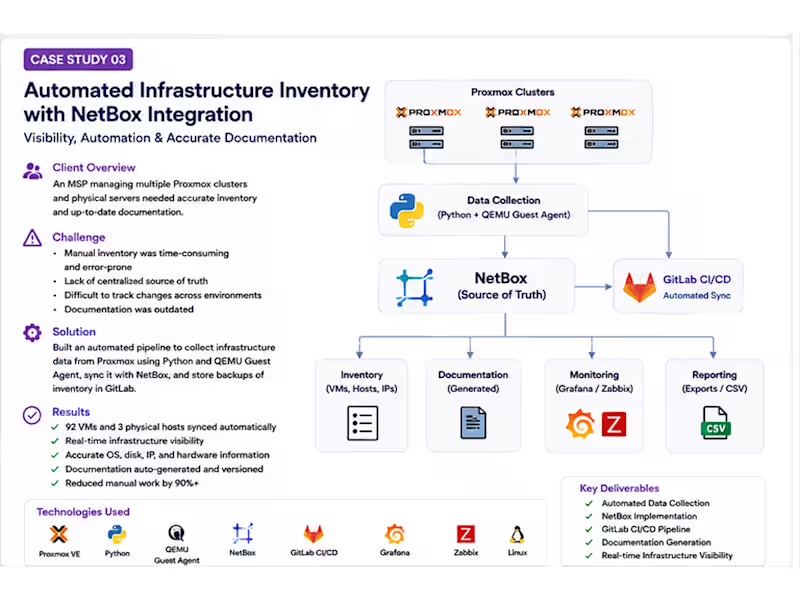
Automated Proxmox Inventory with NetBox
0
0
Grafana
(3)
Follow
Message
Explore people