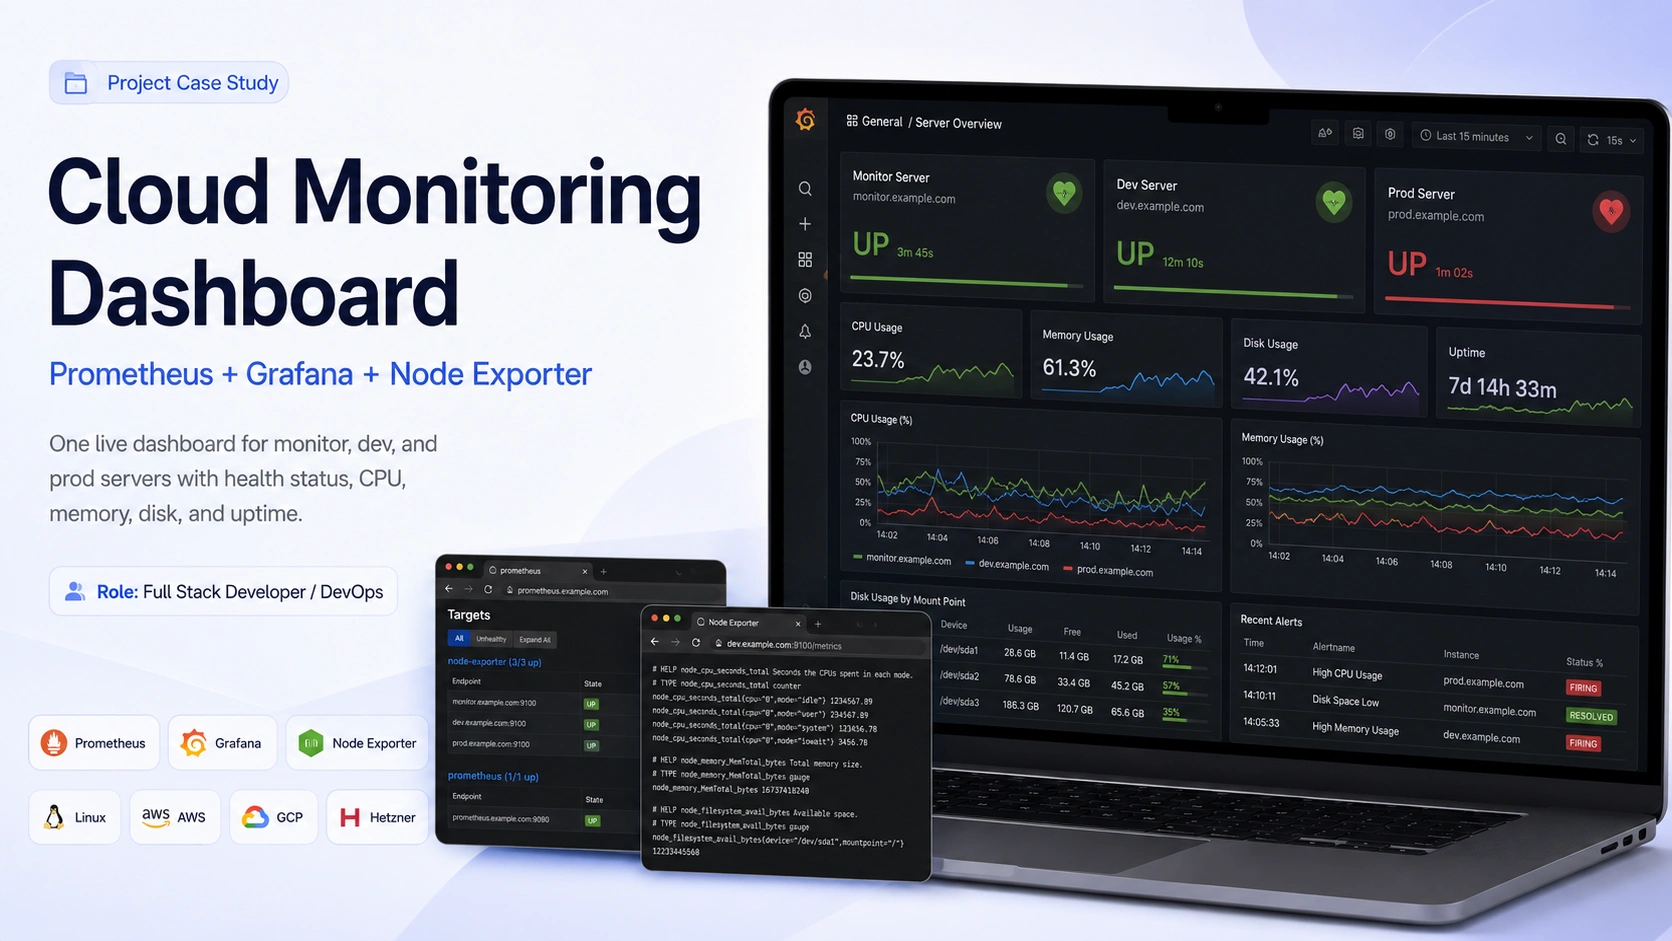
Centralized Server Monitoring System Implementation
Kittipong Sorasuchart ✧
Summary
Worked on setting up a centralized monitoring system for platform servers across multiple environments, including development, production, and the monitoring server itself.
The goal was simple: create one live monitoring page where the team could quickly see the health of every server without logging into each machine manually.
The setup was designed to work with servers hosted on different providers such as GCP, AWS, Hetzner, or any other Linux-based VPS/cloud environment.
The Challenge
The client needed a clear live dashboard that could show:
All dev and production servers in one place
Green/red health status for each server
CPU usage
Memory usage
Disk/storage usage
Uptime
Threshold-based warnings
A setup that could be extended to more servers later
The important part was keeping the platform servers clean and secure. The monitoring system should not add heavy services to every application server.
My Approach & Architecture
I used a centralized monitoring architecture.
A dedicated monitoring server runs:
Prometheus for collecting metrics
Grafana for the live dashboard
Node Exporter for monitoring the monitor server itself
If I show in graphic:
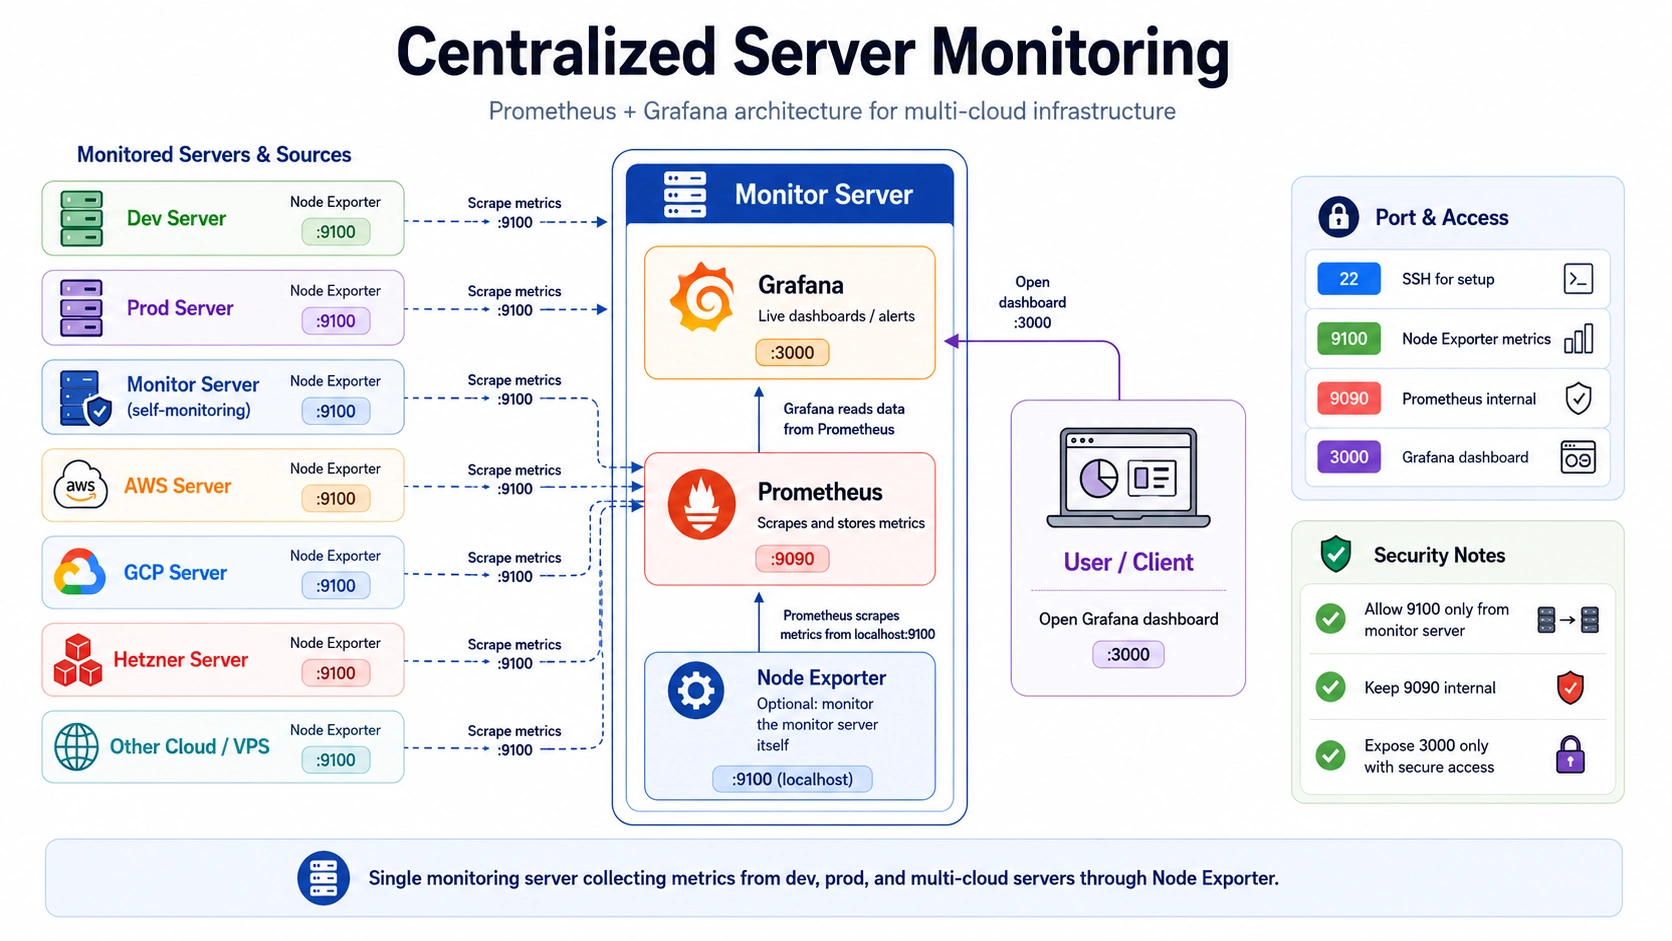
Architecture of Centralized Monitoring
Security Considerations
I configured the setup with security in mind.
Node Exporter metrics are not exposed publicly. Port 9100 is only allowed from the monitoring server IP.
Prometheus is kept internal and not exposed to the internet.
Grafana is the only service intended for team access, and it can be protected using firewall rules, VPN, HTTPS, or a reverse proxy depending on the infrastructure.
Key Features Implemented
Centralized Grafana dashboard
Prometheus metric collection
Node Exporter setup for Linux servers
Server health status cards
CPU, memory, disk, network, and uptime monitoring
Green/red threshold indicators
Dev, production, and monitor server visibility
Secure firewall-based access control
Scalable structure for adding more servers later
Tech Stack
Prometheus
Grafana
Node Exporter
Linux / RHEL / CentOS-style servers
Systemd services
Firewall rules
Cloud/VPS environments such as GCP, AWS, Hetzner, or similar providers
Result
The client received a single live monitoring page that shows the current health of all important servers.
Instead of checking each server manually through SSH, the team can now open Grafana and immediately see which servers are healthy, which ones need attention, and whether CPU, memory, or disk usage is crossing safe limits.
The setup is lightweight, provider-independent, and easy to expand as the platform grows.
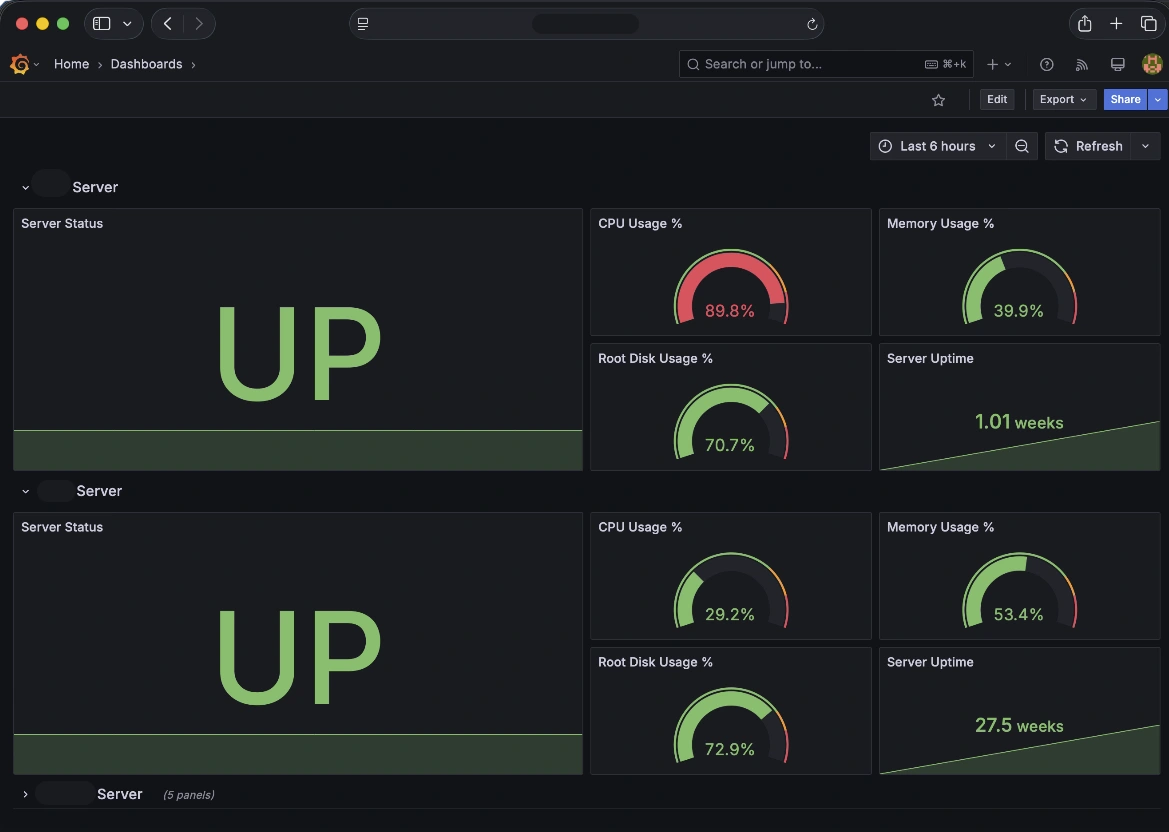
Result - Grafana Dashboard
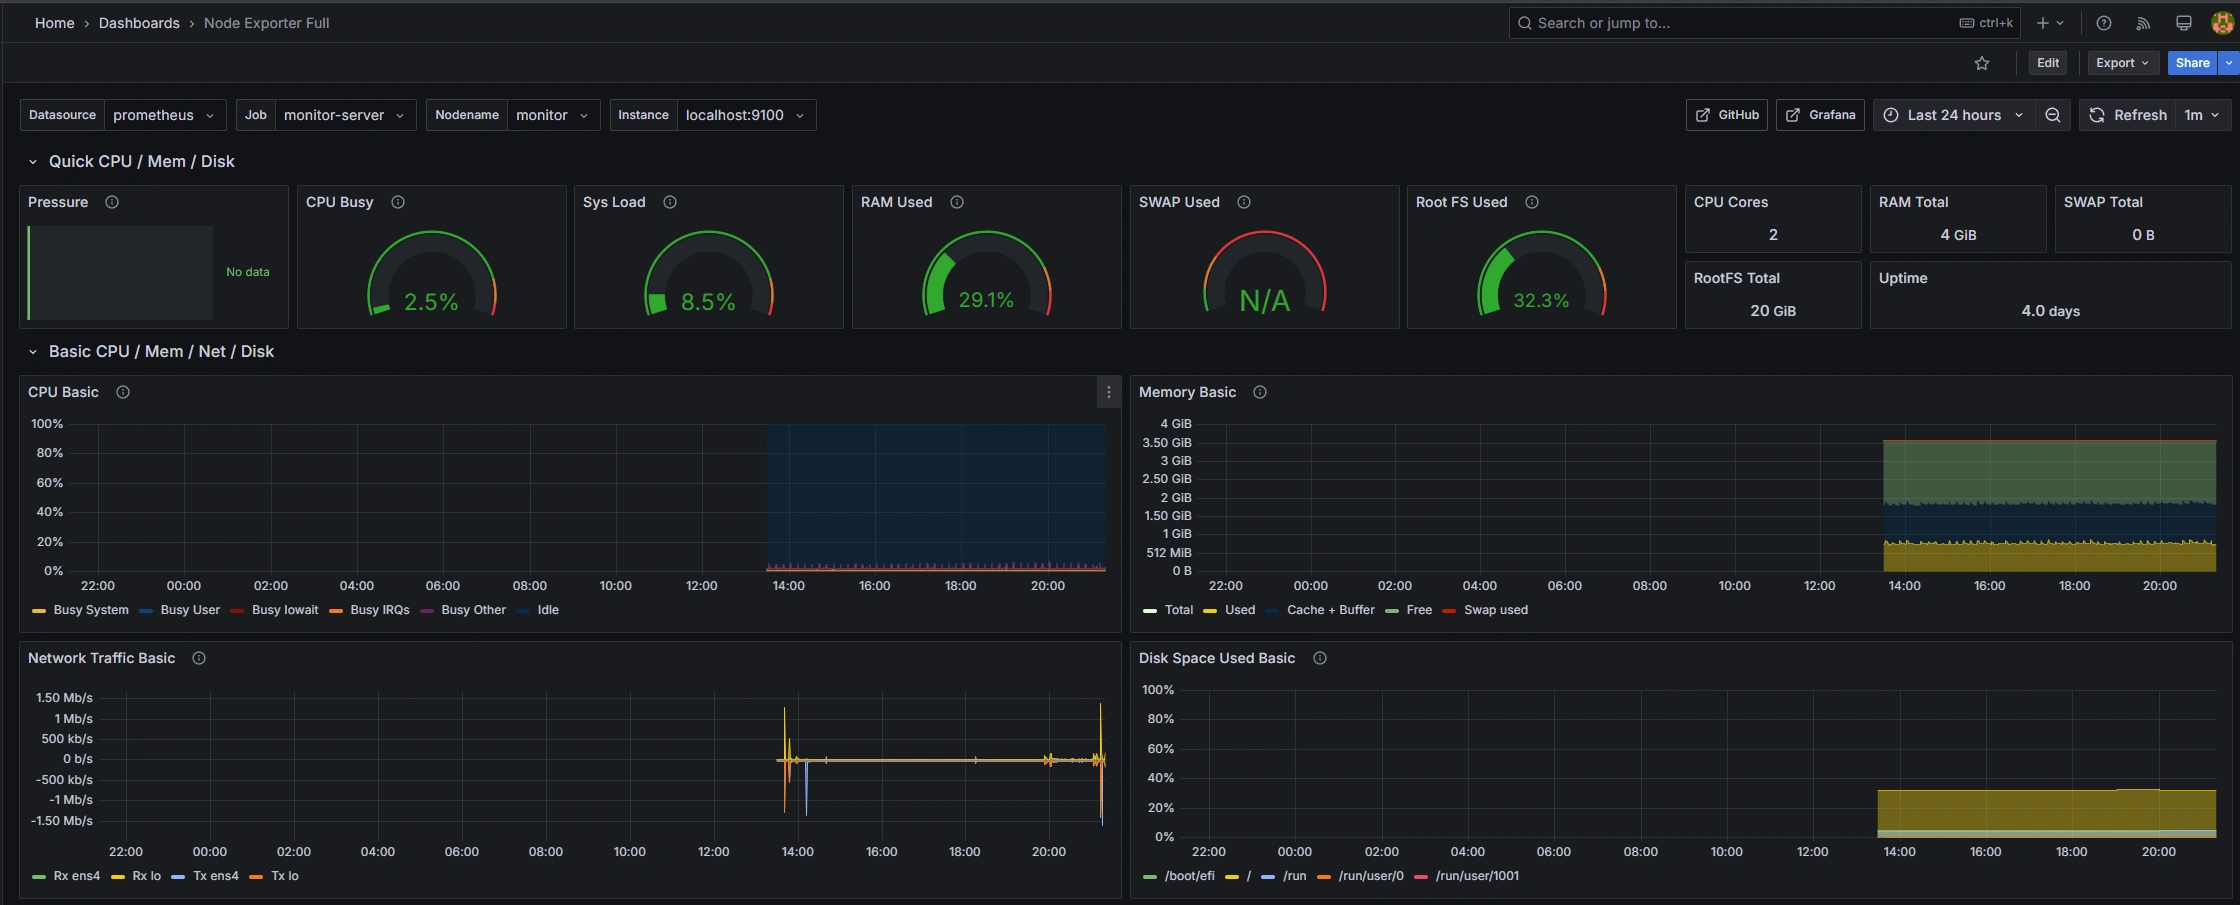
Detailed Dashboard
Have questions or need a monitoring server built? Feel free to contact me or Email us.
Meet our Team.
Like this project
Posted Jun 11, 2026
Implemented a centralized monitoring system for platform servers with Prometheus and Grafana.
Likes
6
Views
23
Timeline
Feb 5, 2025 - Feb 27, 2025