Freelance Business Analysts
Sign Up
Post a job
Sign Up
Log In
Filters
1
Projects
People
Geethasree Naguboina
pro
Hyderabad, India
Excel & KPI Dashboards for Small Business Decisions
97
Followers
Follow
Message
Excel & KPI Dashboards for Small Business Decisions
5
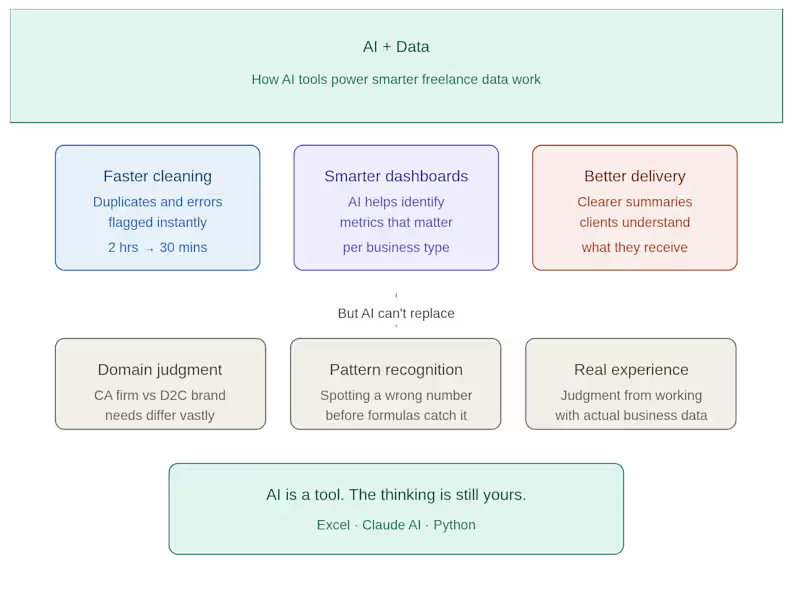
I used to spend hours cleaning messy Excel files manually. Now? I use AI tools to cut that time in half — and deliver better results to my clients. Here's how AI has changed my freelance data workflow: 🔹 Faster data cleaning Instead of manually hunting for duplicates and formatting errors, I use AI to flag inconsistencies instantly. What used to take 2 hours now takes 30 minutes. 🔹 Smarter dashboard structure Before building any dashboard, I use AI to help me think through what metrics actually matter for that specific business — not just what looks good. 🔹 Better client communication I use AI to help me write clearer project summaries and delivery notes — so clients understand exactly what they're getting and why it matters. But here's what AI can't replace: ✔ Understanding what a CA firm actually needs vs what a D2C brand needs ✔ Knowing when a number looks wrong before the formula catches it ✔ The judgment that comes from actually working with real business data AI is a tool. The thinking is still yours. If you're a small business owner or CA firm drowning in Excel data — I can help you turn it into something you can actually use. DM me or check my portfolio 👇 geethasree-data-support-cr241o7.gamma.site (http://geethasree-data-support-cr241o7.gamma.site)
3
5
399
3
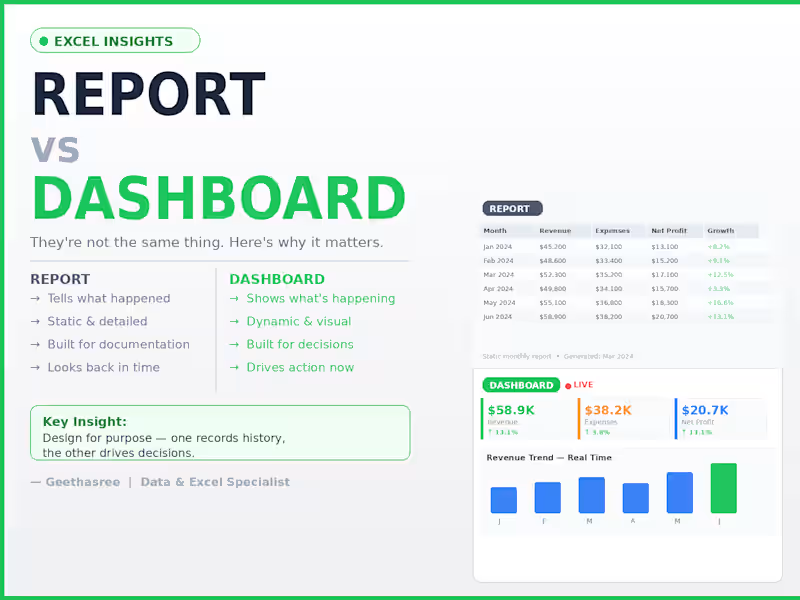
The difference between a report and a dashboard Most people use these words interchangeably. They're not the same thing. A report tells you what happened. A dashboard shows you what's happening. The difference: Report → static, detailed, built for documentation Dashboard → dynamic, visual, built for decisions The mistake I see most often: People build dashboards that are actually just reports. The result? — Decision makers scroll through pages of data — Numbers are outdated by the time anyone reads them — No one knows what to act on The fix is simple: A report answers: "What happened last month?" A dashboard answers: "What do I need to do right now?" When you design for the right purpose: Reports become clear records. Dashboards become decision tools. One looks back. The other drives forward.
2
3
209
6
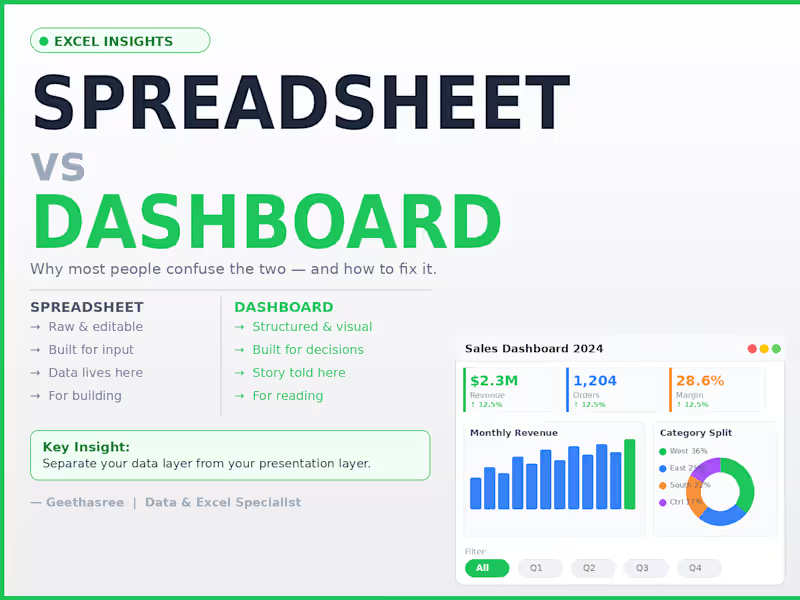
Most people think a spreadsheet and a dashboard are the same thing. They're not. A spreadsheet is where data lives. A dashboard is where decisions happen. The difference: Spreadsheet → raw, editable, flexible, built for input Dashboard → structured, visual, built for reading and decisions The mistake I see most often: People try to do both in the same sheet. The result? Decision makers see too much raw data Numbers get accidentally edited No one knows what to trust The fix is simple: Keep your data layer and your presentation layer separate. Raw data in one sheet. Dashboard in another. One is for building. One is for reading. When you separate them, updates become clean, mistakes become rare, and your reports actually get used. A spreadsheet stores your data. A dashboard tells its story.
4
6
226
4
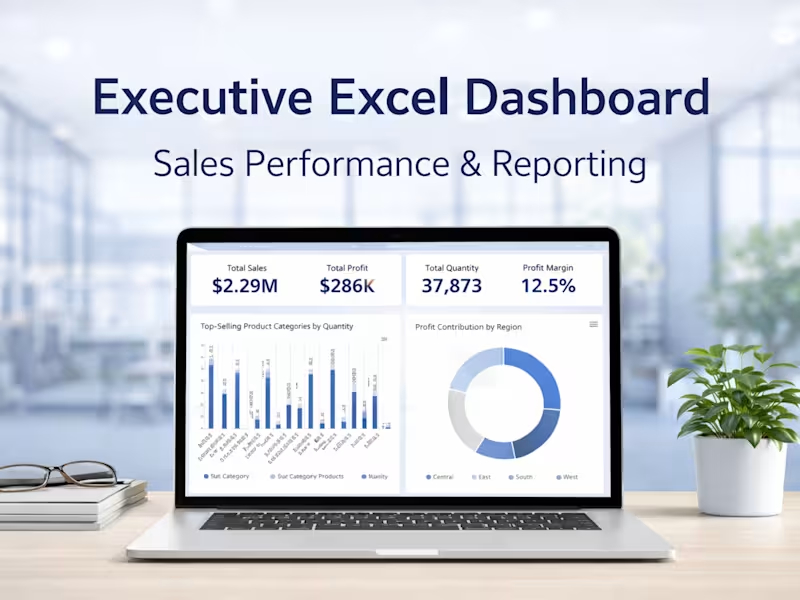
Executive Excel Dashboard for Business Reporting
4
8
Business Analyst
(4)
Follow
Message
Andy Luo
Washington, USA
Bridging the gap between data analysis and market
$50k+
Earned
1x
Hired
5.0
Rating
22
Followers
Follow
Message
Bridging the gap between data analysis and market
7
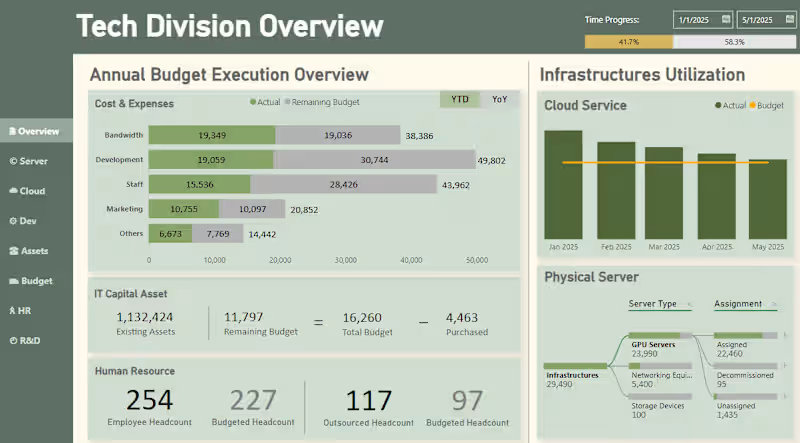
Budget Execution Analysis PowerBI Visualization
7
220
2
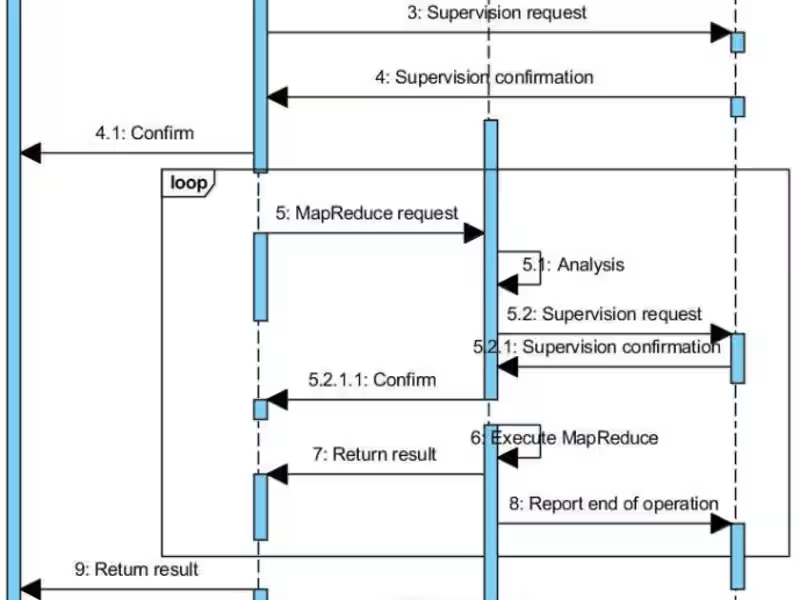
Agile and Technical System Diagram Designing
2
36
2
Recommendation System: Planning & Management
2
25
1
Bitcoin Price Prediction Using ML
1
20
Business Analyst
(1)
Follow
Message
Peter Chinaka
pro
Edmonton, Canada
Project & Automation Specialist
9
Followers
Follow
Message
Project & Automation Specialist
0
Product Owner at ServiceRocket
0
18
0
Agile Product Management at Mozilla MDN
0
37
0
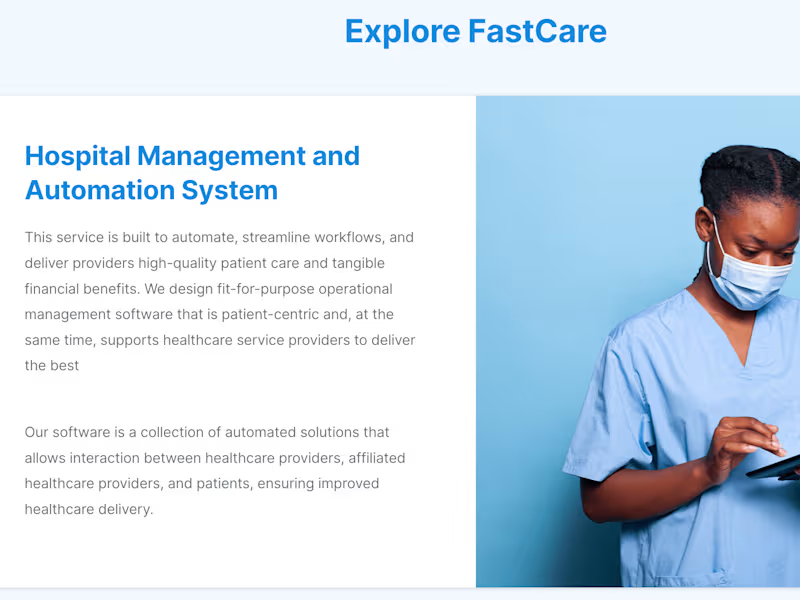
Implementation of a HMIS for a major hospital
0
17
0
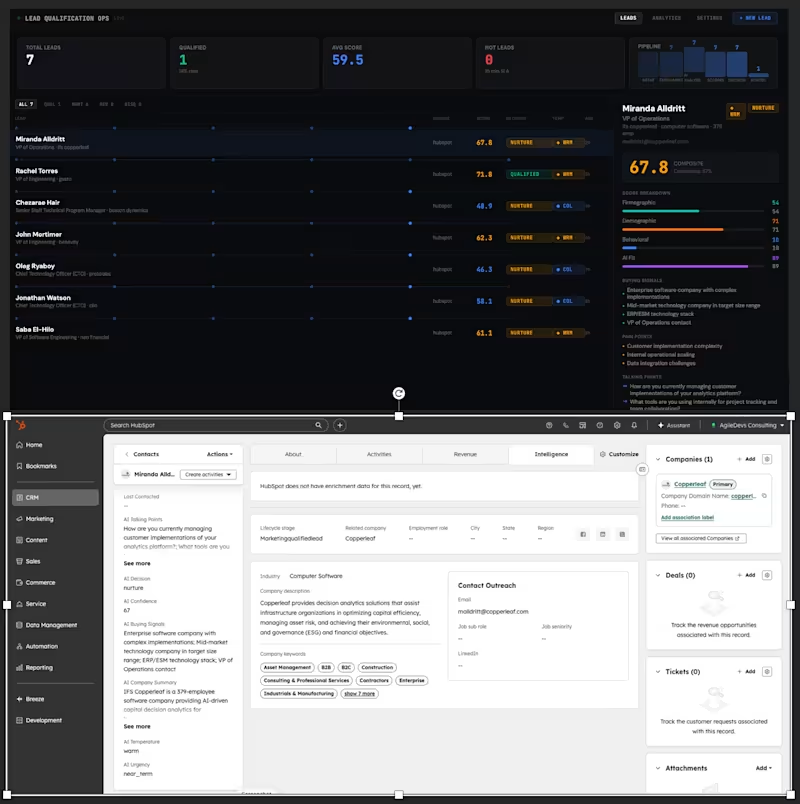
AI Lead Qualification & CRM Automation I built a production AI system that enriches, scores, and qualifies leads using Apollo, PDL, and Claude AI — writing decisions and talking points back to HubSpot. How It's Used: A Sales Rep creates a HubSpot contact. n8n detects it, enriches via Apollo/PDL, runs Claude AI scoring, writes results back in under 60s. Qualified leads trigger Slack alerts. Key Highlights – 5-agent pipeline: Research, Qualification, Routing, Engagement, Feedback – Parallel enrichment + Claude AI analysis – n8n: HubSpot trigger → Vercel → CRM writeback + Slack – Configurable ICP settings — no code needed Outcomes ✓ End-to-end HubSpot → AI → CRM in under 60s ✓ 4-dimension scoring with feedback loop ✓ Live ops dashboard Stack - Python · Vercel · Supabase · n8n · Claude API · Apollo · PDL · HubSpot · Slack · React
1
0
93
Business Analyst
(3)
Follow
Message
Joven Garcia
Quezon City, Philippines
AI & Automation | n8n/Make/Zapier/Airtable/Notion | CRM SaaS
48
Followers
Follow
Message
AI & Automation | n8n/Make/Zapier/Airtable/Notion | CRM SaaS
1
AI Platform for Real Estate Permit Data Extraction
1
0
1
WhatsApp Personal Chatbot for Task Management
1
3
0
LLM + RAG Chat with AlloyDB and Vertex AI
0
6
1
AI Resume Screening Automation (n8n + Gemini)
1
2
Business Analyst
(2)
Follow
Message
USMAN AKINTOBI
Nigeria
Making Sense of Data to Drive Decisions
5.0
Rating
6
Followers
Follow
Message
Making Sense of Data to Drive Decisions
1
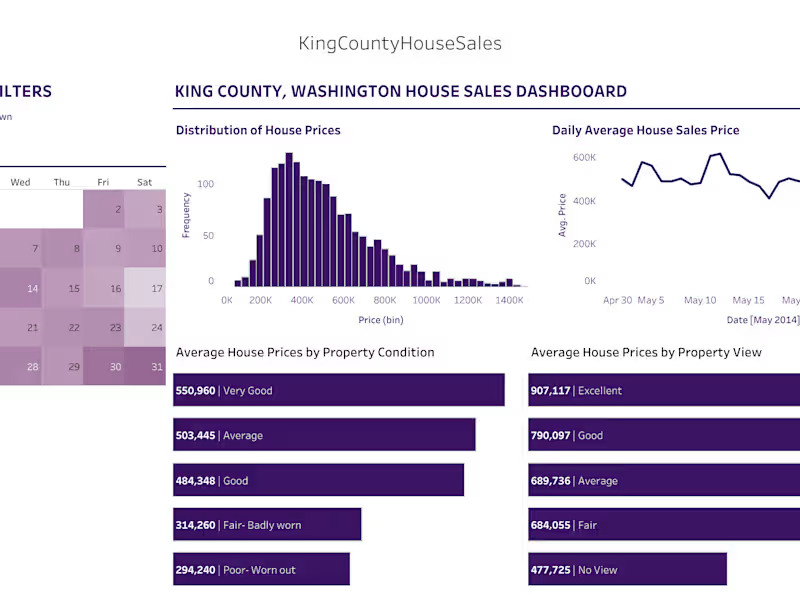
Housing Dashboard
1
6
1
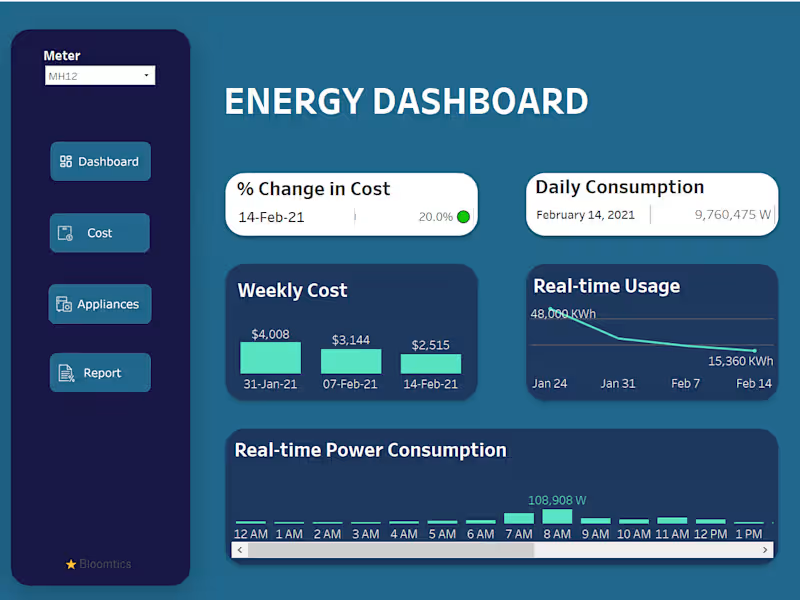
Energy Dashboard
1
10
2
DSP Asset Managers
2
27
1
Context-Aware Fintech User Feedback Classification & Urgency Detection Most feedback tools stop at sentiment; positive or negative. This project goes further by building a decision-driven NLP system that classifies fintech user feedback by issue type and detects operational urgency, enabling smarter triage and escalation. What was built: Two machine learning models trained on manually collected and annotated app store reviews from real fintech platforms like Revolut, Wise, and Monzo: Issue Classifier: categorizes feedback into 9 classes including transaction issues, account security, KYC, refunds, app performance, and fraud Urgency Detector: binary classifier that flags high-risk feedback requiring immediate attention, optimized for recall to minimize missed critical cases
1
47
Business Analyst
(3)
Follow
Message
Amatullah Campbell
pro
London, UK
Cybersecurity GRC Consultant | Ex-Accenture
Follow
Message
Cybersecurity GRC Consultant | Ex-Accenture
2
Business Analyst for a Government client on behalf of Accenture. Supported the delivery of a data warehouse programme aimed at centralising data, improving reporting capabilities and enabling data-driven decision-making across multiple departments. Worked closely with business and technical stakeholders to define data requirements and ensure alignment with strategic objectives. My duties included the following: ▪ Led requirement gathering activities to capture data, reporting, and analytics needs through stakeholder interviews, workshops, and process analysis. ▪ Facilitated workshops with business users, data engineers and architects to define data sources, data flows and reporting requirements. ▪ Produced detailed documentation including business requirements documents (BRDs), data requirements, data mapping specifications, and user stories. ▪ Collaborated with technical teams to translate business needs into data models, ensuring clarity on data definitions, transformations, and quality rules. ▪ Translated business needs into structured user stories and acceptance criteria, supporting agile delivery and ensuring traceability from requirements through to implementation. ▪ Managed RAID logs and supported programme governance by tracking risks, dependencies, and data-related issues. ▪ Supported UAT by defining acceptance criteria, validating outputs, and ensuring delivered data aligned with business expectations. Key outcomes included: Key outcomes included: ▪ Delivered clearly defined data and reporting requirements, enabling the successful design and implementation of the data warehouse. ▪ Improved data consistency and trust by standardising data definitions and aligning stakeholders on a single source of truth. ▪ Strengthened delivery alignment by linking use cases and user stories directly to technical outputs, reducing ambiguity and rework.
1
2
167
1
Technical Writing for a major Retail client that was on the verge of going Public on behalf of Accenture. Working with the Cybersecurity Programme Manager to unify and capture the deployment of several cybersecurity tools (Tanium, Crowdstrike, Tenable) across 120+ organisations. My duties included the following: ▪ Supported the programme lead by documenting all SOPs, policies and standards as required by the Cyber team. ▪ Conducted business requirement gathering sessions to develop subsequent documentation such as skills matrix, roles and responsibilities, RACIs and RAID logs. ▪ Supported on project management tasks such as maintaining the RAID logs, overseeing cyber tool deployment and updated status reports. Key outcomes included: ▪ Created a documentation foundation that the team could operate from independently, reducing reliance on tribal knowledge. ▪ Translated stakeholder needs into structured deliverables — moving from raw requirements to tangible outputs like skills matrices, RACIs, and roles & responsibilities. ▪ Supported successful cyber tool deployment by providing oversight and coordination, contributing to the programme's technical execution.
1
149
1
Cybersecurity Strategy Consulting and Project Management for an airline that was in its start-up phase in the Middle East on behalf of Accenture. My duties included the following: - Leading the Cyber GRC project to build the cybersecurity function for an aviation client, filling a critical security gap and laying groundwork for sustained cyber resilience. - Developing and implementing a cybersecurity strategy and roadmap aligned with ISO 27001 and region-specific regulations. - Executing a specialised threat profiling exercise, developing a unique threat landscape and identifying risks and vulnerabilities specific to the aviation sector. - Creating a detailed cybersecurity strategy and roadmap with an executive summary, ensuring alignment with client objectives and clarity for C-suite stakeholders. Key outcomes included: - Established a cybersecurity function from the ground up, giving the client a formal security posture where none previously existed. - Reduced organisational risk exposure by identifying aviation-specific threats before they could be exploited. - Positioned the client for long-term cyber resilience rather than reactive, ad hoc security responses.
1
153
2
Cybersecurity Project Manager for a UK Government client on behalf of Accenture. My duties included the following: ▪ Led key projects aligned with the client's strategic goals, showcasing project leadership and strategic alignment capabilities. ▪ Successfully led and managed three major projects, ensuring they met important client milestones and demonstrated effective project coordination and management skills. ▪ Prepared critical documents necessary for the delivery and completion of program milestones, evidencing meticulous organizational skills and attention to detail. ▪ Actively steered discussions with project directors and stakeholders, showcasing skills in strategic communication and influence at senior management levels. ▪ Worked in close collaboration with senior stakeholders, ensuring alignment with strategic goals and successful achievement of key program milestones, reflecting a strong capacity for teamwork and stakeholder management. Key outcomes included: ▪ Successfully delivered three major cybersecurity projects simultaneously for a UK Government client, demonstrating the ability to manage complexity, competing priorities and high-stakes deadlines in a regulated environment. ▪ Ensured all projects met critical client milestones, directly contributing to programme progression and client confidence in delivery. ▪ Produced critical programme documentation that underpinned milestone delivery, ensuring governance, accountability and audit trails were maintained to the standard expected of a UK Government engagement.
2
312
Business Analyst
(2)
Follow
Message
Md Jobair Mahmud
Chattogram, Bangladesh
Google Analytics 4 | GA4 GTM Meta Pixel FB CAPI Server-Side
15
Followers
Follow
Message
Google Analytics 4 | GA4 GTM Meta Pixel FB CAPI Server-Side
1
🔥 Marketers, eCom founders, and agency owners listen up. You’re probably losing 30–40% of your ad data right now. Meta’s guessing your conversions. Google Ads is under-reporting. And you’re wondering why ROAS feels like a magic trick gone wrong. 🎩💨 Here’s the truth 👉 Without proper tracking, you’re not running ads… you’re burning cash. That’s exactly why I help brands & agencies fix their data flow so they can scale with clarity. 💡 What I set up for my clients: Server-Side Tracking (GTM + Stape.io (http://Stape.io)) Meta (Facebook) Conversion API — custom domain, 1P tracking Shopify Custom Pixel & Data Layer Setup Google Analytics 4 (Ecommerce Tracking) Google Ads Conversion + Dynamic Remarketing Tags Google Looker Studio All stitched together so your campaigns can finally see the real numbers. 📈
1
559
2
Your marketing isn’t broken your data is. Most agencies show you “pretty dashboards.” I build ones that make you money. Here’s what my Web Analytics portfolio includes: ✅ GA4 + GTM full event tracking setup ✅ Meta Pixel + Conversion API (Server-side via Stape / Taggrs.io (http://Taggrs.io)) ✅ TikTok, Pinterest, LinkedIn & Bing pixel setup ✅ Data Studio dashboards that show exactly which ads drive profit ✅ Funnel analysis for eCom & lead-gen brands Most brands have tracking, but not truth. They’re scaling ads with fake numbers and then wonder why ROAS dies. The Solution: I fix that by making your tracking bulletproof. When your analytics tell the truth, scaling becomes simple math. If you want me to audit your tracking system for free and show where your data leaks,
2
628
0
TikTok Pixel Ecommerce Conversion Tracking Setup via Google Tag Manager 🧩 Project Overview This project highlights a complete TikTok Pixel tracking setup for an ecommerce store using Google Tag Manager (GTM). The main goal was to track and measure every key ecommerce event across the customer journey — from product view to purchase — and send this data to TikTok Ads Manager for better campaign optimization and retargeting. By implementing TikTok Pixel through GTM and enhancing it with custom data layer variables, we achieved 100% accurate tracking while maintaining full flexibility for future updates or server-side tracking. 🛠️ Tools & Platforms Used Google Tag Manager (GTM) TikTok Ads Manager TikTok Pixel Ecommerce Data Layer GA4 (for parallel tracking validation)
0
248
0
Integrating TikTok Pixel and Server-Side Event API with GTM
0
34
Business Analyst
(6)
Follow
Message
Johnson Wairimu
Nairobi, Kenya
Delivering Strategic Growth Through Data, Finance & Tech.
8
Followers
Follow
Message
Delivering Strategic Growth Through Data, Finance & Tech.
0
📊 Toyota Global Performance Dashboard — Quick Analysis by Intersect Analytics We recently came across Toyota’s global automotive data and carried out a quick Power BI-driven business intelligence analysis to uncover the trends driving performance, revenue, and market dominance. Key Findings: 🚗 RAV4 emerged as a major revenue driver, reinforcing the growing dominance of SUVs in the global automotive market. 🌍 Asia-Pacific remains Toyota’s strongest-performing region, contributing the largest share of global vehicle sales and market influence. ⚡ Hybrid & electrified vehicles continue gaining momentum, signaling a strong transition toward sustainable and future-focused mobility. 📈 Toyota maintained impressive global sales performance, with a small number of flagship models driving a significant share of total revenue. 💡 What does this tell us? The businesses leading today are not necessarily those with the most data — but those that understand how to use it strategically. At Intersect Analytics, we specialize in transforming raw business data into strategic insights, executive dashboards, automation systems, and business intelligence solutions that improve decision-making and unlock growth opportunities. Our services include: ✅ Power BI Dashboard Development ✅ Business Intelligence & Data Analytics ✅ Workflow Automation Across Multiple Platforms ✅ Financial, Sales & Operational Analytics ✅ Executive Reporting & KPI Tracking ✅ SQL, Python, Excel & Cloud Analytics Solutions ✅ AI-Powered Reporting & Predictive Insights Whether you operate in finance, logistics, healthcare, retail, manufacturing, or e-commerce, we help organizations transform complexity into clarity through data visualization, automation, and advanced analytics. Because data alone does not create growth. Insights do. DECISIONS BACKED BY DATA. GROWTH DRIVEN BY INSIGHT. 📱 WhatsApp: +254 723 632 207 #DataAnalytics #BusinessIntelligence #PowerBI #DashboardDesign #Automation #FinancialAnalytics #SQL #DataVisualization #AI #DigitalTransformation #Toyota #BusinessGrowth
0
27
3
This dashboard delivers a comprehensive 5-year analysis (2021–2025) of the global automotive industry, clearly highlighting how China has emerged as the undisputed market leader. The data reveals that China is not only the largest automotive market globally, but also the fastest-growing, now accounting for over 35% of global vehicle sales. With strong growth in electric vehicles (EVs), exports, and total production, China is capturing the majority of global industry expansion while other major economies grow at a slower pace. Key insights from the dashboard include: China’s sales growth significantly outpaces global averages Rapid acceleration in EV adoption, nearing half of total sales Strong export growth positioning China as a global automotive powerhouse A widening gap between China and other major markets like the USA, Japan, and Germany 💼 About Our Services – Intersect Analytics At Intersect Analytics, we specialize in transforming complex data into clear, actionable insights that drive strategic decision-making. Our core services include: 📊 Interactive Dashboard Development (Power BI, Tableau) 📈 Data Analysis & Business Intelligence 🔍 Market Research & Industry Insights 🤖 Data Automation & Reporting Solutions 📉 Financial & Operational Analytics ⭐ Why Choose Intersect Analytics? Data-Driven Precision – We go beyond visuals to deliver insights that matter Business-Focused Approach – Every dashboard is tailored to support real decisions Advanced Technical Expertise – Skilled in Power BI, SQL, Python, and financial modeling Clean, Executive-Ready Designs – Dashboards that are both insightful and visually compelling Fast Turnaround, High Impact – We deliver quality solutions efficiently 🎯 The Bottom Line This dashboard is more than just a visual—it’s a strategic tool that clearly shows how global dynamics are shifting, with China leading the future of the automotive industry. 👉 With Intersect Analytics, you don’t just get data—you get clarity, direction, and a competitive edge.
1
3
77
3
🌍 Electric Vehicle Market Overview & Key Findings This dashboard presents a comprehensive analysis of the global shift toward electric mobility, highlighting trends in EV adoption, sales growth, and market dynamics across key regions. 📊 Key Findings: The global EV market is experiencing rapid acceleration, driven by policy support, technological advancements, and increasing environmental awareness. Asia, particularly China, continues to dominate EV adoption, while Europe and North America show strong and consistent growth. EV sales are steadily outpacing traditional internal combustion engine (ICE) vehicles, signaling a structural shift in the automotive industry. Market expansion is supported by improvements in battery technology, cost reductions, and increased investment in charging infrastructure. 🔮 Market Outlook EV adoption is projected to continue growing significantly over the next decade, with millions of new electric vehicles entering the market annually. Emerging markets present untapped growth opportunities, although infrastructure and affordability remain key challenges. The transition to electric mobility is expected to reshape global energy demand, reducing reliance on fossil fuels and accelerating sustainability goals. Companies that leverage data-driven insights will be better positioned to navigate this evolving landscape and capture market share. 🚀 Powered by Intersect Analytics At Intersect Analytics, we go beyond dashboards—we deliver actionable intelligence. We help businesses: ✅ Transform raw data into strategic insights ✅ Build interactive Power BI dashboards ✅ Perform advanced Python data analysis ✅ Develop predictive models & forecasts ✅ Optimize operations through data-driven decision-making 📩 Whether you're in automotive, energy, finance, or consulting, we help you turn complex data into clear, actionable strategies that drive growth. Let’s unlock the power of your data.
2
3
143
2
🌍 Middle East Market Insights: Top 20 Leading Companies (2024) What drives growth and profitability in the Middle East? Using advanced data analytics, Python, and Power BI dashboards, we analyzed the region’s top companies across energy, banking, telecom, and logistics—uncovering where the biggest opportunities lie. 📊 Key insights: ✔ Energy dominates revenue and profit across the region ✔ Banking and telecom sectors show strong, stable growth ✔ Rapid diversification into technology, renewables, and infrastructure At Intersect Analytics, we help businesses across the Middle East unlock the full potential of their data through: ✅ Power BI Dashboard Development ✅ Advanced Python Data Analysis ✅ Financial & Business Intelligence Solutions ✅ Predictive Analytics & Reporting Automation 🚀 Whether you're in UAE, Saudi Arabia, Qatar, or beyond, we deliver data-driven insights that drive smarter decisions and measurable growth. 📩 Let’s work together to turn your data into a competitive advantage. #DataAnalytics #MiddleEastBusiness #PowerBI #BusinessIntelligence #DataVisualization #Python #FinancialAnalysis #DashboardDesign #UAE #SaudiArabia #AnalyticsServices
1
2
70
Business Analyst
(8)
Follow
Message
Explore people