DSP Asset Managers
USMAN AKINTOBI

Business Overview: About DSP Asset Managers Private Limited
DSP Asset Managers is a premier player in India's insurance and asset management industry. They specialize in offering tailored financial solutions to diverse clients, including individual investors, corporations, and institutions. Their services encompass portfolio management, wealth planning, and investment advisory, making them a trusted partner for financial growth.
The Challenge
DSP Asset Managers faced a significant challenge in monitoring and optimizing the performance of their sales representatives. Sales reps were essential to their operations, meeting revenue targets and maintaining relationships with high-value customers. However, the company struggled with:
Tracking individual performance against targets.
Understanding year-over-year trends in gross margin and revenue by customer.
Identifying top performers and areas needing improvement.
These issues created a gap in decision-making and resource allocation.

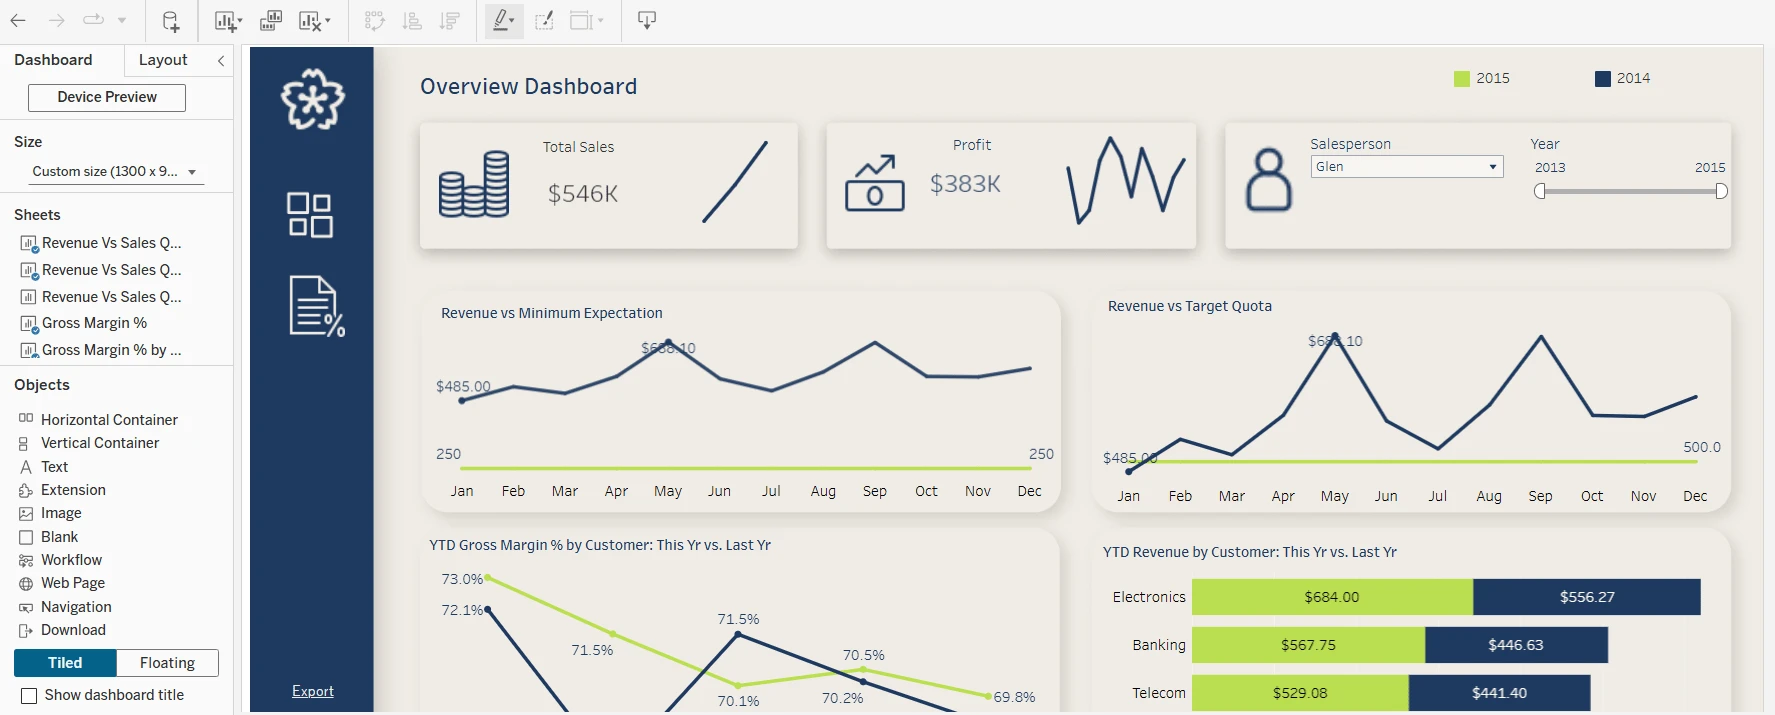
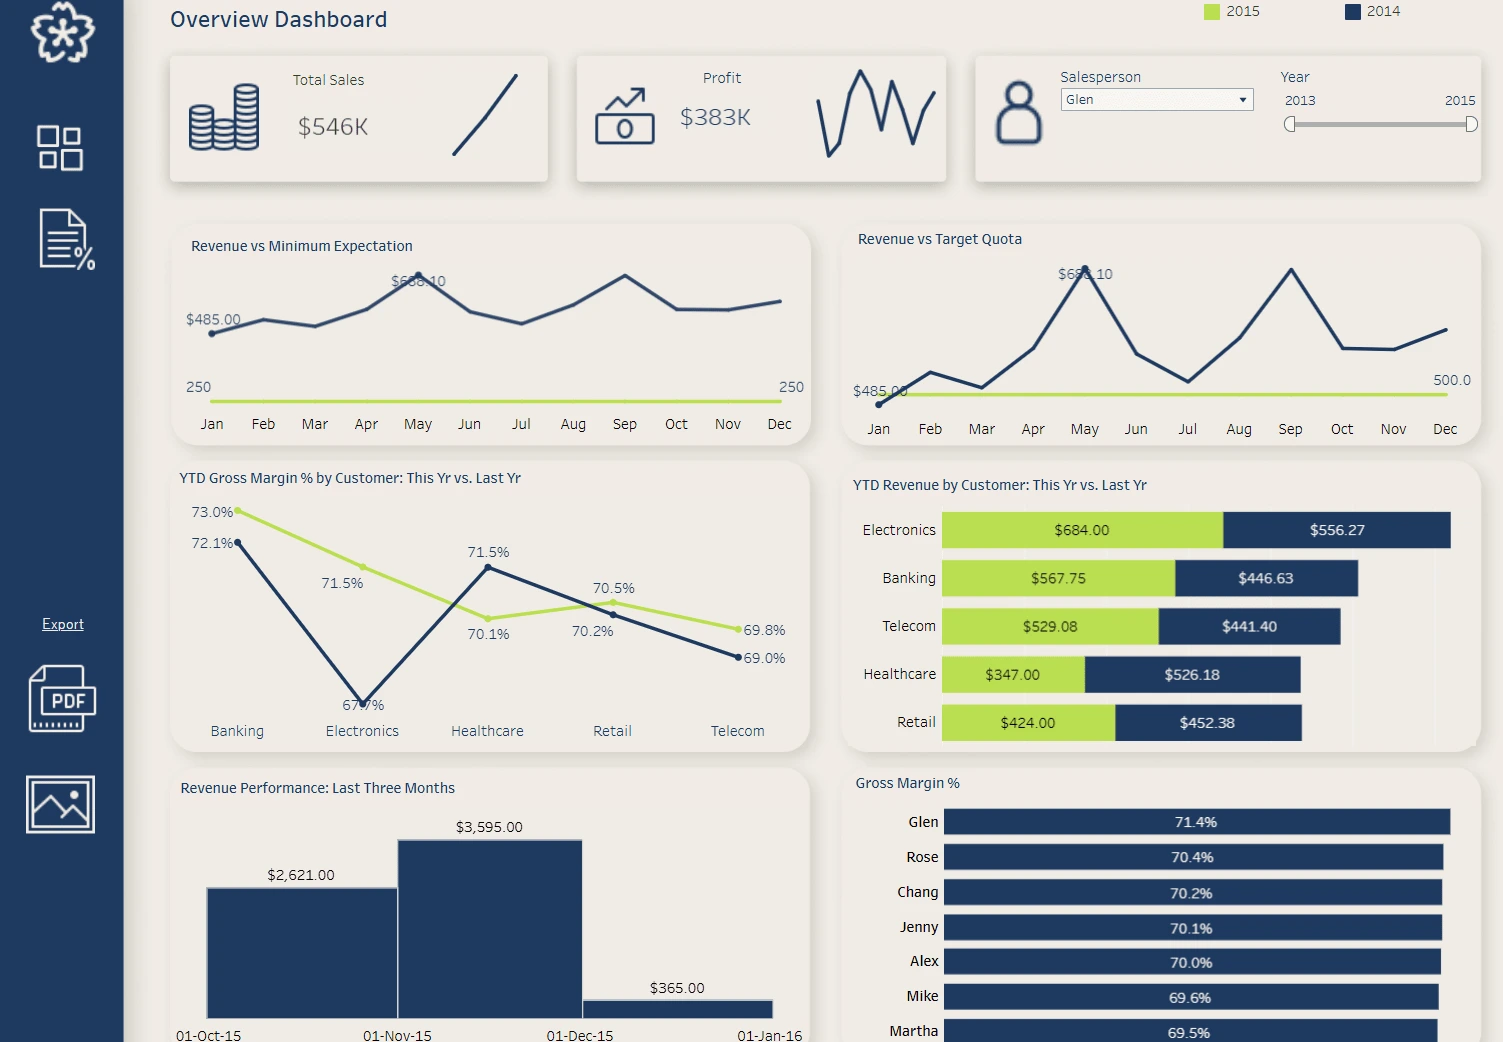
The Strategy: Dashboard Design Process
The solution involved creating a Sales Representative Dashboard to address the company's needs. This dashboard incorporated the following components:
Revenue vs. Minimum Expectation & Revenue vs. Target Quota: To measure whether reps meet or exceed minimum thresholds and ambitious goals.
YTD Gross Margin % by Customer: Comparison of this year's and last year's data to evaluate customer profitability trends.
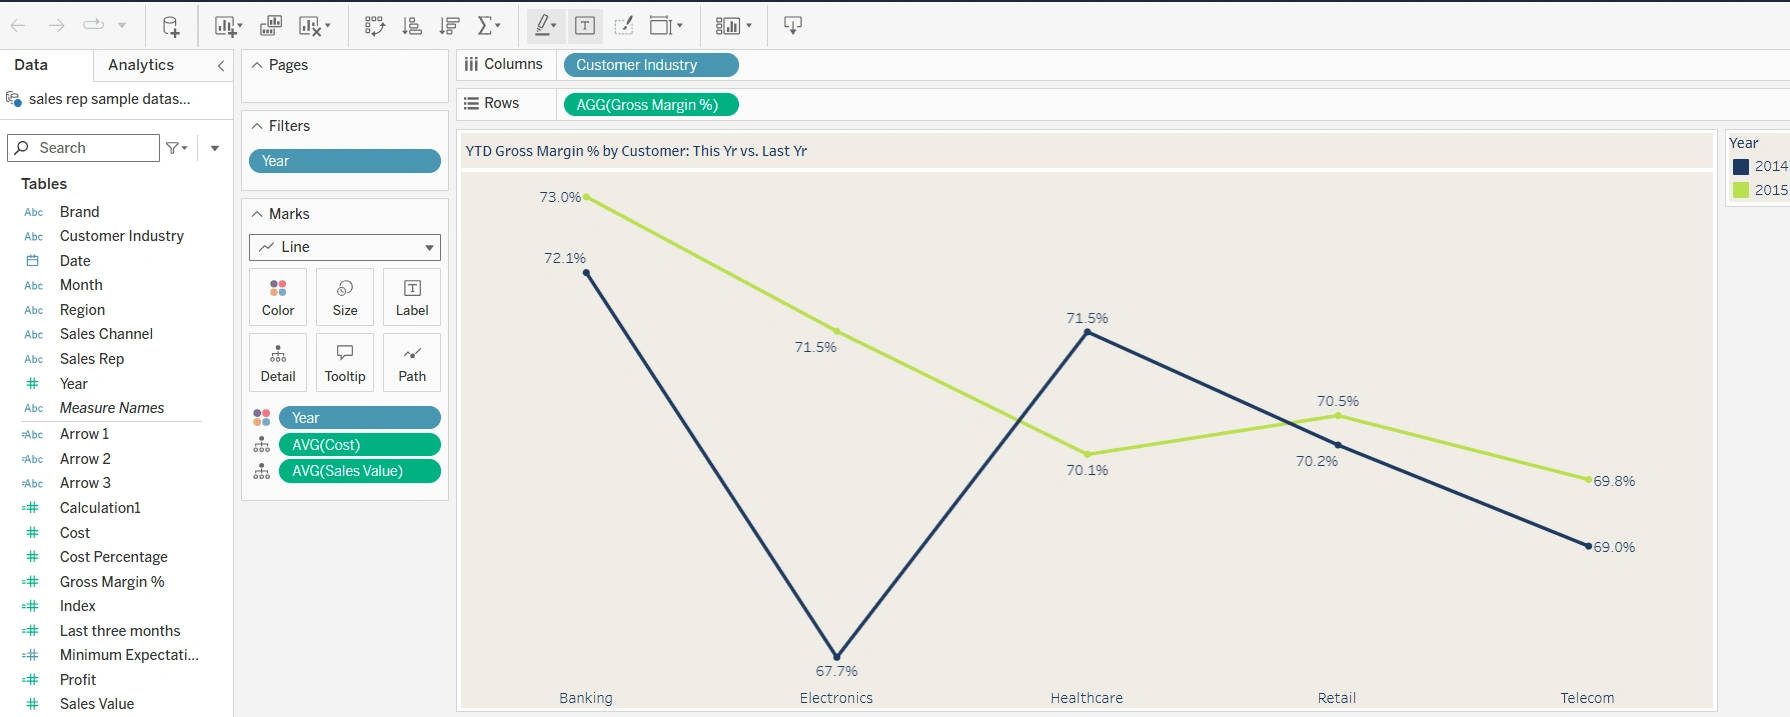
Gross Margin % Per Customer
YTD Revenue by Customer: Tracking high-revenue customers and identifying new opportunities.
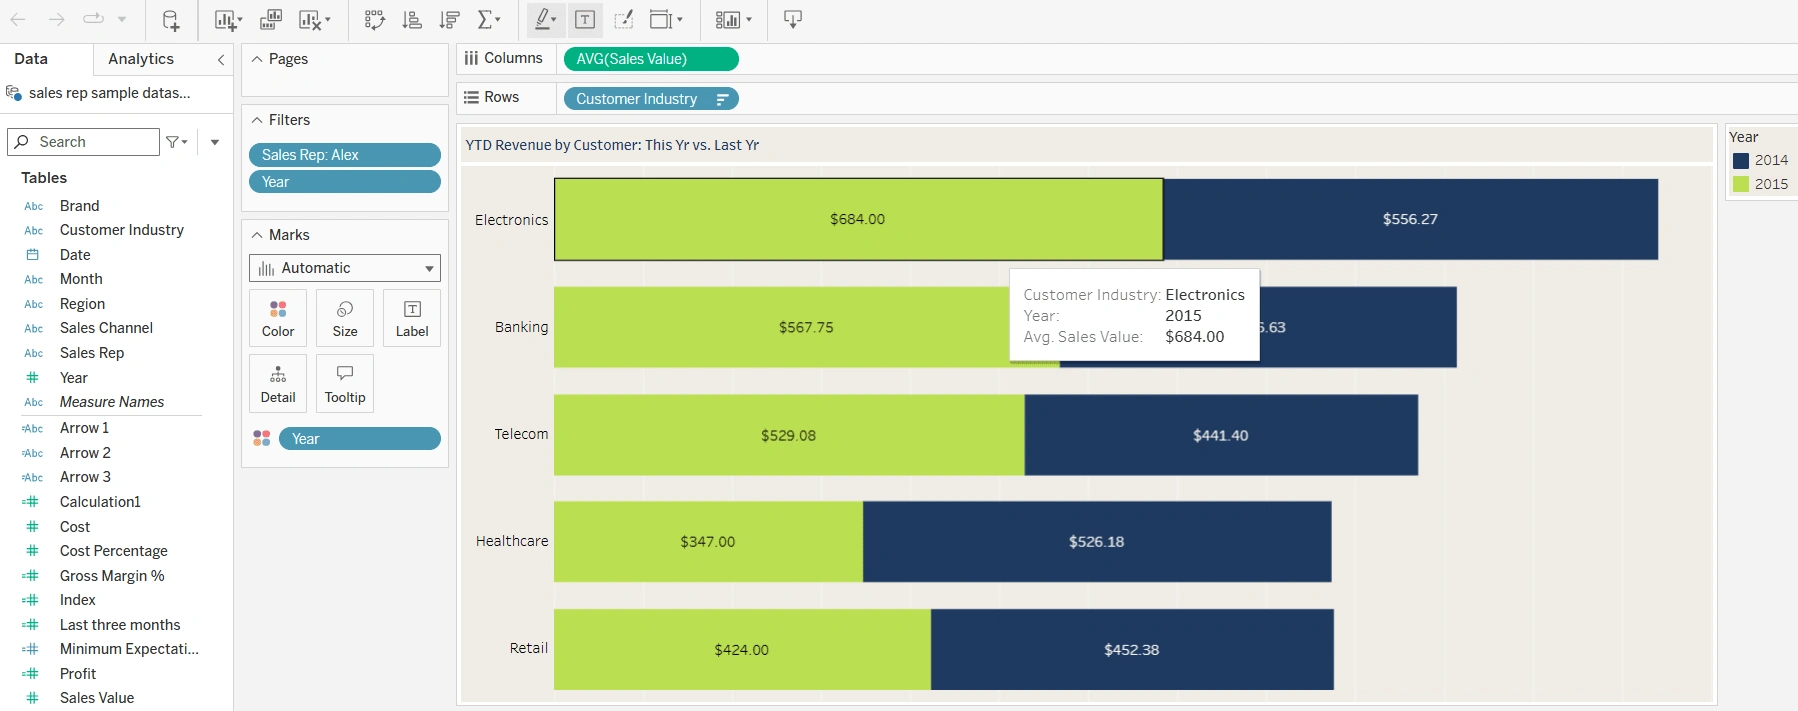
Revenue by Customer
Gross Margin %: A critical metric to assess profitability.
Revenue Performance - Last Three Months: Visualizing short-term trends to inform agile decisions.
The strategy was to provide a real-time, interactive dashboard that management could use to track performance, identify outliers, and deploy resources strategically.
Impact on Business: The Results
The dashboard delivered measurable improvements in decision-making and sales strategy:
Sales leadership could quickly identify top and underperforming reps, optimizing coaching and support.
Insights from year-over-year gross margin and revenue trends helped target high-value customers with tailored solutions.
The 3-month revenue performance visualization allowed the company to adapt sales strategies to seasonal trends and market fluctuations.
Revenue vs. target and minimum expectations clarified overall progress toward organizational goals.
The result was improved sales efficiency and a notable increase in revenue growth, with a stronger alignment between sales activities and company goals.
Like this project
Posted Oct 18, 2024
The dashboard project focused on tracking sales performance metrics for sales representatives.