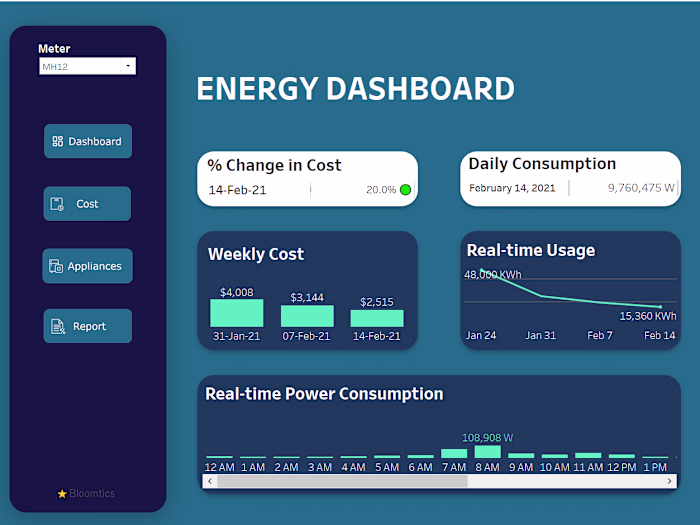
Housing Dashboard
USMAN AKINTOBI
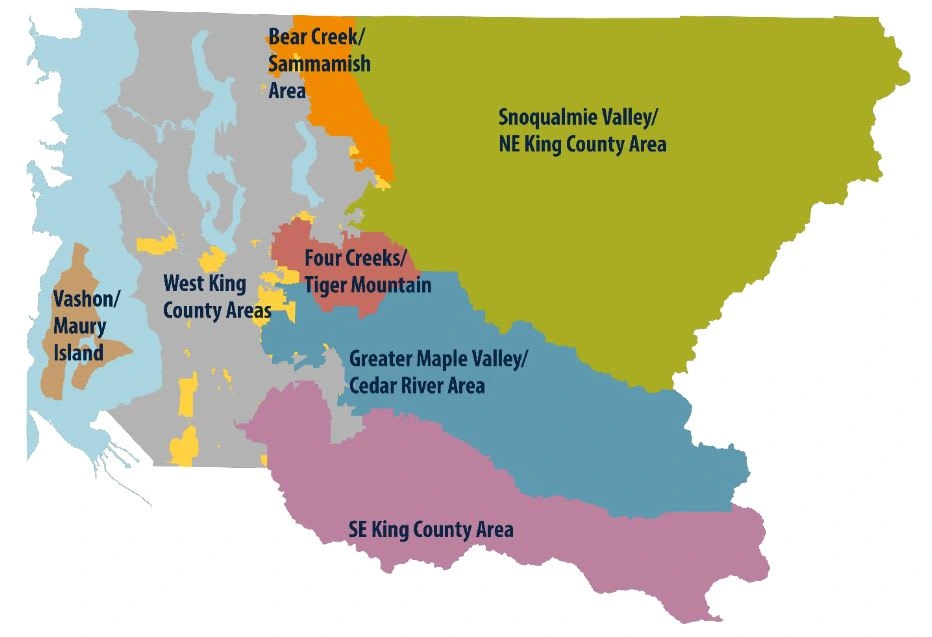
King County Map
Business Overview: King County Real Estate Market
King County, Washington, boasts a dynamic real estate market driven by a mix of urban hubs like Seattle and sprawling suburban and rural areas. Known for its tech-driven economy, cultural diversity, and scenic beauty, the region has seen fluctuating housing prices due to high demand and limited supply.
Market Problem
The King County real estate market faced several challenges that this dashboard aimed to address:
Lack of clarity in house price distribution makes it hard to identify trends.
Difficulty understanding how property conditions and views impact average house prices.
Potential buyers or realtors cannot filter data based on specific criteria, such as year built or square footage.
These factors created a need for a data-driven approach to improve transparency and empower buyers, sellers, and realtors.
The Strategy
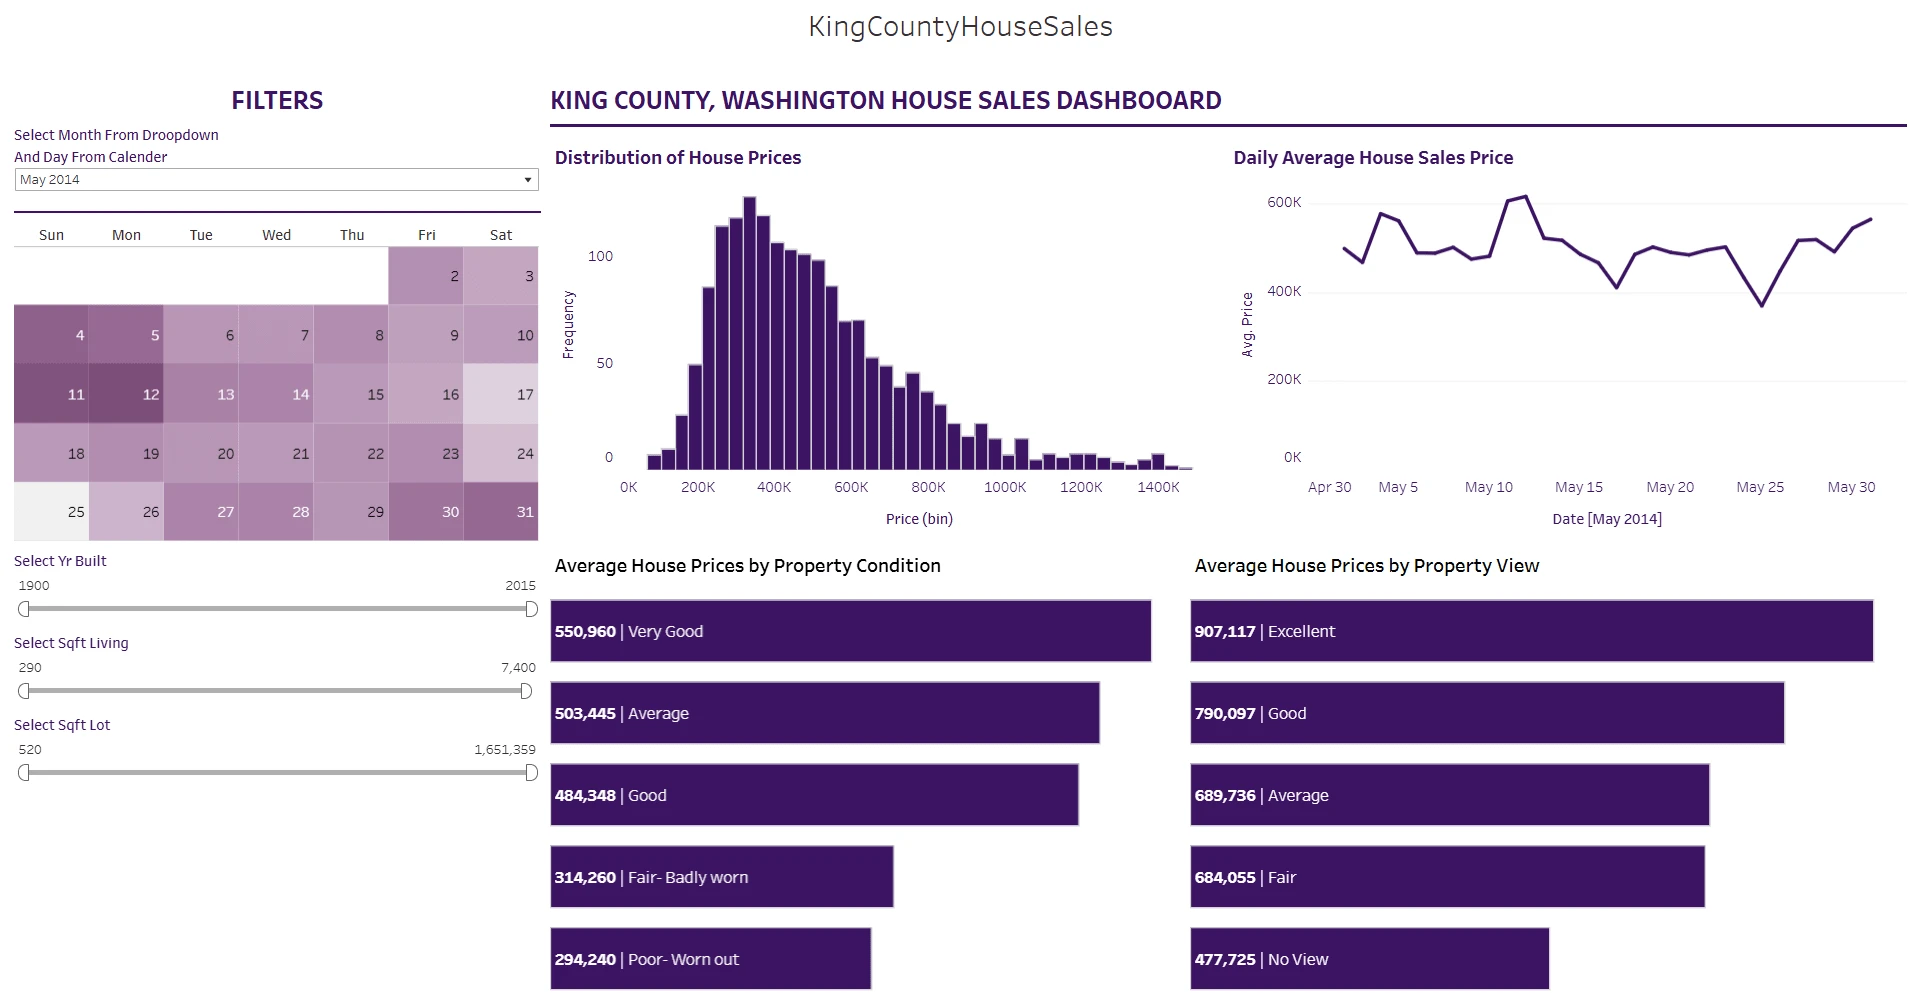
The King County House Sales Dashboard was designed to provide insights and improve market understanding. Key components included:
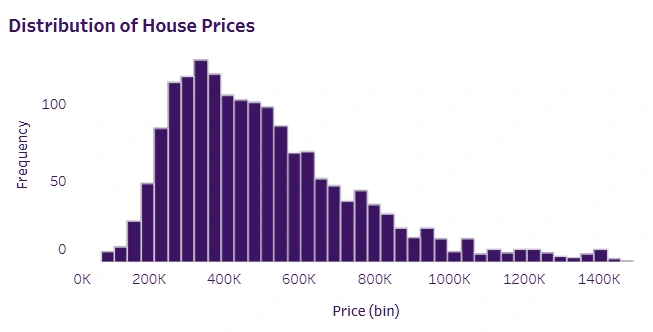
Distribution of House Prices: A visualization showing price ranges across King County to highlight affordability and luxury segments.
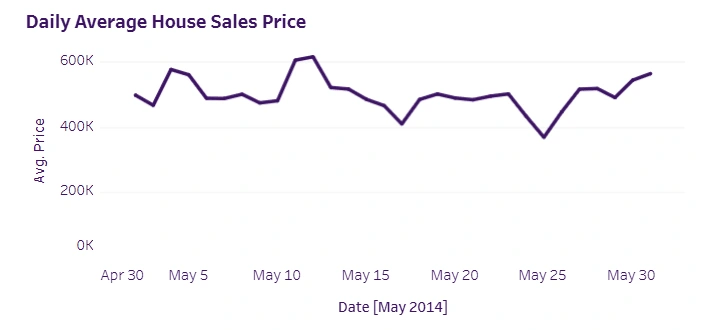
Daily Average House Sales Price: A time-series analysis showing daily trends, aiding in short-term market analysis.
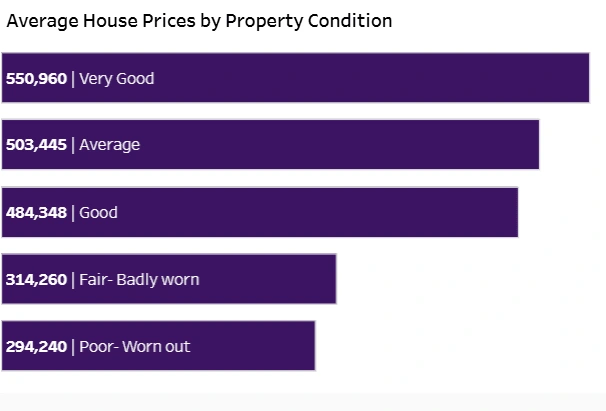
Average House Prices by Property Condition & Property View: Insights into how property quality and scenic views influence pricing.
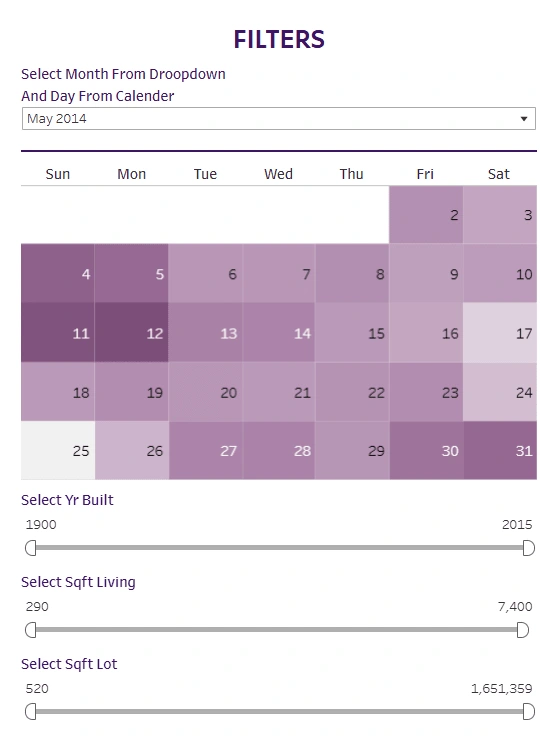
Interactive Filters: Dynamic options for users to select houses based on criteria like year built, square footage of living space, and lot size.
This dashboard aimed to provide realtors and buyers with actionable insights, improving market engagement and decision-making.
The Results: Impact on Market Understanding
The dashboard provided significant value:
Realtors could quickly identify pricing trends in different areas, enabling better client advice.
Insights on property conditions and views allowed buyers to understand value-added features better.
The interactive filters empowered users to explore specific property types, enhancing the buying experience.
Daily price trends supported market predictions, helping investors time their purchases or sales.
The result was a more transparent and user-friendly view of King County’s housing market, fostering thoughtful stakeholder decision-making.
Like this project
Posted Oct 18, 2024
The King County House Sales Dashboard is an interactive project designed to provide actionable insights into the real estate market of King County, Washington.