Freelance Data Analysts in Telangana
Sign Up
Post a job
Sign Up
Log In
Filters
2
Projects
People
Geethasree Naguboina
pro
Hyderabad, India
Excel & Data Analytics | Dashboards, KPI & Reporting
125
Followers
Follow
Message
Excel & Data Analytics | Dashboards, KPI & Reporting
4
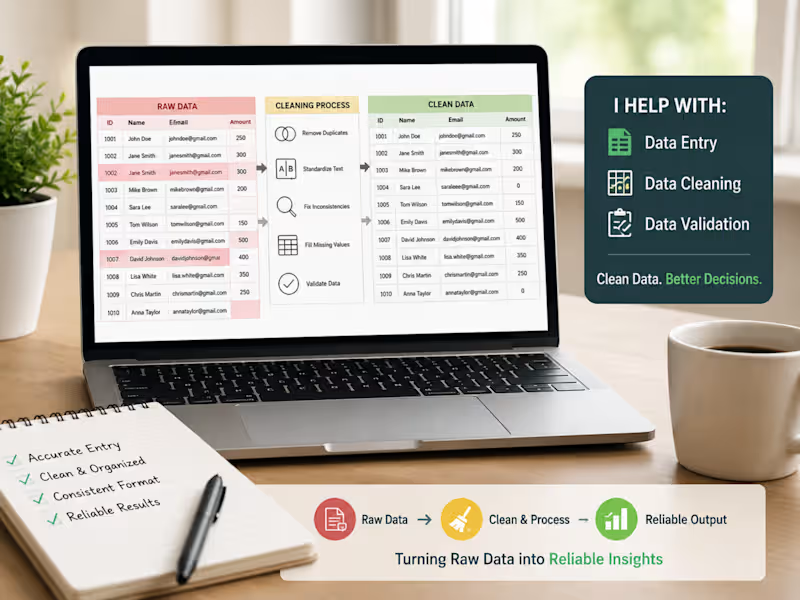
Clean Data. Better Decisions. Good data work starts with accuracy. I help organize, clean, and validate data so that spreadsheets and datasets are easier to use and trust. From data entry and formatting to identifying duplicates and inconsistencies, I focus on keeping every detail clear and consistent. Accuracy → Consistency → Reliable data.
4
4
783
1
Text Annotation for AI Training Data
1
24
3
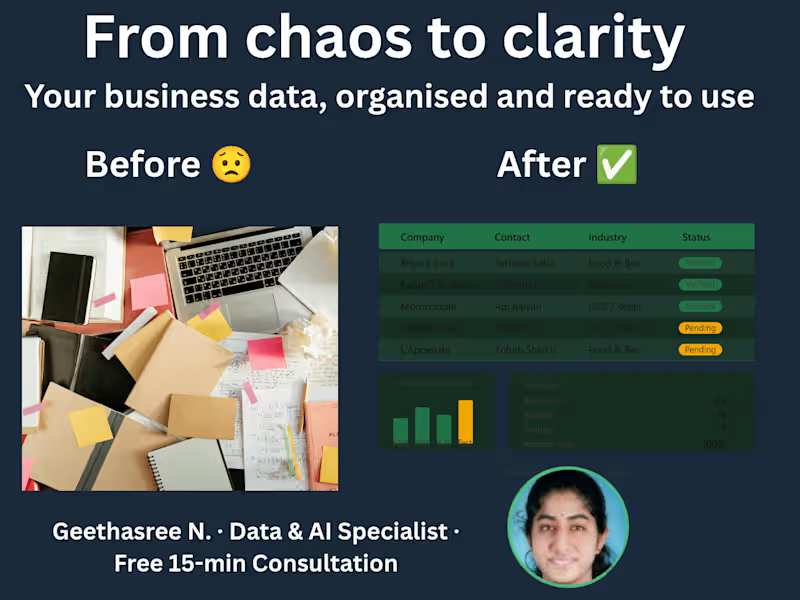
Most small business owners I talk to have the same problem — their data is scattered across WhatsApp messages, paper notes, and half-filled Excel sheets. They know something is wrong. They just don't know where to start. Here's what I do in the first 30 minutes of any project: ✅ Understand what data you have and where it lives ✅ Identify what's missing, duplicate, or inconsistent ✅ Suggest the simplest structure that works for your business No complicated tools. No jargon. Just clean, organised data you can actually use. If your business data feels messy and overwhelming — let's fix that together. Message me and we'll start with a free 15-minute consultation. 📊
3
299
3
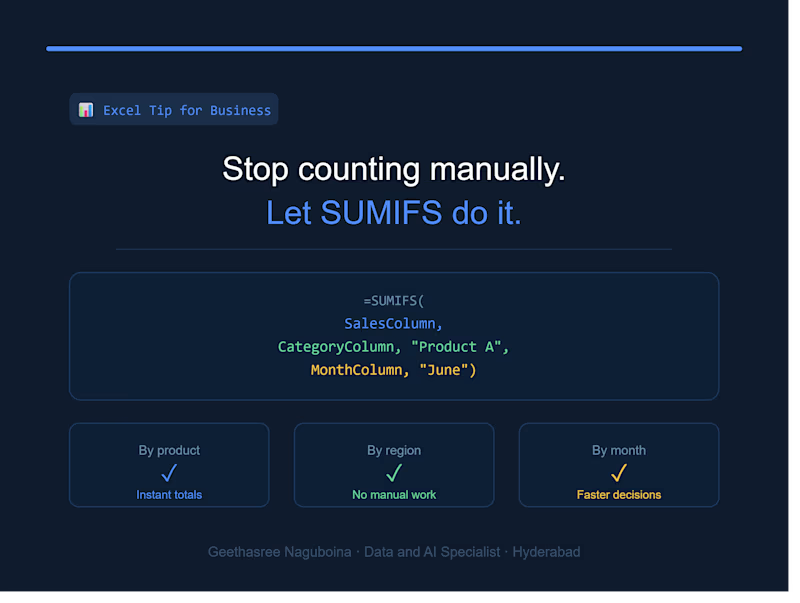
Spending hours manually totalling your sales data? SUMIFS does it in seconds. =SUMIFS(SalesColumn, CategoryColumn, "Category A", MonthColumn, "June") Instant totals by product, region, or month — no manual counting needed. Clean data = faster decisions = business growth. 📊
1
3
340
Data Analyst
(27)
Follow
Message
Rajaraman Arumugam
pro
Hyderabad, India
B2B SaaS Product Designer for AI & Complex Workflows
11
Followers
Follow
Message
B2B SaaS Product Designer for AI & Complex Workflows
0
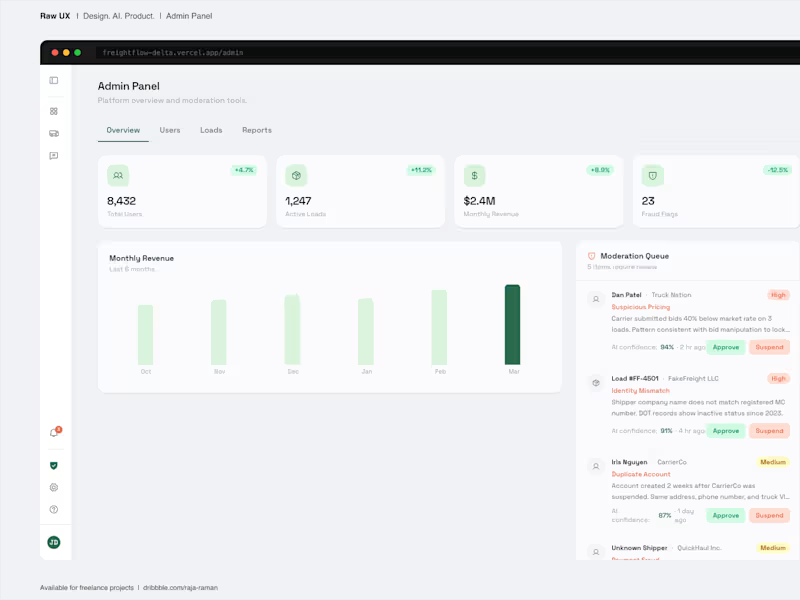
FreightFlow, admin panel - design.
0
9
0
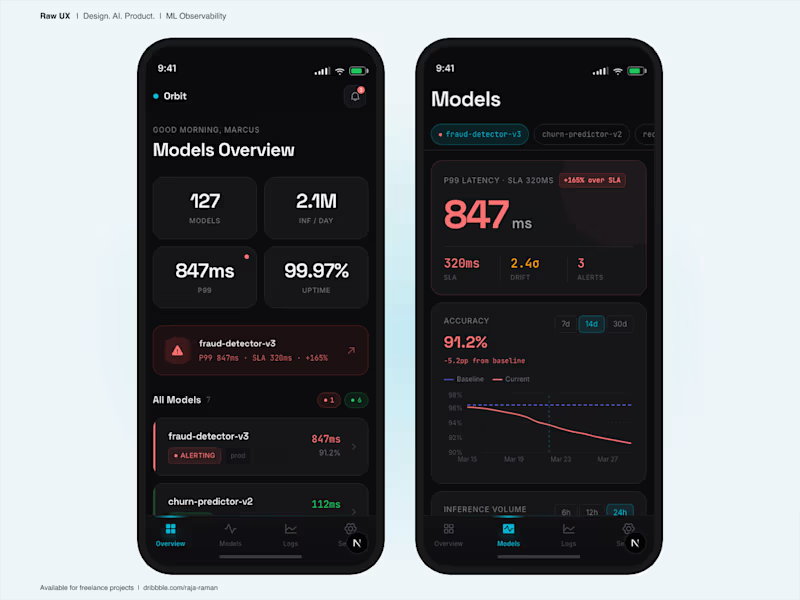
Orbit, ML monitoring on mobile. App design for ML teams.
0
6
0
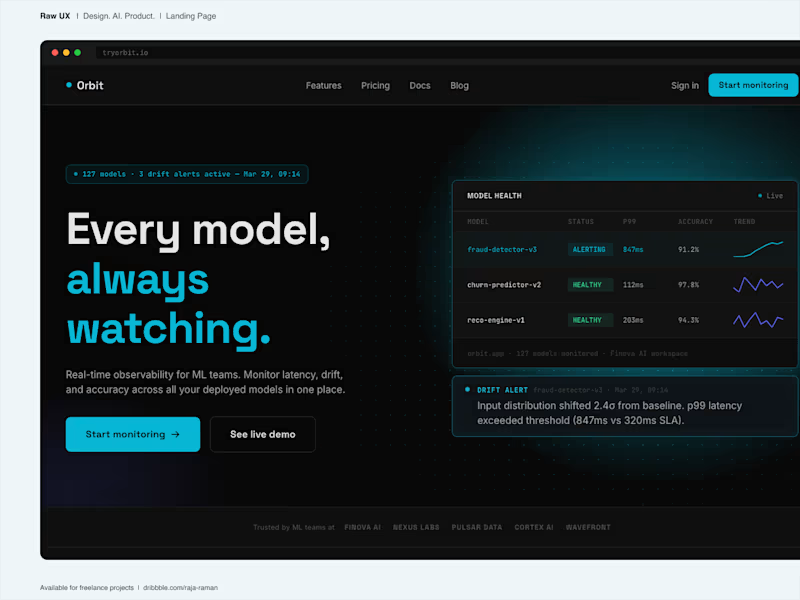
Orbit, ML model observability. Landing page design.
0
5
0
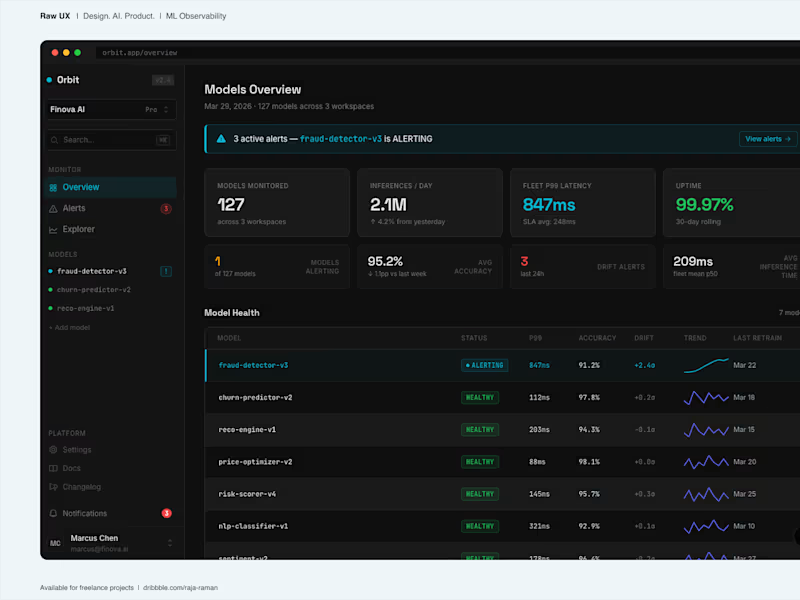
Orbit | ML model monitoring dashboard | Dark UI
0
5
Data Analyst
(4)
Follow
Message
KALYANA SREENIVASAN
Hyderabad, India
Power BI Expert | Excel Chaos to CEO Dashboards
New to Contra
Follow
Message
Power BI Expert | Excel Chaos to CEO Dashboards
0
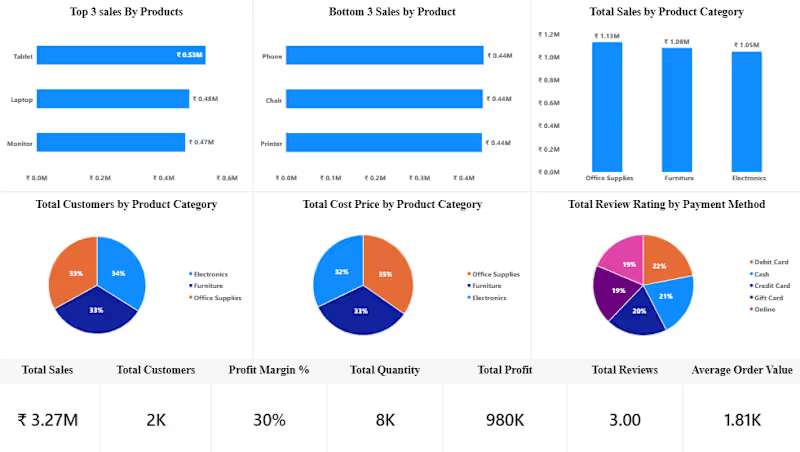
E-commerce Sales Analytics Dashboard - Power BI | ₹3.27M Revenue Tracking Client Problem: 2K customers, 8K orders in Excel. Owner had no idea which products actually make profit, which category drives customers. Dashboard Solution - 6 KPIs + 6 Visuals: Top 3 Sales: Tablet ₹0.53M | Laptop ₹0.48M | Monitor ₹0.47M Bottom 3 Sales: Phone, Chair, Printer - Clear underperformers to discount Sales by Category: Office Supplies ₹1.19M leads Furniture & Electronics Customer Mix: Electronics 34%, Office 33%, Furniture 33% - Balanced Cost Price by Category - 39% Office Supplies cost Review Rating by Payment: Credit Card 29% top, Debit 22% - Improve COD experience KPIs at Bottom: Total Sales ₹3.27M | Customers 2K | Margin 30% | Qty 8K | Profit 980K | AOV 1.81K | Rating 3.0 Impact: Client stopped pushing low-margin Phone/Chair, focused on Tablet/Office Supplies. Increased profit from 30% to 38% in 45 days Tools: Power BI, DAX, Sales Analytics For: E-commerce, Retail Stores, D2C Brands.
0
19
0
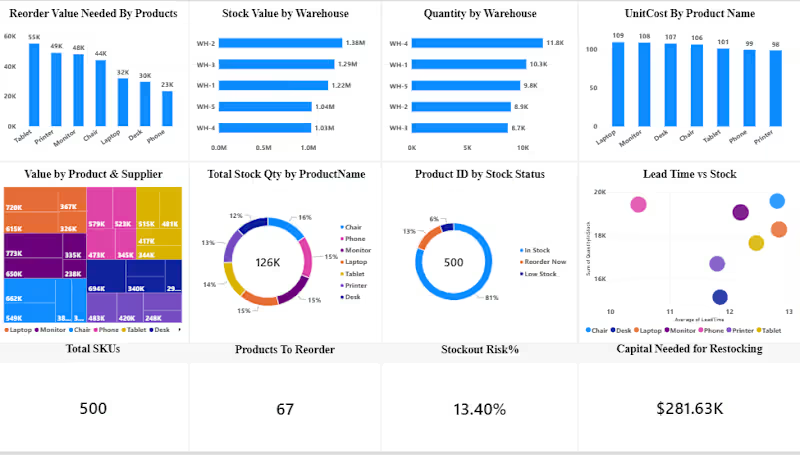
Supply Chain & Inventory Control Dashboard - Power BI | 126K Units | 500 SKUs Client Problem: E-commerce brand with 500 products across 6 warehouses. No visibility on what to reorder, stockout risk, or how much capital needed. What I Built - 8-Panel Command Center: Reorder Value by Product - Tablet $55K highest risk Stock Value by Warehouse - WH2 holds $1.38M (overstocked) Quantity by Warehouse - WH4 11.8K units Value by Product & Supplier - Full matrix to negotiate better rates Stock Status: 81% In Stock, 13% Low Stock, 6% Reorder Now Lead Time vs Stock - Visual alert for delayed suppliers KPIs: Total SKUs 500 | To Reorder 67 | Stockout Risk 13.40% | Capital Needed $281.63K Business Impact: Client prevented $281K in lost sales. Reduced stockout from 13.4% to 3% in 30 days. Clear reorder list daily - no manual Excel counting. Stack: Power BI, DAX, Supply Chain Analytics, Excel Timeline: 3 Days | Best for: E-commerce, Retail, Warehouse Ops
0
23
0
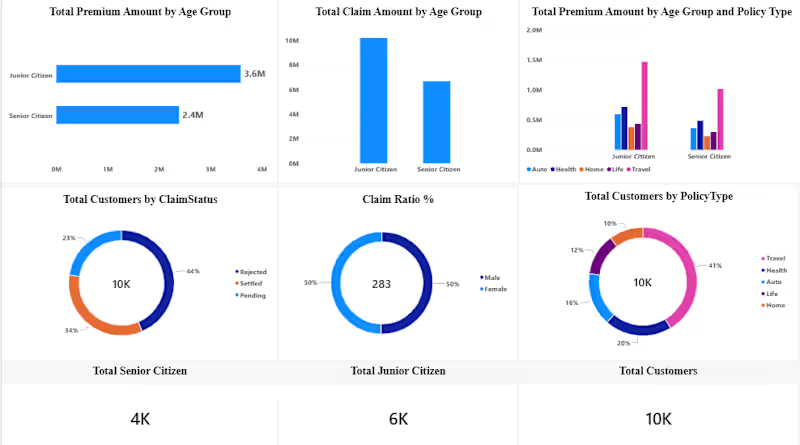
Insurance Portfolio Dashboard - Power BI | $5M Premium Tracking Client Problem: Insurance agency tracking 10K policies in Excel - no clarity on which age group claims more, which policy type is profitable. Dashboard I Built: Premium vs Claim Analysis by Age Group (Junior 6K vs Senior 4K) Claim Status Breakdown: 44% Settled, 34% Pending, 22% Rejected Claim Ratio % by Gender Customers by Policy Type: Travel 41%, Auto 20%, Home 16%, Health 12%, Life 11% KPIs: Total Customers 10K | Senior 4K | Junior 6K | Premium 5M Business Impact: Client found Senior Citizens claim 2x more vs Junior, and Travel policy is top seller. Helped them re-price premiums and save $50K in risk. Tools: Power BI, DAX, Data Modelling, Excel Timeline: 2 Days | For: Insurance Brokers / Agencies.
0
29
0
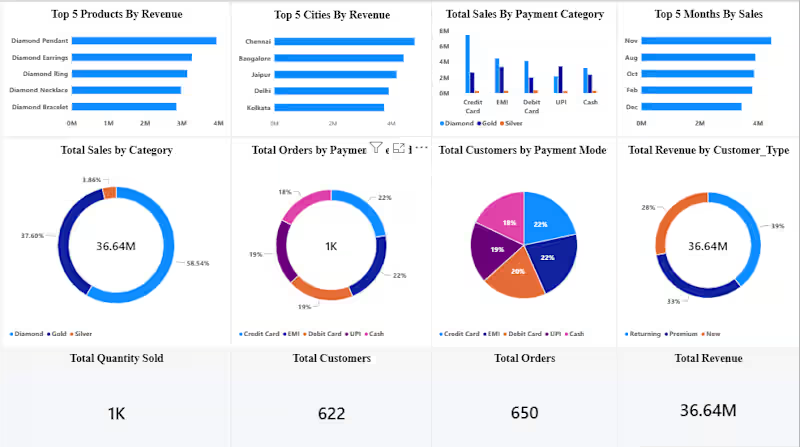
Jewellery E-commerce Sales Dashboard - Power BI | 36.64M Revenue The Problem: Client had sales data scattered across Excel - couldn't see which product, city, or payment mode drives revenue. What I Built: Single CEO dashboard with: • Top 5 Products & Cities by Revenue • Sales by Category (Diamond, Gold, Silver) • Payment Analysis (Credit, EMI, UPI, Cash) • Customer Type - Returning vs New • KPIs: 1K orders | 622 customers | 36.64M revenue The Result: Owner now sees best-selling Diamond Pendant & Chennai as top city in 5 seconds. No more manual Excel. Stack: Power BI, DAX, Power Query, Excel Timeline: 2 days
0
38
Data Analyst
(4)
Follow
Message
Yedla Naga Sathvik
Hyderabad, India
Analyst Analysing business solutions
Follow
Message
Analyst Analysing business solutions
0
Walmart Sales Data Analysis
0
6
1
Walmart Sales Data Analysis
1
5
0
Sathvik2023/Amazon-Product-Sales-Analysis
0
3
View more →
Data Analyst
(3)
Follow
Message
Shaik Nawaz
Hyderabad, India
AI Engineer | Data Scientist | Machine Learning | Python |
Follow
Message
AI Engineer | Data Scientist | Machine Learning | Python |

0
Credit-Card-Fraud-Detection
0
5
0
News Summarization & Hindi TTS Application
0
7
0
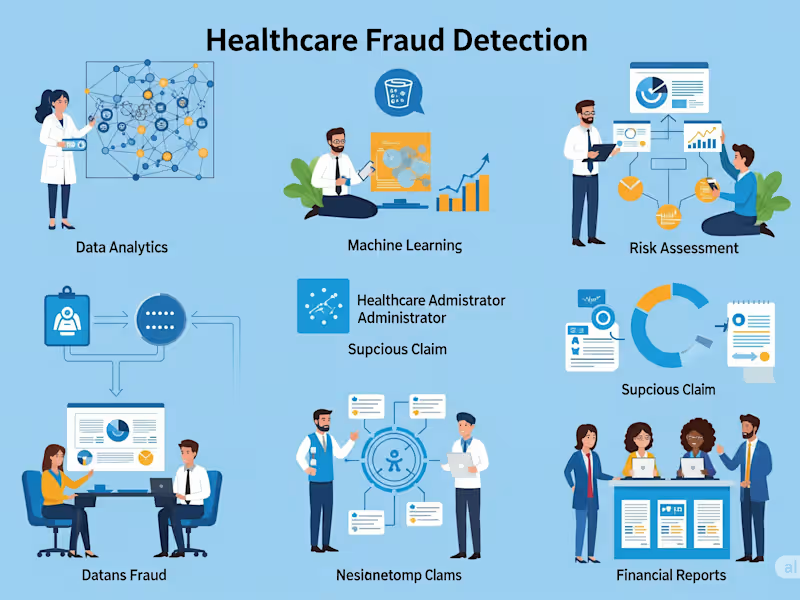
Healthcare Provider Fraud Detection
0
6
View more →
Data Analyst
(3)
Follow
Message
Hariom Hatwate
Hyderabad, India
Full Stack web development
New to Contra
Follow
Message
Full Stack web development
0
I will build an AI chatbot that can understand your documents, knowledge base, or business information and provide relevant answers. Possible use cases: • Company knowledge assistants • PDF/document chat • Customer-support assistants • Internal knowledge bases • Educational assistants • FAQ systems • RAG-based AI applications Depending on the requirements, I can work with LLM APIs, embeddings, vector databases, retrieval pipelines, and custom application interfaces. The final scope, model, integrations, and deployment requirements will be agreed before development.
0
46
0
I will analyze your dataset and turn it into meaningful insights, visualizations, or an interactive dashboard. I can help with: • Data cleaning • Exploratory data analysis • Statistical summaries • Data visualization • KPI dashboards • Python/Pandas analysis • Interactive Streamlit dashboards • Business insights and reporting You’ll receive the completed analysis, visualizations, and relevant source files.
0
39
0
I provide end-to-end AI, Python, and Full-Stack development services tailored to your business or project requirements. Whether you're a startup, entrepreneur, student, or organization, I can transform your ideas into scalable, efficient, and user-friendly digital solutions. My expertise includes Artificial Intelligence, Machine Learning, Python development, Full-Stack Web Development, Data Analytics, Automation, Dashboard Development, API Integration, Database Design, and Responsive Web Applications. I build secure, maintainable, and high-performance applications using modern technologies such as Python, React.js, Node.js, JavaScript, SQL, HTML, CSS, Streamlit, and REST APIs. Services I Offer: AI & Machine Learning Applications Custom Python Scripts & Automation Full-Stack Web Development Data Analytics & Interactive Dashboards REST API Development & Integration Database Design & Management Bug Fixing & Code Optimization Responsive UI Development AI Chatbots & Intelligent Assistants Computer Vision & Image Processing Solutions Every project is developed with clean, scalable architecture, optimized performance, and industry best practices. I prioritize clear communication, regular progress updates, on-time delivery, and long-term maintainability. My goal is not only to complete your project successfully but also to provide reliable, high-quality solutions that create measurable value and exceed your expectations. Client satisfaction, professionalism, and attention to detail are my highest priorities.
0
45
1
I will build a functional AI-powered application based on your idea, business requirement, or workflow. What I can build: • AI assistants and chatbots • LLM-powered applications • AI automation tools • Document intelligence systems • AI dashboards • RAG applications • AI-powered MVPs and prototypes Deliverables: • Functional application • Clean and maintainable code • API/model integration • Basic documentation • Deployment guidance where applicable Before starting, I’ll clarify your requirements, expected functionality, preferred technology, and delivery timeline so the scope is clearly defined.
1
60
Data Analyst
(3)
Follow
Message
Mujtaba Quadri
Hyderabad, India
Data Analyst | SQL • Python • Excel • Power BI • Tableau
Follow
Message
Data Analyst | SQL • Python • Excel • Power BI • Tableau
1
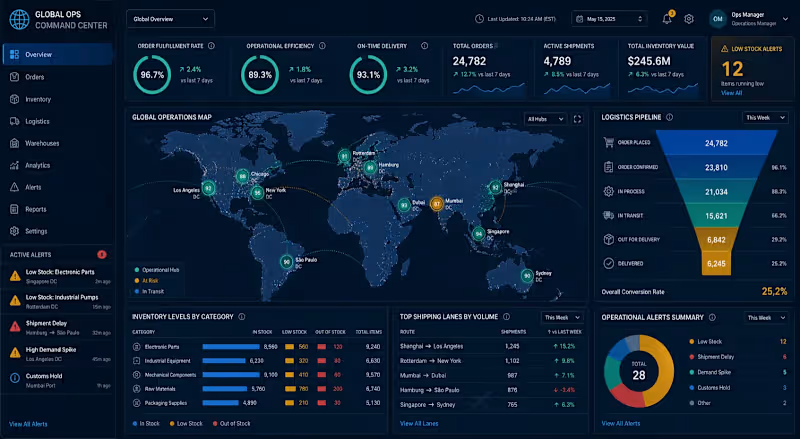
This Project Focused On The Architecture Of A Dynamic Operational Command Center Designed To Optimize Global Supply Chain Logistics And Inventory Management. By Integrating Multi-Source Data Streams Using Advanced SQL Querying, The System Provides Real-Time Visibility Into Key Performance Indicators Such As Order Fulfillment Latency, Inventory Turnover Ratios, And Regional Delivery Success Rates. Utilizing Sophisticated Data Visualization Techniques, The Dashboard Empowers Stakeholders To Identify Logistics Bottlenecks And Streamline Warehouse Operations. The Implementation Of Automated Trend Analysis Facilitated A Significant Reduction In Stock-Out Incidents And Enhanced Overall Operational Efficiency By Providing Granular Insights Into The End-To-End Supply Chain Lifecycle.
1
87
1
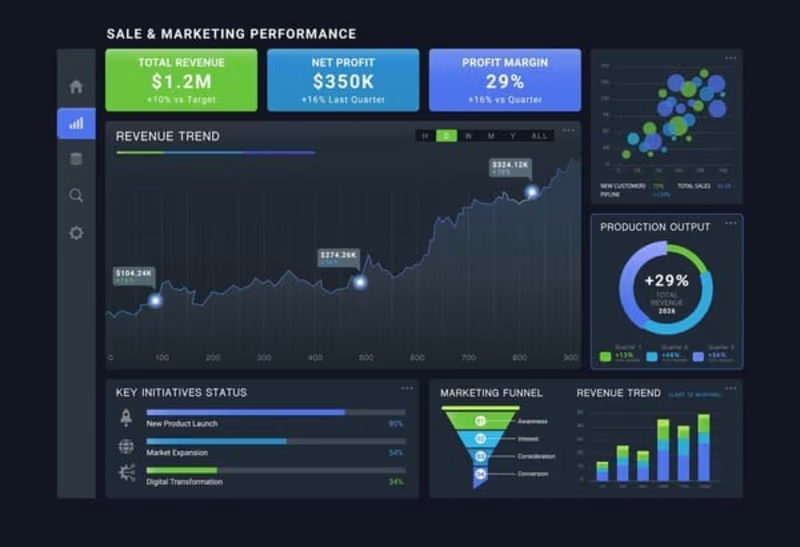
"I Designed A Comprehensive Sales Performance Dashboard To Track Key Business Metrics Across Multiple Regions. By Integrating Raw Data Into A Dynamic Visual Interface, I Provided Leadership With Real-Time Insights Into Profit Margins, Regional Growth, And Product Performance, Enabling Data-Driven Strategy Decisions That Optimized Inventory Allocation."
1
107
1
"I Developed A SQL-Driven Monitoring System For A Global Supply Chain Network. By Writing Complex Queries To Analyze Inventory Levels Across Multiple International Warehouses, I Created An Automated Flagging System For Low-Stock Items. This Project Demonstrates My Ability To Handle Large-Scale Relational Databases And Provide Actionable Logistics Insights."
1
118
1
"I Developed An Automated Python Pipeline To Process And Categorize Over 1,000 Customer Reviews. Using The Pandas Library, I Built A Logic-Based Scoring System That Translates Raw Text Into Actionable Sentiment Insights, Helping Product Teams Identify Critical Issues In Real-Time."
1
113
Data Analyst
(5)
Follow
Message
Varshith Gaddam
Hyderabad, India
AI/ML student building smart, real-world tech solutions.
Follow
Message
AI/ML student building smart, real-world tech solutions.
0
Stock Analysis Project with AutoGen
0
8
0
Paisa Controller: AI-Powered Finance Management App
0
7
0
Voice-Based Cognitive Decline Pattern Detection
0
15
View more →
Data Analyst
(1)
Follow
Message
Explore people