The network for creativity
Join 1.25M professional creatives like you
Connect with clients, get discovered, and run your business 100% commission-free
Creatives on Contra have earned over $150M and we are just getting started
Back to feedPost

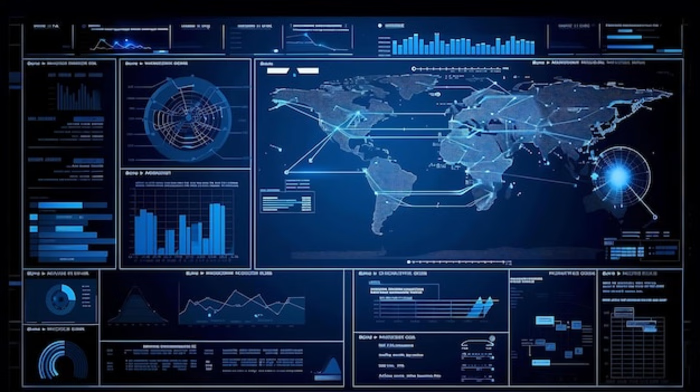
"I Developed A SQL-Driven Monitoring System For A Global Supply Chain Network. By Writing Complex Queries To Analyze Inventory Levels Across Multiple International Warehouses, I Created An Automated Flagging System For Low-Stock Items. This Project Demonstrates My Ability To Handle Large-Scale Relational Databases And Provide Actionable Logistics Insights."


The network for creativity
Join 1.25M professional creatives like you
Connect with clients, get discovered, and run your business 100% commission-free
Creatives on Contra have earned over $150M and we are just getting started





Related posts

The client's inventory wasn't organized. Products weren't consistently recorded, there was no SKU structure, and the system's stock figures didn't match what was physically on the shelves. That made it hard to know what they really had, what it was worth, and what their cost of sales should be.
What I did
Chose the right tool. I recommended QuickBooks Plus, which handles inventory tracking properly, rather than patching up spreadsheets.
Built the product list. I added every product to the system and allocated a clear SKU to each one.
Sorted the inventory. I organized the stock records so each item could be identified and tracked.
Reconciled to a physical count. I compared the system quantities with the actual stock on hand and resolved the differences.


"We can't afford a data analyst."
I've heard this from 3 different startups this year.
So I built one.
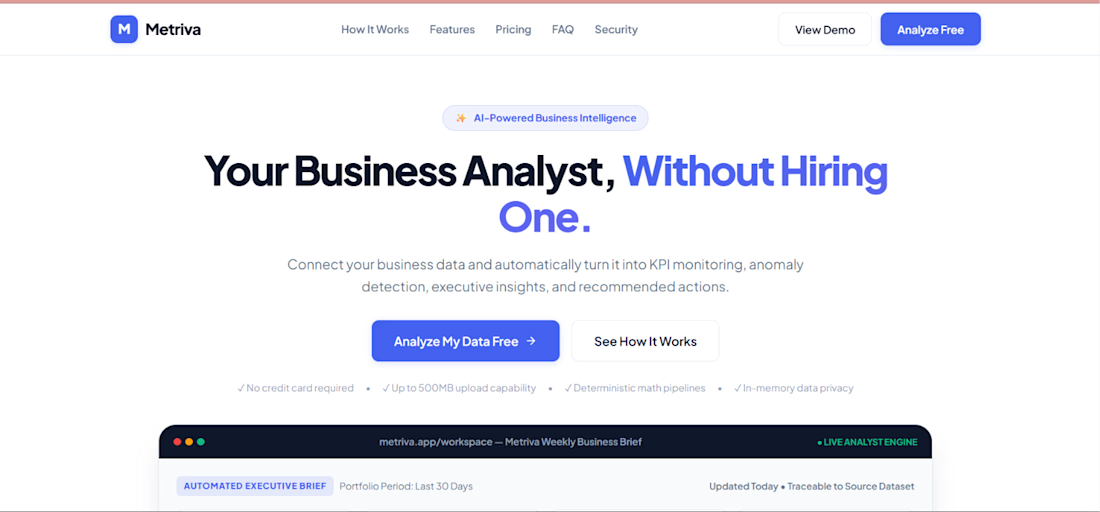
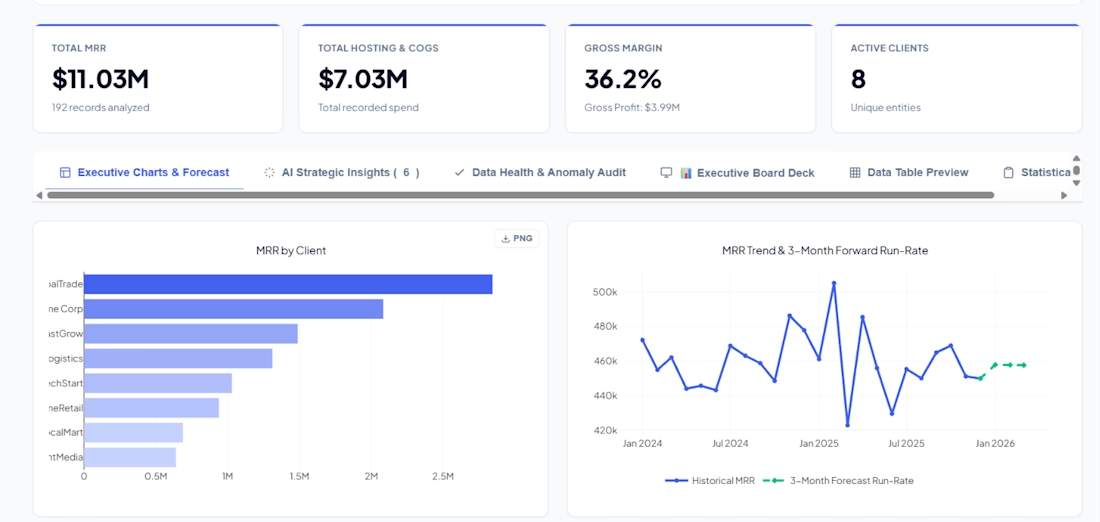
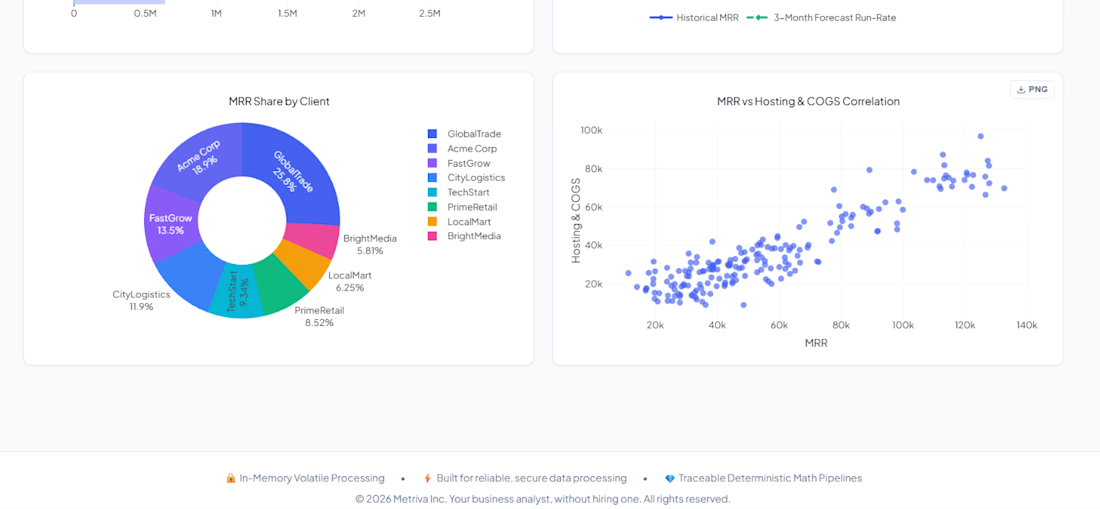
Metriva is an AI-powered business analyst that:
📊 Turns messy spreadsheets into executive dashboards
🧠 Writes C-level business briefs automatically
📈 Forecasts trends + detects anomalies
💬 Answers questions about your data in plain English
🎯 Finds your Pareto 80/20 — who drives 80% of your revenue?
No SQL. No Python. No data team.
Just upload your file and get answers.
Built with Flask, vanilla JS, and a lot of late nights.
🔗 Try it: metriva.ai1.vercel.app
#AI #BusinessIntelligence #Founder #IndieHacker #DataScience

The brief-writing piece is interesting — curious how you handle the validation step. AI-generated language tends to sound confident even when the underlying data is sparse or the trend is ambiguous. One pattern that helps: have the model output a confidence signal alongside the...

Pharmacy Operations System: an automation-focused prototype for managing inventory, sales, purchases, and pharmacy operations. Built with a web dashboard connected to Google Sheets and n8n workflows to automate data updates and operational processes.


I'd keep sales, purchases, and manual stock corrections as separate events in the dashboard. If today's balance is disputed, can a user trace it back to a specific change rather than only seeing the latest value in Sheets?