The network for creativity
Join 1.25M professional creatives like you
Connect with clients, get discovered, and run your business 100% commission-free
Creatives on Contra have earned over $150M and we are just getting started
Back to feedPost

Power BI Project Description🩻
Sales Performance Dashboard | Power BI🙌
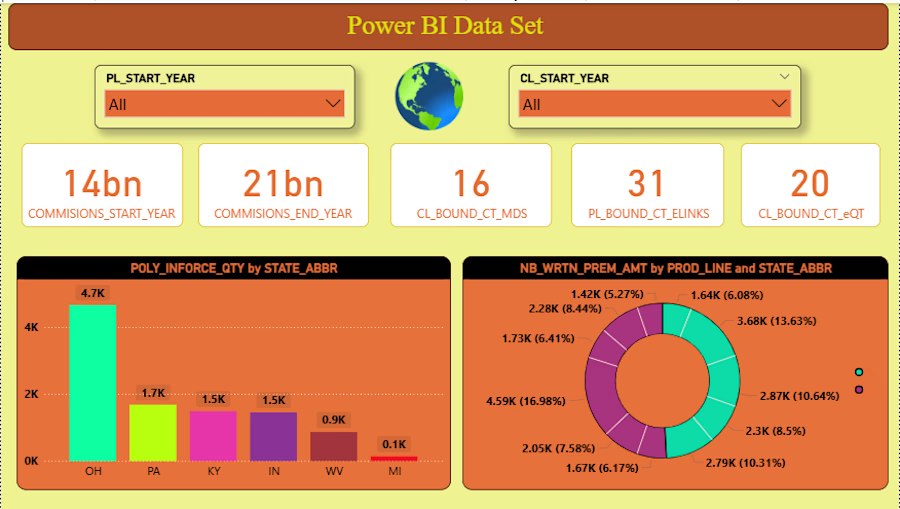
Developed an interactive Power BI dashboard to analyze sales performance, customer behavior, and business KPIs. The solution transforms raw data into actionable insights through dynamic visualizations and automated reporting.
Key Features:
Interactive KPI cards for Revenue, Inforce Policy Orders, and Growth
Sales analysis by State, Product Category, and Policy Segment
Dynamic slicers and drill-through functionality
Year-over-Year (YoY) performance tracking
Profitability and trend analysis using DAX measures
Data modeling with relationships and star schema design
Automated data refresh and optimized report performance
Tools & Technologies:
Power BI Desktop
Power Query
DAX
SQL / Excel Data Sources
Data Modeling & Visualization
Skills Tags🔥
Power BI • DAX • Power Query • Data Visualization • Business Intelligence • Dashboard Design • SQL • Data Analytics


The network for creativity
Join 1.25M professional creatives like you
Connect with clients, get discovered, and run your business 100% commission-free
Creatives on Contra have earned over $150M and we are just getting started



Related posts


Great stuff! Would love to know what the brief looked like. You clearly took it somewhere special.

📊 Power BI Performance Tracker Dashboard
Turning raw data into meaningful insights!
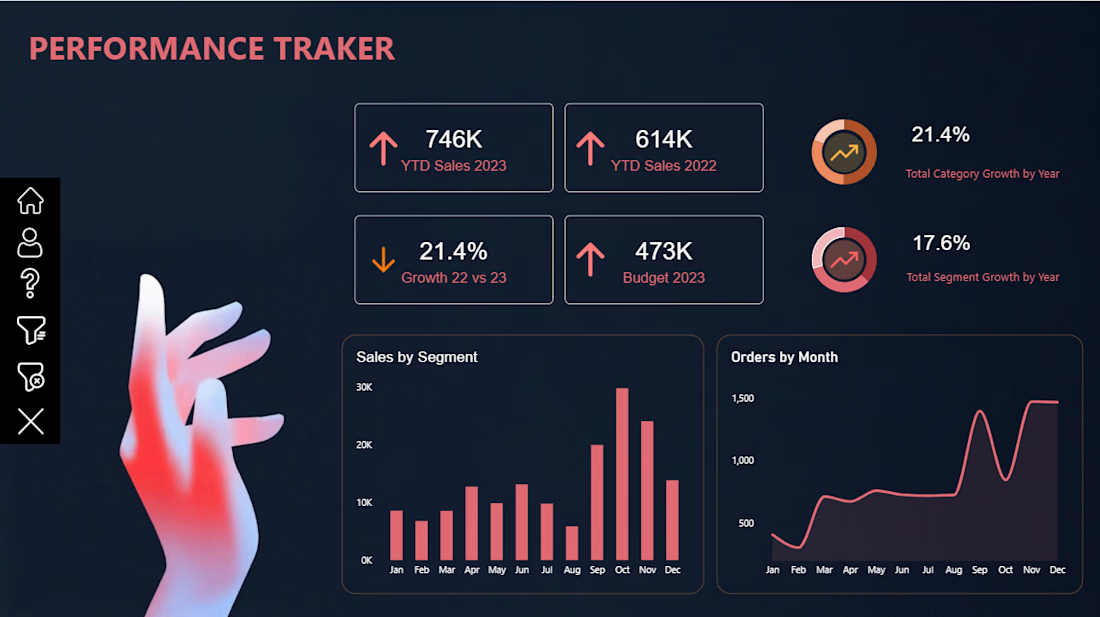
I’m excited to share my latest Power BI Dashboard-Performance Tracker, designed to provide a clear and interactive view of business performance.
Key Features:
📈 YTD Sales Performance (2022 vs. 2023)
🎯 Budget vs. Actual Sales Analysis
📊 Sales Growth & Performance KPIs
🗂️ Sales Analysis by Segment
📅 Monthly Order Trends
📉 Category & Segment Growth Analysis
Tools Used: Microsoft Power BI | Data Visualization | Dashboard Design
My goal was to create a clean, modern, and visually engaging dashboard that makes complex business data easier to understand and supports better decision-making.
Always learning, building, and transforming data into insights!
#PowerBI #DataAnalytics #DataVisualization #BusinessIntelligence #DashboardDesign #MicrosoftPowerBI #DataAnalyst #Contra
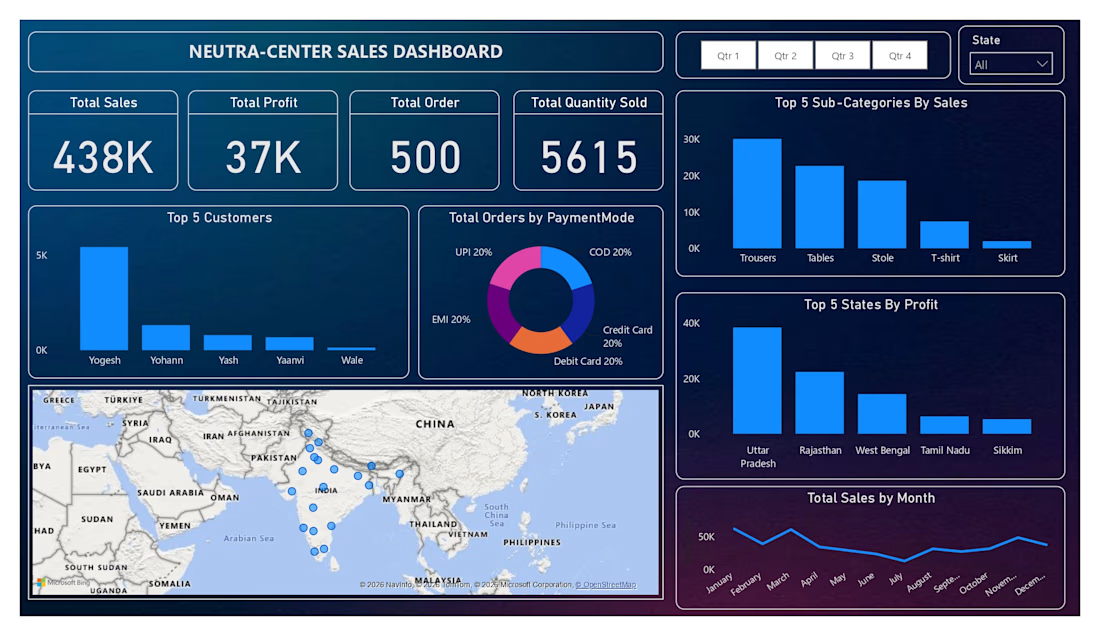
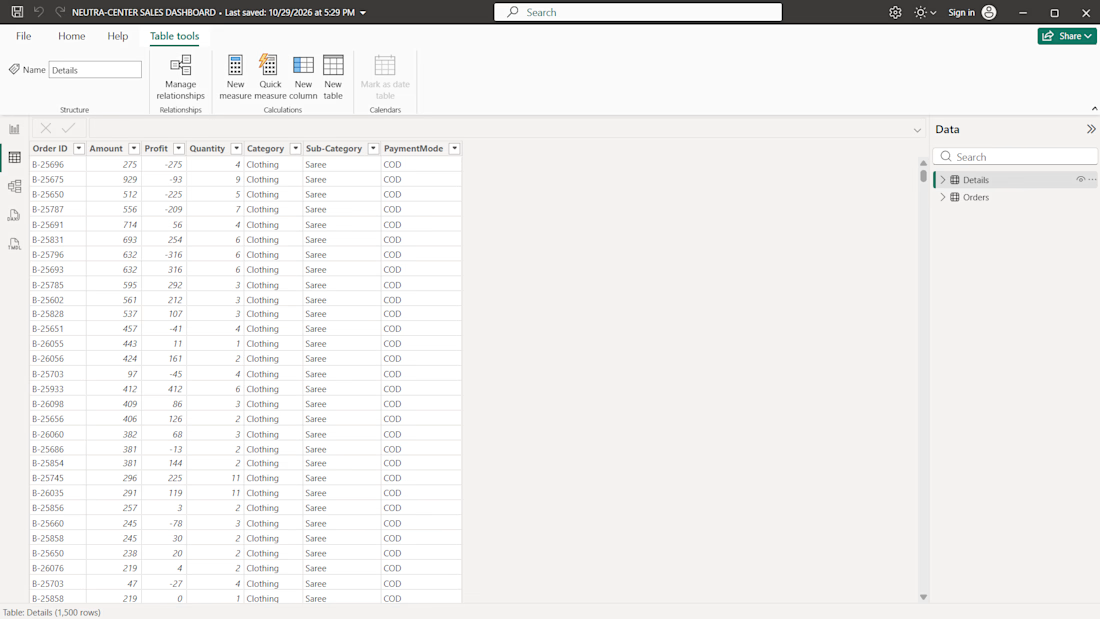
I created an interactive "Neutra-Center Sales Dashboard using Microsoft Power BI" to transform sales excel data into clear, meaningful business insights.
Key Features:
- Interactive quarterly and state filters
- Sales and profit KPI cards
- Customer and product performance analysis
- Payments method distribution
- State-wise profit coparison
- Monthly sales trend visualization
- Geographic sales distribution map
- Clean, modern dashboard design
This project demonstrates my ability to present sales data in an organized, interactive, and visually appealing format to help user understand business performance and identify important trends.