The network for creativity
Join 1.25M professional creatives like you
Connect with clients, get discovered, and run your business 100% commission-free
Creatives on Contra have earned over $150M and we are just getting started
Back to feedPost

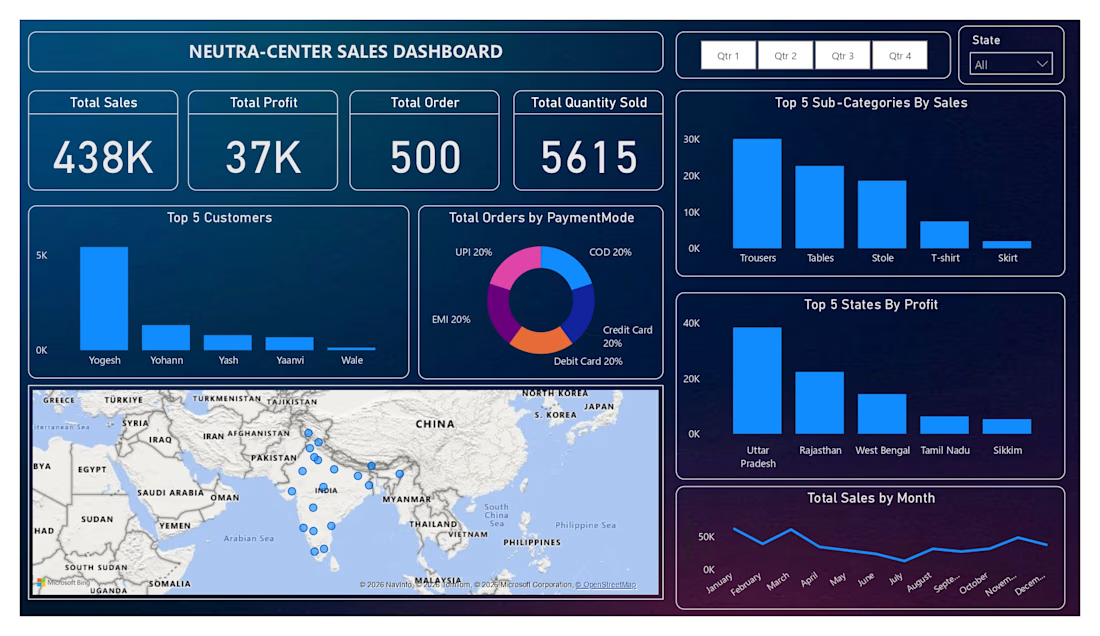
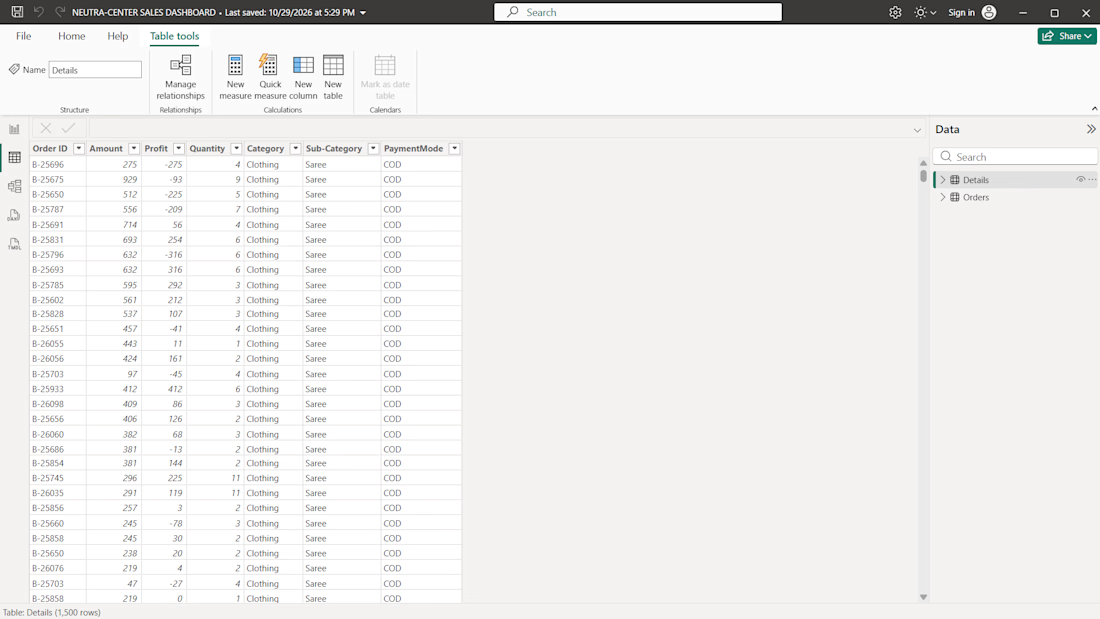
I created an interactive "Neutra-Center Sales Dashboard using Microsoft Power BI" to transform sales excel data into clear, meaningful business insights.
Key Features:
- Interactive quarterly and state filters
- Sales and profit KPI cards
- Customer and product performance analysis
- Payments method distribution
- State-wise profit coparison
- Monthly sales trend visualization
- Geographic sales distribution map
- Clean, modern dashboard design
This project demonstrates my ability to present sales data in an organized, interactive, and visually appealing format to help user understand business performance and identify important trends.


The network for creativity
Join 1.25M professional creatives like you
Connect with clients, get discovered, and run your business 100% commission-free
Creatives on Contra have earned over $150M and we are just getting started



Related posts

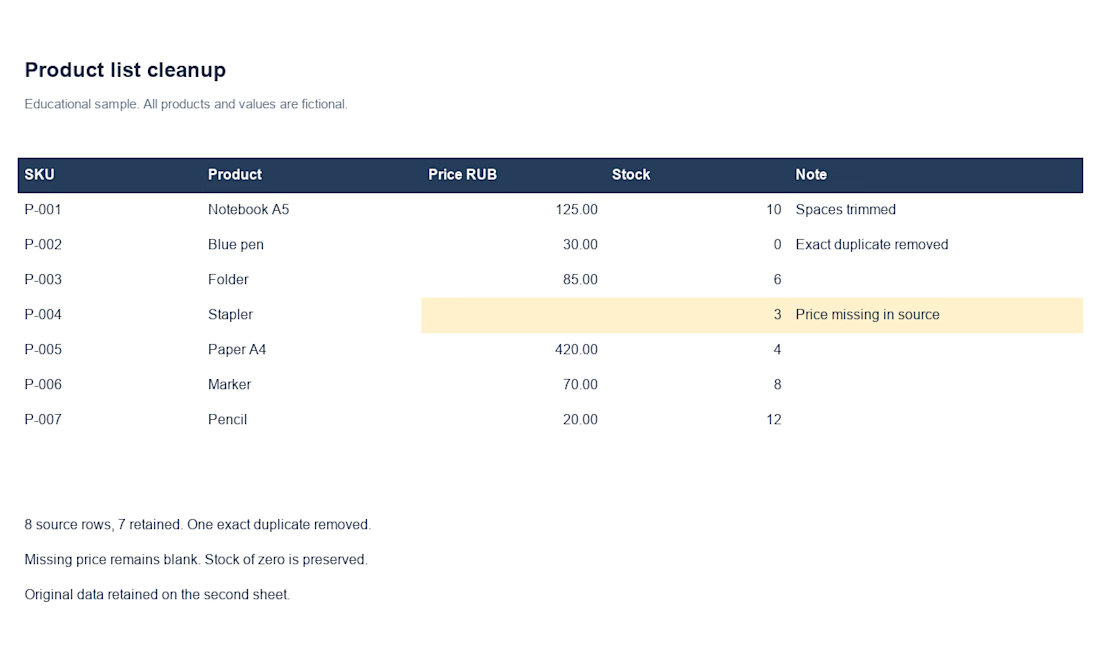
A personal Excel/CSV data-cleaning demo: 8 fictional input rows become 7 after removing one exact duplicate. Zero stock is preserved; a missing price stays blank and is flagged. The original data is retained for comparison. This is a self-initiated example, not client work.
I can help with Excel/CSV cleaning, reconciliation and clear reports. We agree scope, price and delivery after reviewing a sample. First project: 50% off the agreed regular quote, with no future-order commitment.

Great approach to data cleaning! Preserving the original data while flagging missing values and removing only exact duplicates helps maintain accuracy and transparency. These small checks can make a big difference in reliable reporting.

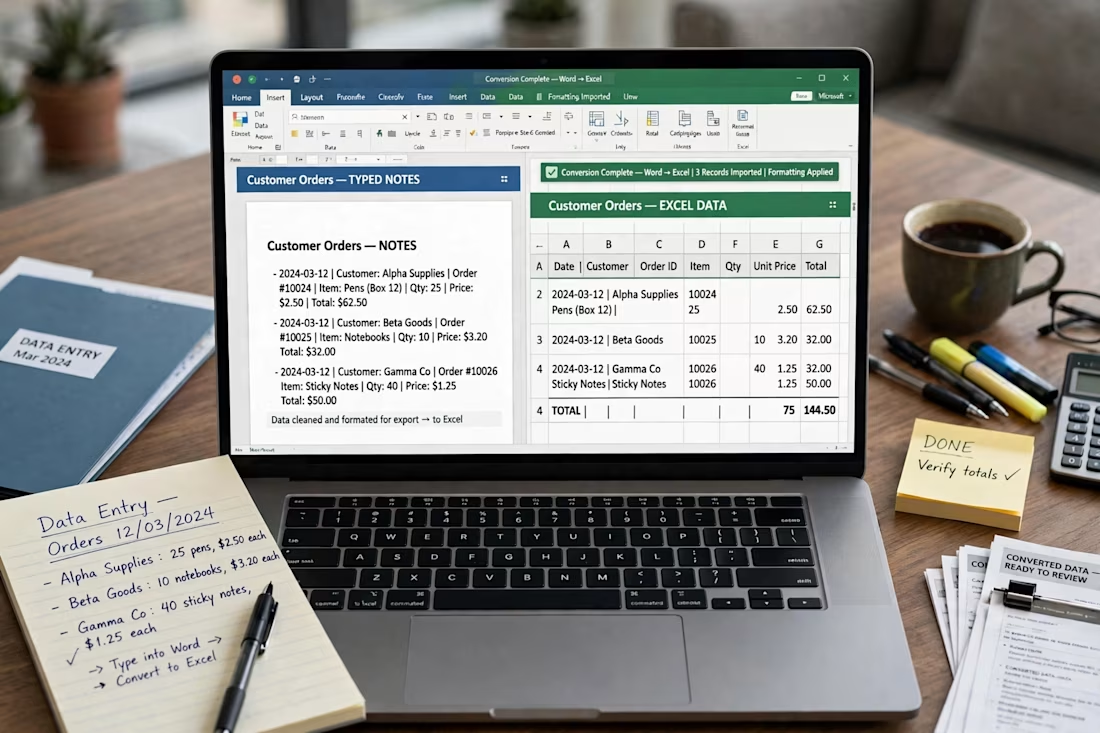
Handwritten Notes to Excel Conversion
Ty or d and converted handwritten customer orders into a structured Excel sheet. Included date, customer name,order ID, quantity and total calculations. ensured 100% accuracy. Tools:Excel ,Data Entry.



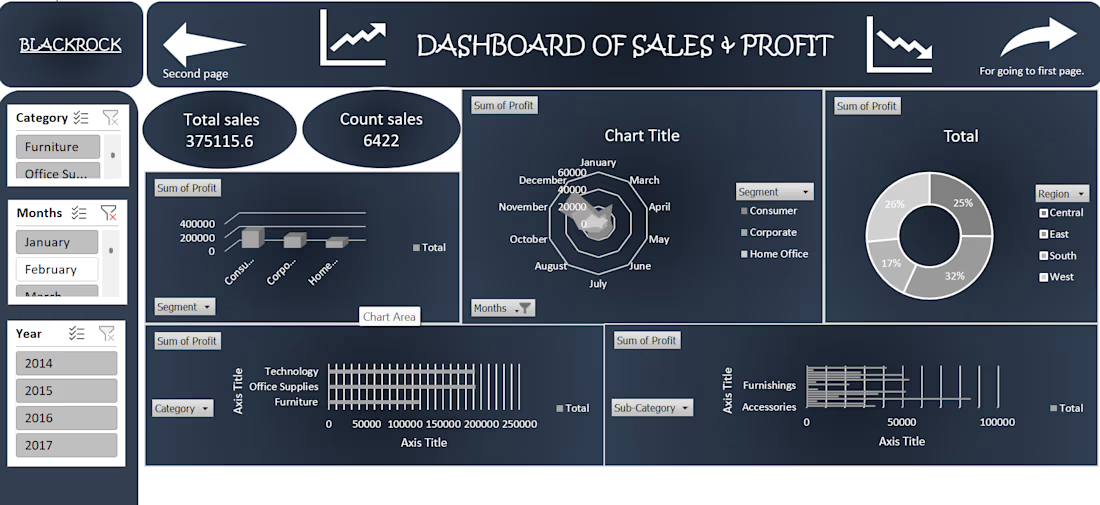
I: just created a Sales and Profit dashboard! Designed to provide a clear overview of business performance, tracking total sales, order count, and profit distribution across region and product categories. Includes interactive filters by year, category, and month for detailed data analyst.