The network for creativity
Join 1.25M professional creatives like you
Connect with clients, get discovered, and run your business 100% commission-free
Creatives on Contra have earned over $150M and we are just getting started
Back to feedPost

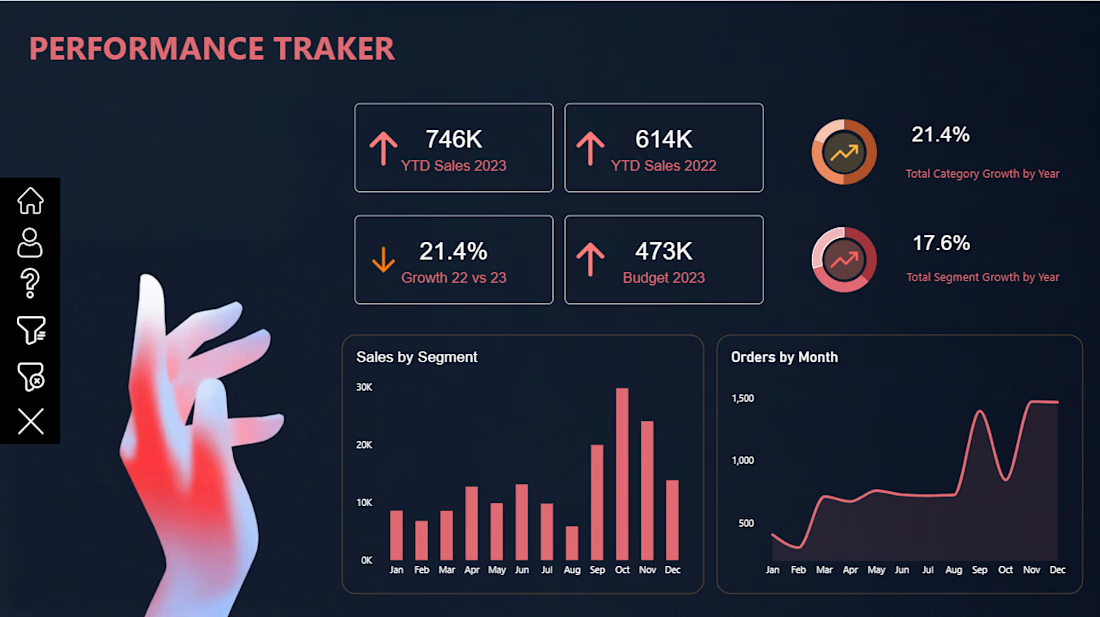
📊 Power BI Performance Tracker Dashboard
Turning raw data into meaningful insights!
I’m excited to share my latest Power BI Dashboard-Performance Tracker, designed to provide a clear and interactive view of business performance.
Key Features:
📈 YTD Sales Performance (2022 vs. 2023)
🎯 Budget vs. Actual Sales Analysis
📊 Sales Growth & Performance KPIs
🗂️ Sales Analysis by Segment
📅 Monthly Order Trends
📉 Category & Segment Growth Analysis
Tools Used: Microsoft Power BI | Data Visualization | Dashboard Design
My goal was to create a clean, modern, and visually engaging dashboard that makes complex business data easier to understand and supports better decision-making.
Always learning, building, and transforming data into insights!
#PowerBI #DataAnalytics #DataVisualization #BusinessIntelligence #DashboardDesign #MicrosoftPowerBI #DataAnalyst #Contra


The network for creativity
Join 1.25M professional creatives like you
Connect with clients, get discovered, and run your business 100% commission-free
Creatives on Contra have earned over $150M and we are just getting started



Related posts

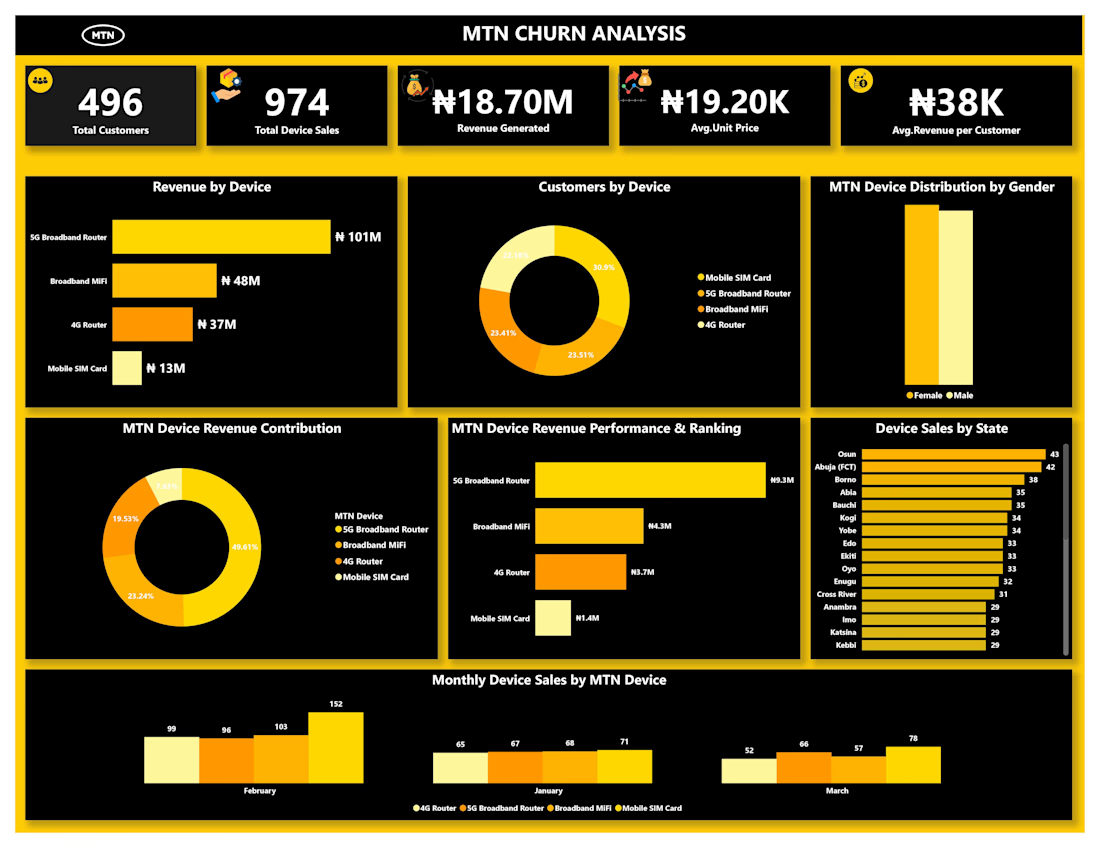
Why do customers leave, and what can businesses do to reduce customer churn?
This is the question I explored in my MTN Customer Churn Analysis project, a personal project I built to strengthen my data analytics skills and showcase my work in my portfolio.
Using Power BI, I developed an interactive dashboard to analyze customer behavior, revenue performance, device sales, customer satisfaction, and churn patterns.
Some key findings from my analysis include:
📊 29.16% customer churn rate
💰 ₦5.28M in revenue lost due to churn
📈 Analysis of customer churn reasons, including poor network service, costly data plans, and better offers from competitors.
My goal was to transform raw data into meaningful insights that could help a business better understand its customers, identify potential problems, and make more informed decisions.
Through this project, I applied my skills in data analysis, data visualization, and Power BI dashboard development to explore a real-world business problem.
This is one step in my journey as a data analyst. I'm committed to learning, building more projects, and continuously improving my analytical skills
🔗 Explore my portfolio and projects:
https://lnkd.in/eDpZUPkm
I'd appreciate your feedback, suggestions, and the opportunity to connect with other data professionals.
#PowerBI #DataAnalytics #CustomerChurn #PortfolioProject #DataVisualization



Full of visual hierarchy

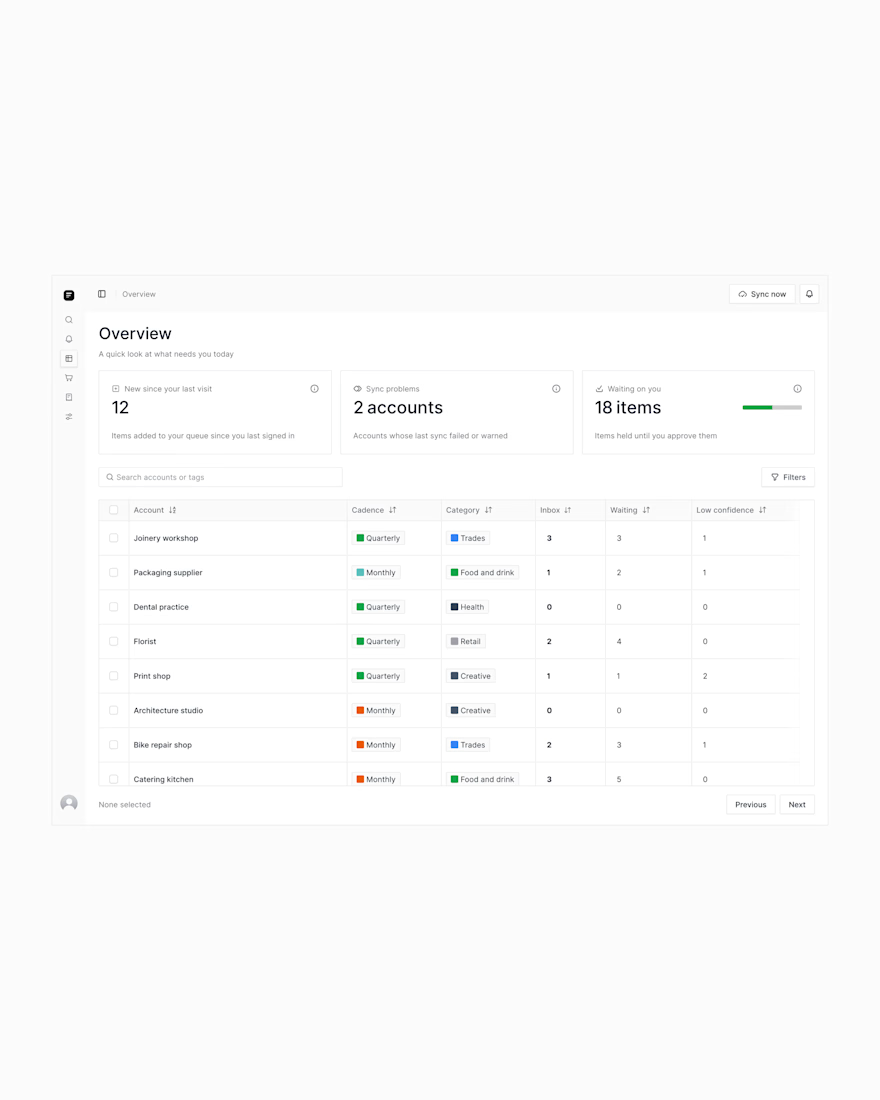
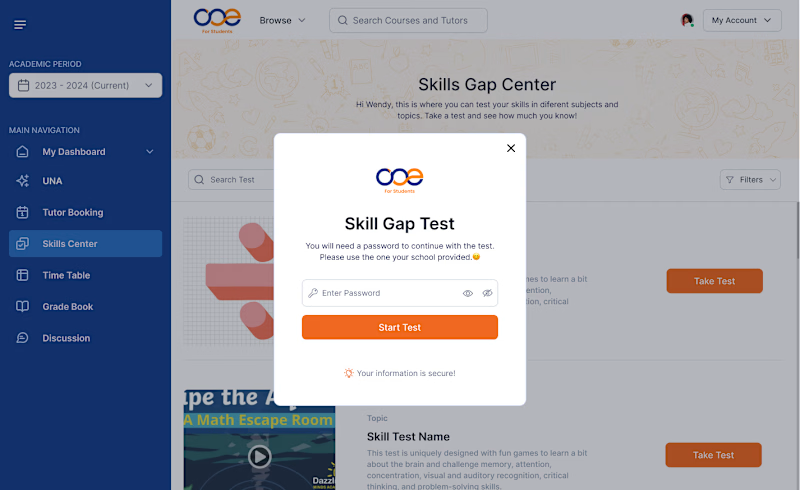
Which Skill Gap Test experience would you choose? 👀
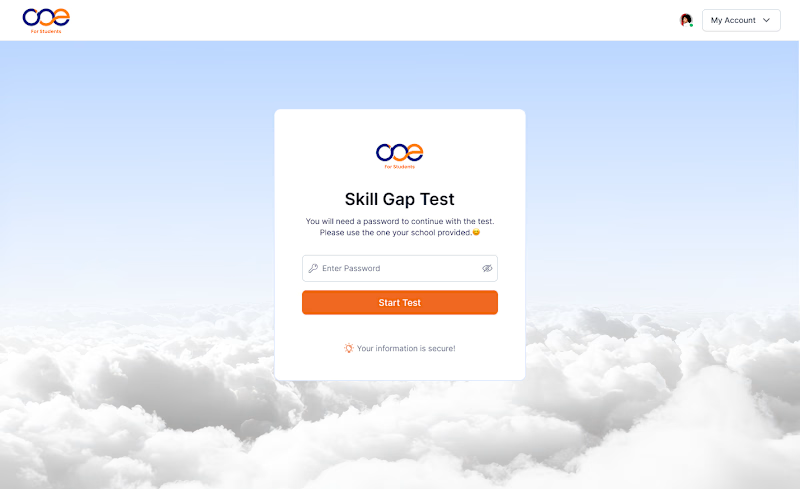
I designed two different experiences for the same Skill Gap Test.
Option A: A modal inside the dashboard — users stay in context.
Option B: A dedicated page — a cleaner, distraction-free experience.
If you were using this platform as a student, which experience would you prefer?
A or B? Why? 👇
#UIDesign #UXDesign #ProductDesign
4 voted
36%
7 voted
64%
11 votes
Closed

Dedecated Page is more professional and minimalistic ❤️