The network for creativity
Join 1.25M professional creatives like you
Connect with clients, get discovered, and run your business 100% commission-free
Creatives on Contra have earned over $150M and we are just getting started
Back to feedPost

Why do customers leave, and what can businesses do to reduce customer churn?
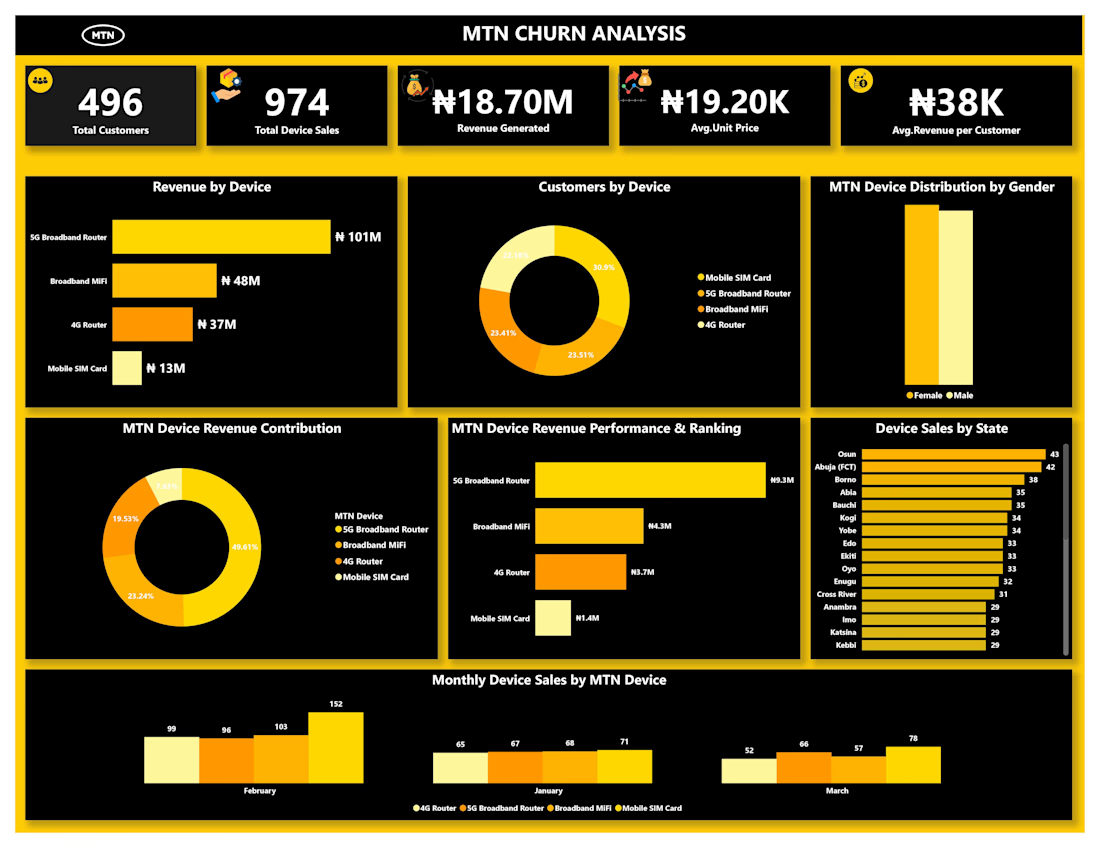
This is the question I explored in my MTN Customer Churn Analysis project, a personal project I built to strengthen my data analytics skills and showcase my work in my portfolio.
Using Power BI, I developed an interactive dashboard to analyze customer behavior, revenue performance, device sales, customer satisfaction, and churn patterns.
Some key findings from my analysis include:
📊 29.16% customer churn rate
💰 ₦5.28M in revenue lost due to churn
📈 Analysis of customer churn reasons, including poor network service, costly data plans, and better offers from competitors.
My goal was to transform raw data into meaningful insights that could help a business better understand its customers, identify potential problems, and make more informed decisions.
Through this project, I applied my skills in data analysis, data visualization, and Power BI dashboard development to explore a real-world business problem.
This is one step in my journey as a data analyst. I'm committed to learning, building more projects, and continuously improving my analytical skills
🔗 Explore my portfolio and projects:
https://lnkd.in/eDpZUPkm
I'd appreciate your feedback, suggestions, and the opportunity to connect with other data professionals.
#PowerBI #DataAnalytics #CustomerChurn #PortfolioProject #DataVisualization

The network for creativity
Join 1.25M professional creatives like you
Connect with clients, get discovered, and run your business 100% commission-free
Creatives on Contra have earned over $150M and we are just getting started








Related posts

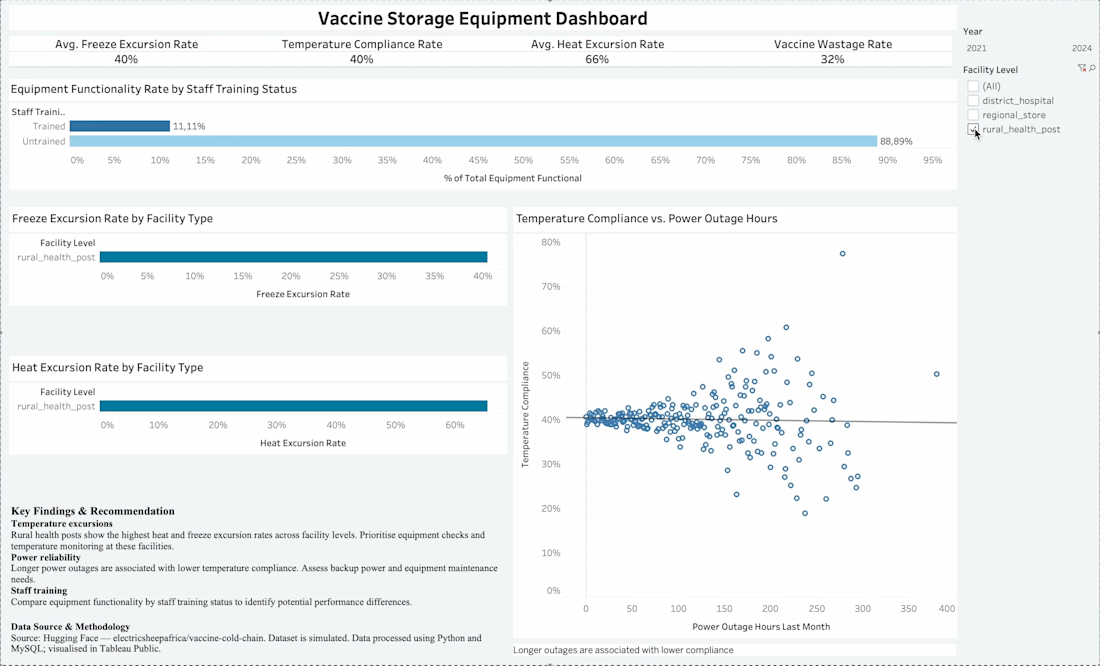
Understanding Vaccine Cold-Chain Performance
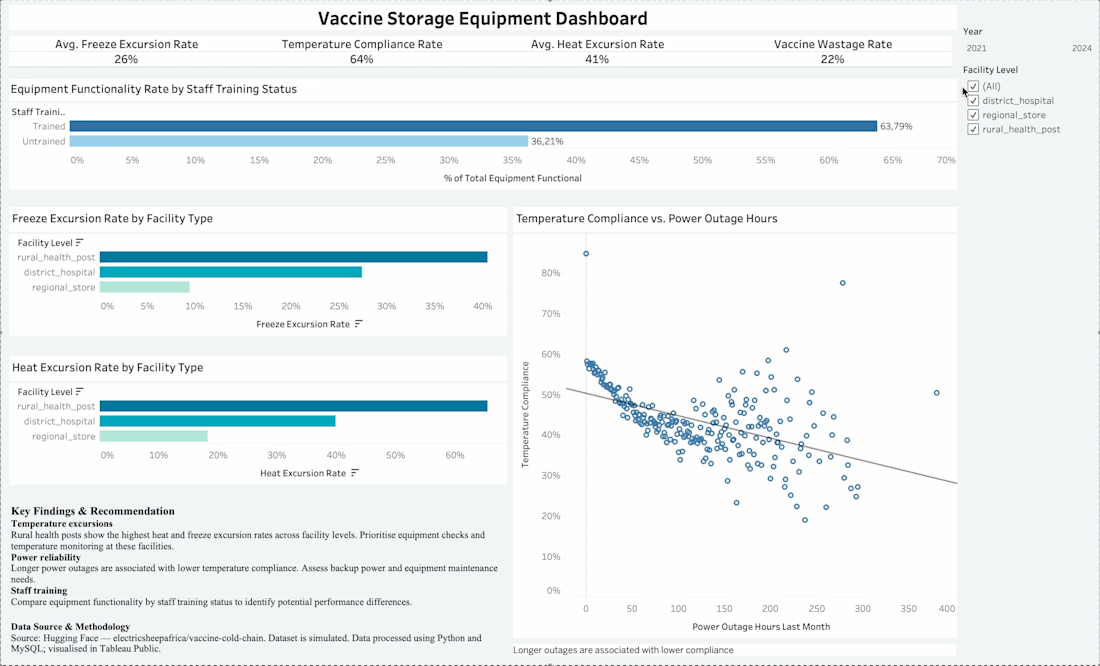
I used stimulated data to examine the effect of storage equipment and associated variables on vaccine excursion.
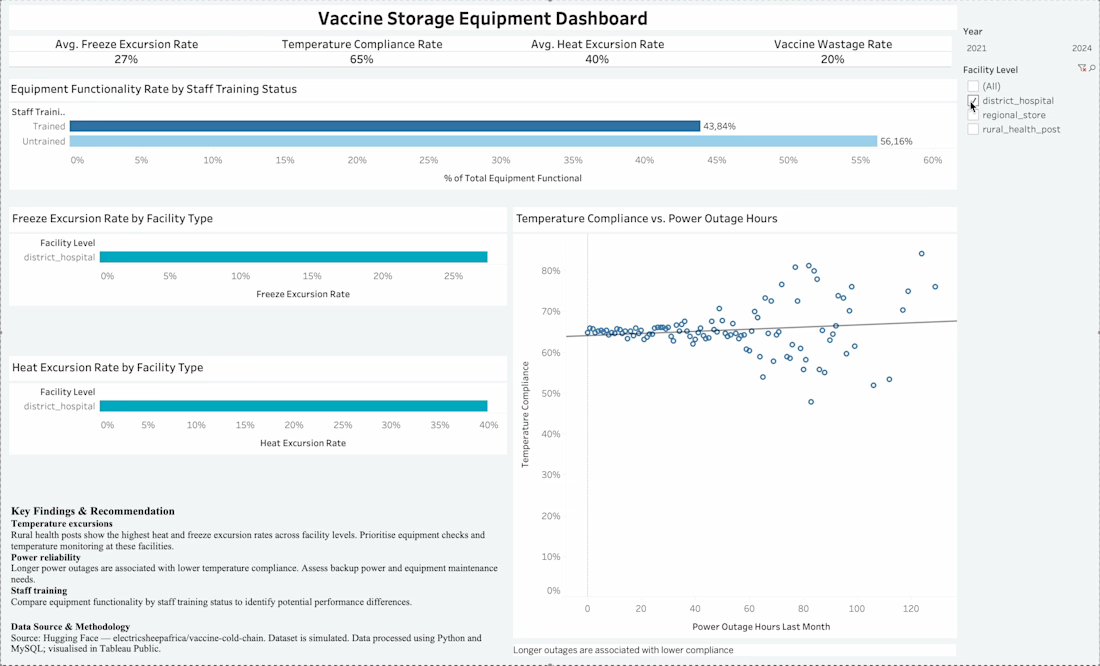
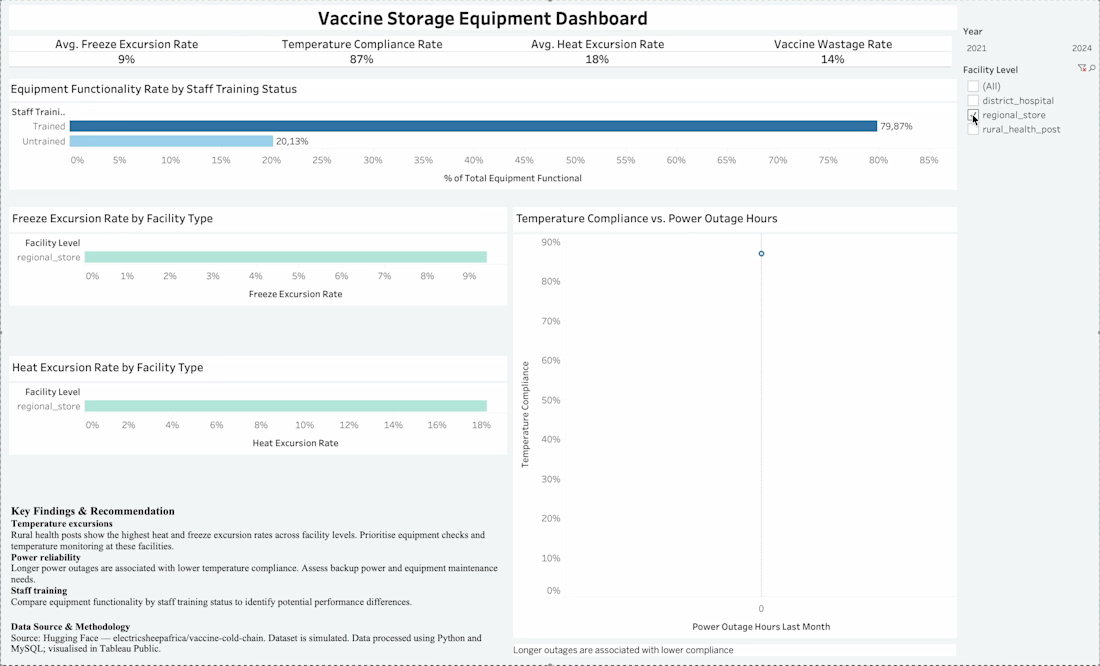
I downloaded the Vaccine Cold Chain Management dataset from Hugging Face using Python. I organized and combined the data from regional vaccine stores, district hospitals, and rural health posts using MySQL, then used Tableau Public to build an interactive dashboard exploring equipment functionality, staff training, temperature compliance, vaccine wastage, and power outages.
Three key insights were uncovered.
Rural health posts recorded the highest heat and freeze excursion rates.
Longer power outages were associated with lower temperature compliance.
Reliable equipment alone isn't enough. Staff training and proper maintenance matter too.



Very interesting 👌

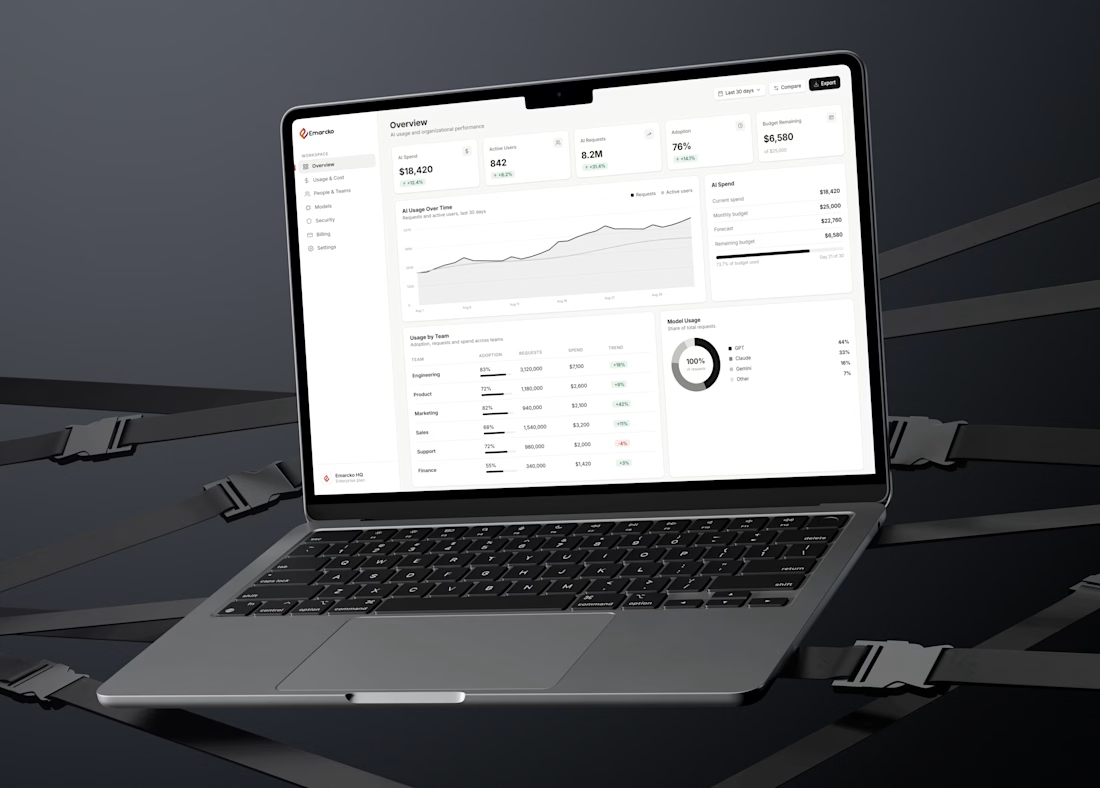
A closer look at Emarcko CRM, a sales and marketing dashboard concept.
Designed to bring customer insights, sales activity, and marketing performance into one organized workspace.
The focus was on clear data visualization, thoughtful layouts, and a consistent visual experience across the dashboard.



Really inspiring work.

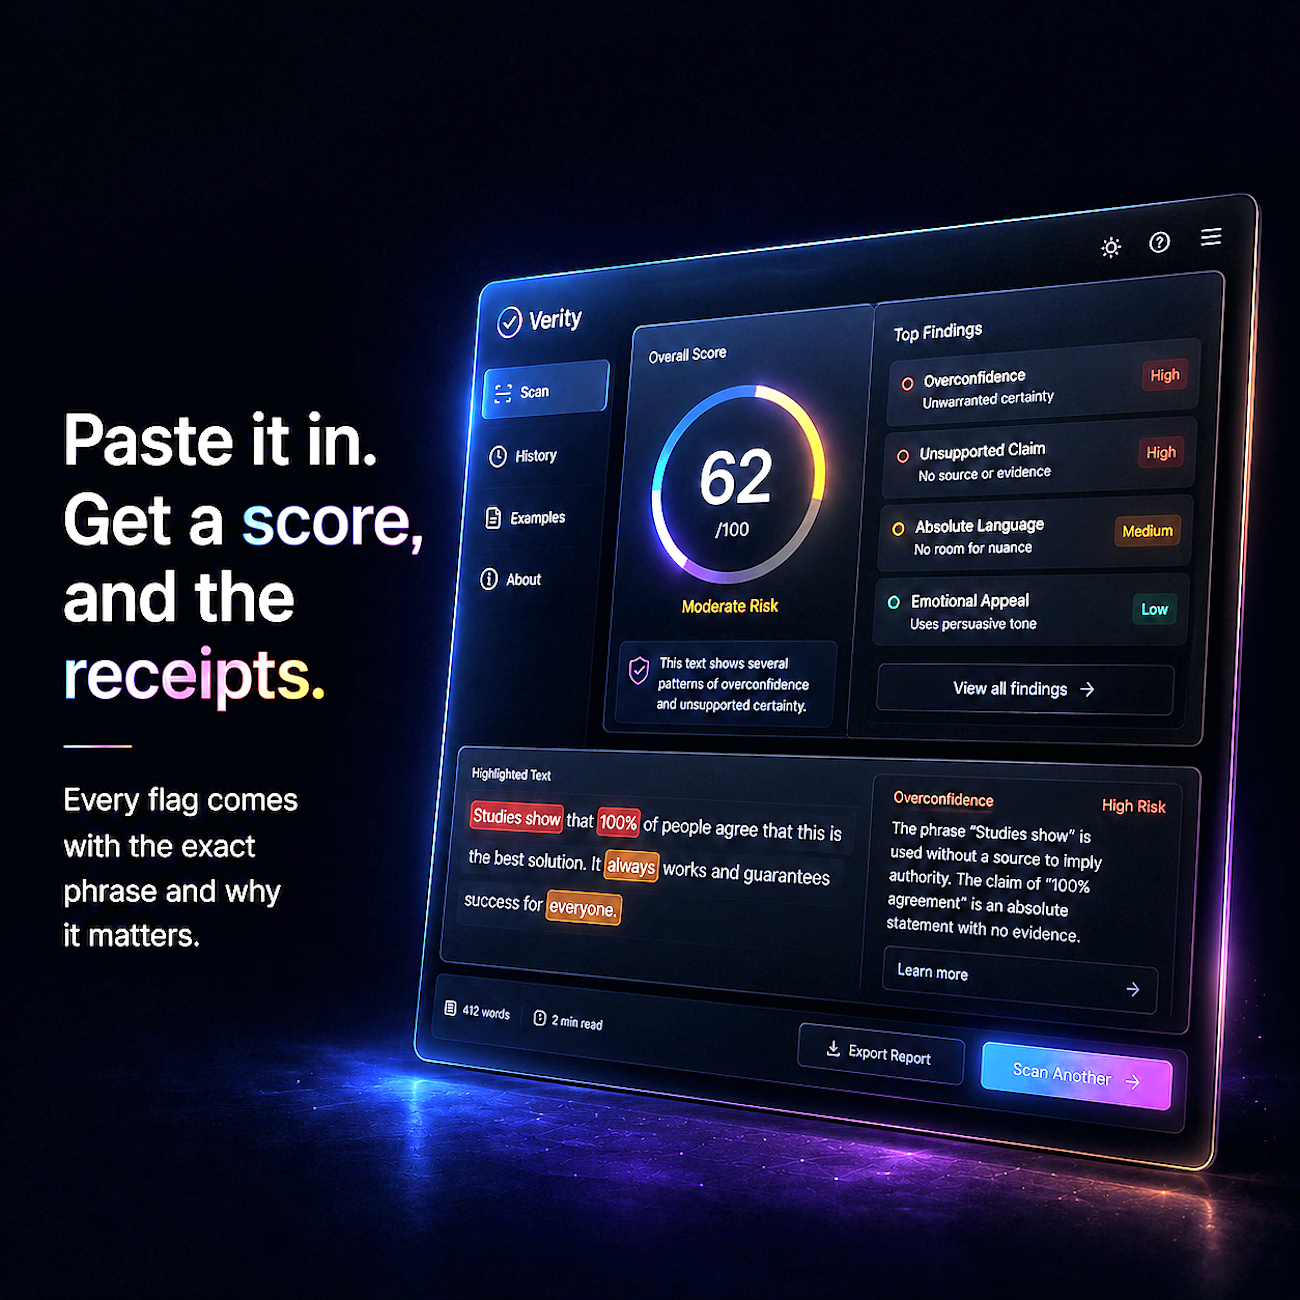
Verity is an AI-assisted text analysis project designed to examine text patterns and present an interpretable score based on its analysis. The project explores how technology can help users assess written content through structured analysis and accessible feedback.




Verity is an AI-assisted text analysis project designed to examine text patterns and present an interpretable score based on its analysis. The project explores how technology can help users assess written content through structured analysis and accessible feedback.
I contributed...