The network for creativity
Join 1.25M professional creatives like you
Connect with clients, get discovered, and run your business 100% commission-free
Creatives on Contra have earned over $150M and we are just getting started
Back to feedPost

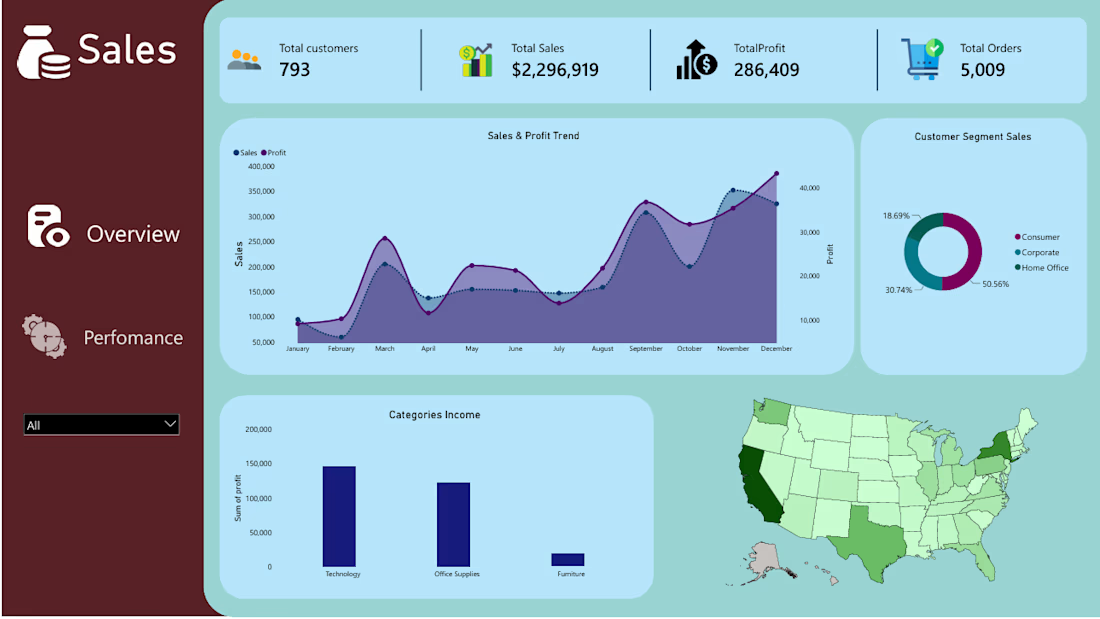
E-Commerce Executive Sales & Performance Analytics
Retailers often generate strong revenue across thousands of transactions while lacking clear, consolidated visibility into what drives true profitability versus top-line volume. Without unified tracking across product lines, customer segments, and regional distribution, e-commerce businesses struggle to identify seasonal revenue dips, pinpoint margin-eroding products, and evaluate long-term target benchmarks.
To address these operational challenges, this project delivers an interactive two-page Power BI dashboard engineered to transform raw transaction data into executive-level clarity. Page 1 establishes an Executive Overview tracking $2.30M in Total Sales, $286.4K in Total Profit, and 793 unique customers—highlighting that the Consumer segment drives over 50% of revenue while Technology leads category earnings. Page 2 provides a deeper performance breakdown for tracking YoY monthly growth and target execution, showcasing key drivers like top product lines (Phones at $330K and Chairs at $328K) and shipping mode efficiency. This solution equips business leaders to transition from reactive reporting to proactive, data-driven strategy across inventory, marketing, and fulfillment operations.
The network for creativity
Join 1.25M professional creatives like you
Connect with clients, get discovered, and run your business 100% commission-free
Creatives on Contra have earned over $150M and we are just getting started
Related posts

E-commerce admin dashboard with KPIs, revenue charts and order management in one clean view.


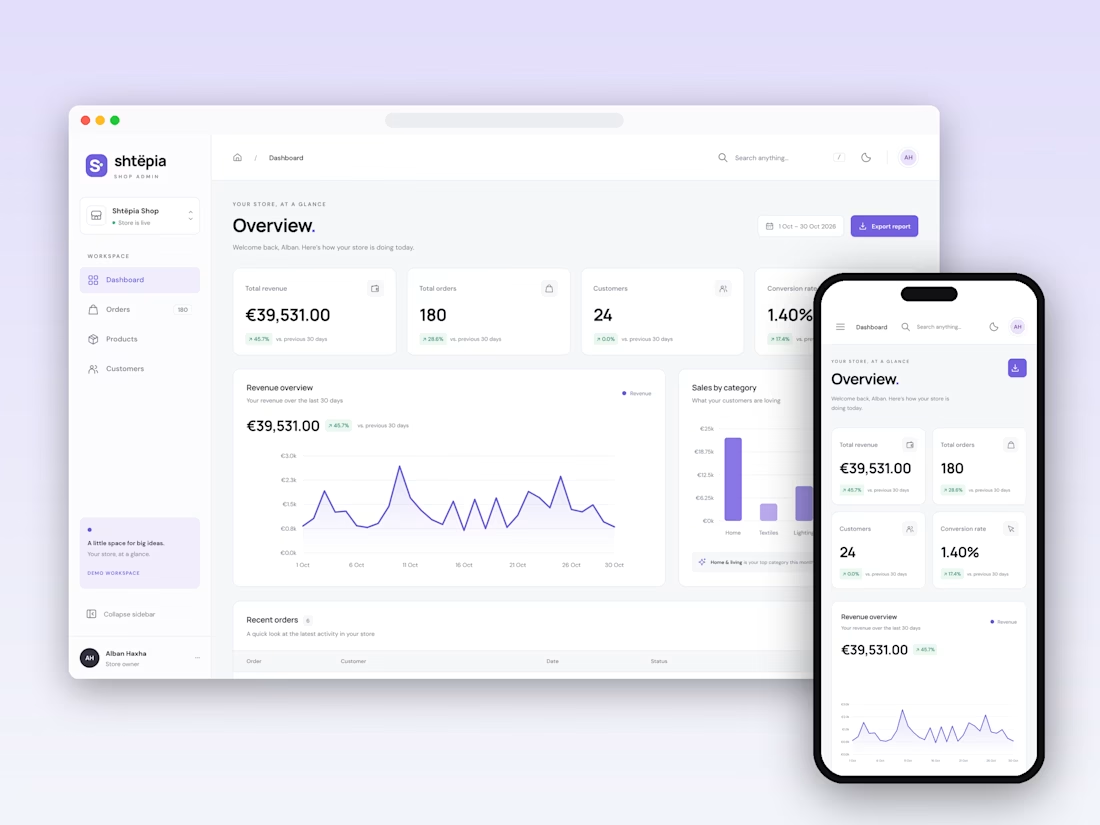

Keeping KPIs, revenue and orders in one view is hard to balance. Which one did you place first, and why?

Your Performance Max campaign is spending money. But is it driving real business growth?
Google Ads Performance Max can reach potential customers across Google's channels. But broader reach alone doesn't guarantee better results.
The real challenge is giving the campaign the right signals.
Before scaling, I focus on three things:
→ Conversion Tracking: Are we measuring genuine leads, purchases, and meaningful actions accurately?
→ Campaign Signals: Are conversion goals, audience signals, assets, and product data aligned with business objectives?
→ Performance Quality: Are conversions turning into qualified leads, paying customers, and revenue?
A campaign can report more conversions while business results remain unchanged. That's why tracking quality and downstream outcomes matter.
I'm Sumon Mahmud, a Google Ads and Conversion Tracking Specialist. I help businesses connect campaign optimization with reliable measurement and better marketing decisions.
Need help auditing or optimizing your Performance Max campaign?
Let's discuss your goals.
Visit https://itsumon.com/
#GoogleAds #PerformanceMax #ConversionTracking #PPC #DigitalMarketing


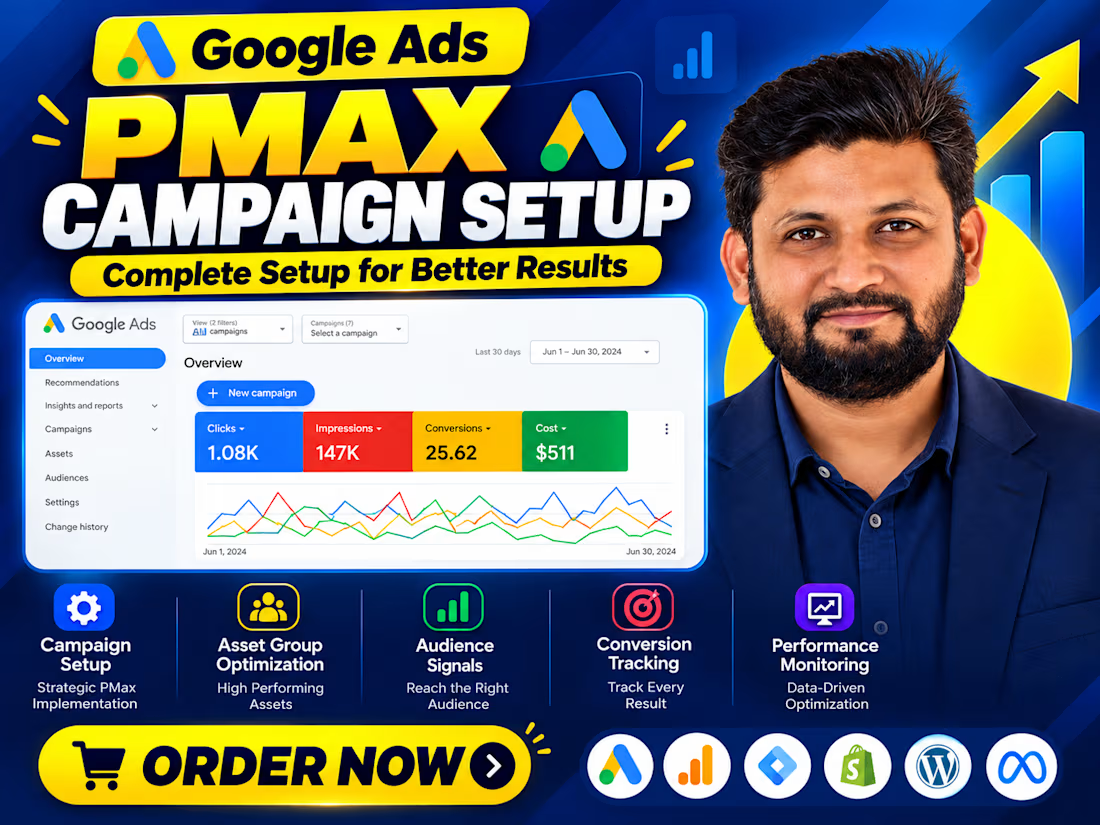

"More conversions, same business results" is the PMax story in one line. In your audits, do creative assets move the needle as much as tracking quality, or is tracking still the bigger lever?

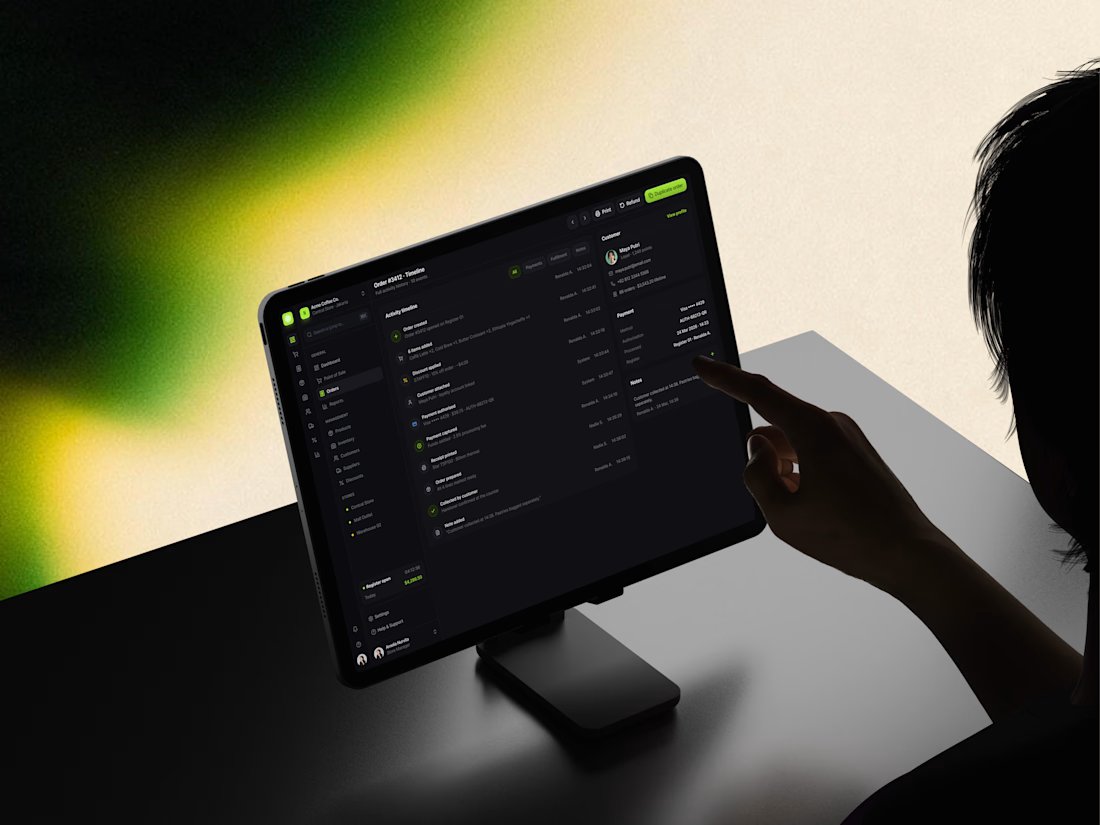
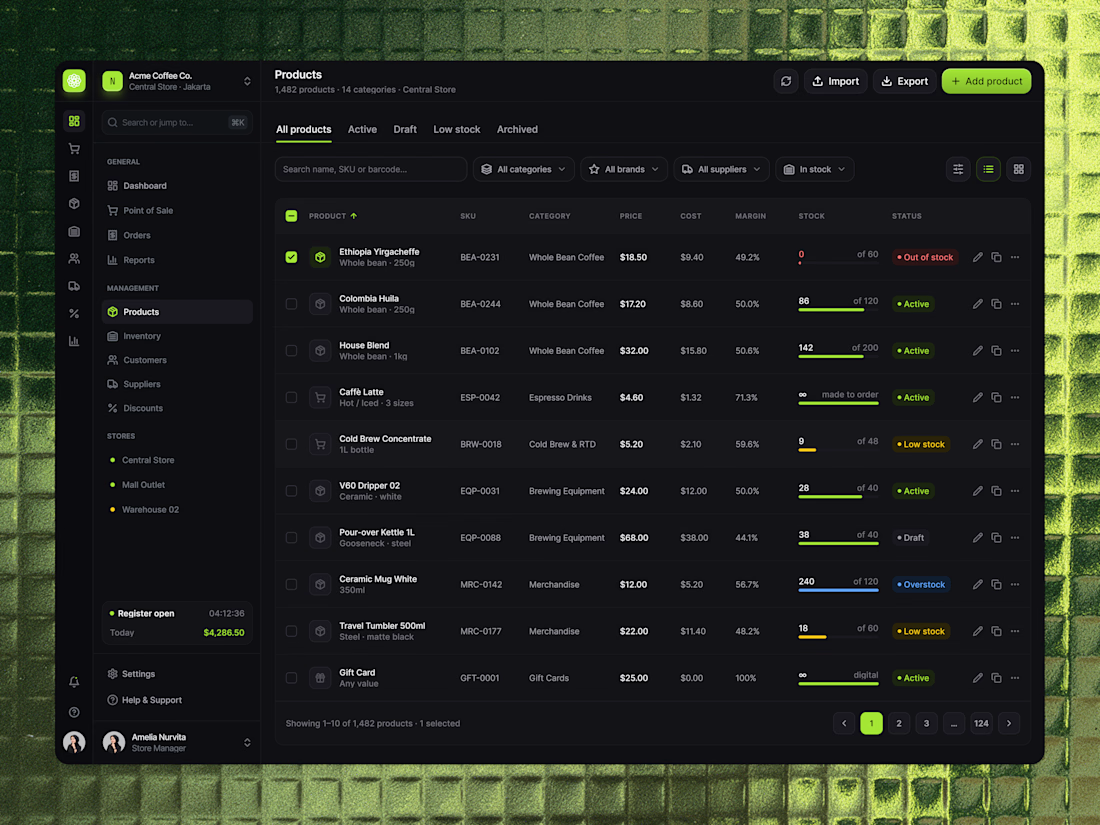
Relivo — Multi-Store Retail POS & Inventory Orchestration Platform 🛍️✨
Relivo is an enterprise-grade retail management web app built around real-time inventory observability, order auditability, and seamless customer retention.
The goal was to remove register checkout friction and multi-branch inventory opacity — pairing high-contrast OLED dark panels with vibrant status badges and structured tabular grids to make high-volume store tracking feel effortless.
Special attention was given to:
• A product-focused catalog grid managing 1,482 SKUs with real-time stock threshold bars, margin calculations, and channel tags.
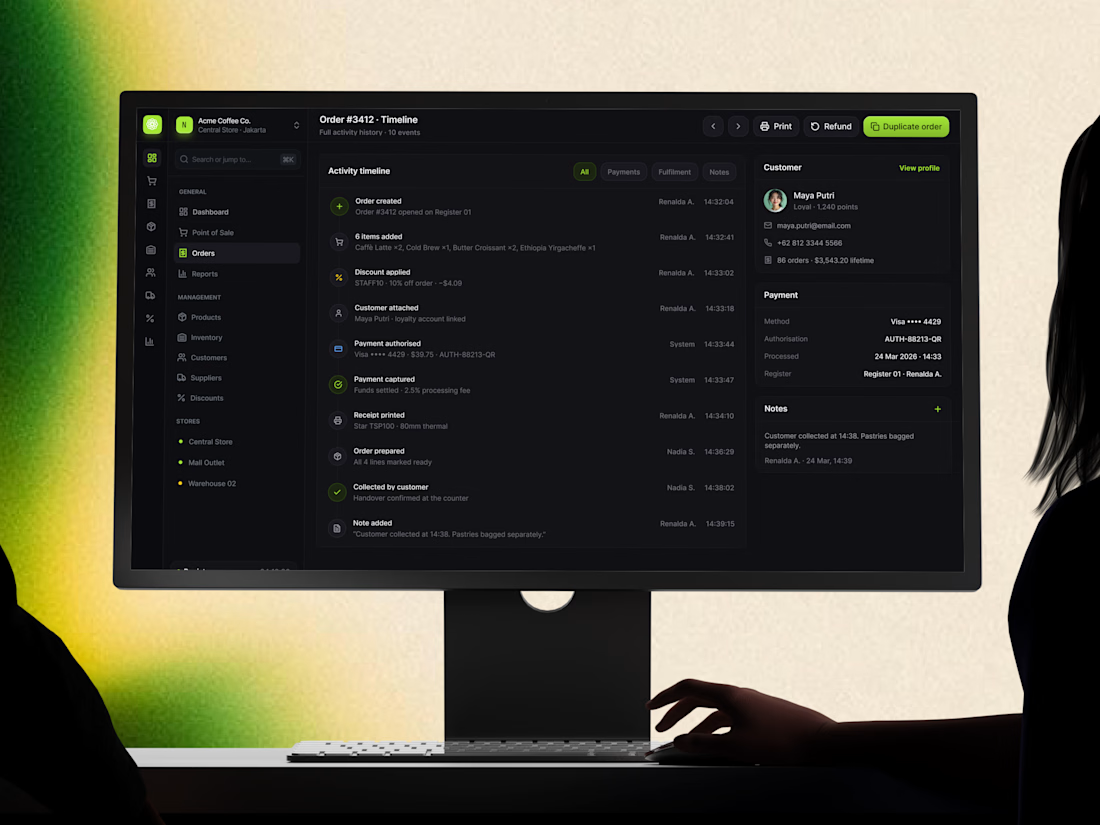
• Full-spectrum order audit feeds tracking turn-level transaction events from item addition down to receipt printing and pickup confirmation.
• Customer CRM integration connecting loyalty points (Gold Tier) and purchase histories directly to active order inspection panels.
• Granular transaction tracking separating payments across Visa, QRIS, GoPay, and Cash alongside exception statuses (Part. refunded, Refunded).
• High-visibility neon status badges (Out of stock, Low stock, Processing, Completed) for instant scannability during busy shifts.
• An elevated presentation aesthetic showcasing dark tablet and desktop displays resting on textured metallic and ambient backlit surfaces.
The result is a fast, reliable digital workspace that combines raw enterprise utility with modern software sophistication.
Ready to transform your retail, POS, or enterprise software into a seamless digital experience? Let’s partner up to build something extraordinary ✨