The network for creativity
Join 1.25M professional creatives like you
Connect with clients, get discovered, and run your business 100% commission-free
Creatives on Contra have earned over $150M and we are just getting started
Back to feedPost

Insurance Portfolio Dashboard - Power BI | $5M Premium Tracking
Client Problem:
Insurance agency tracking 10K policies in Excel - no clarity on which age group claims more, which policy type is profitable.
Dashboard I Built:
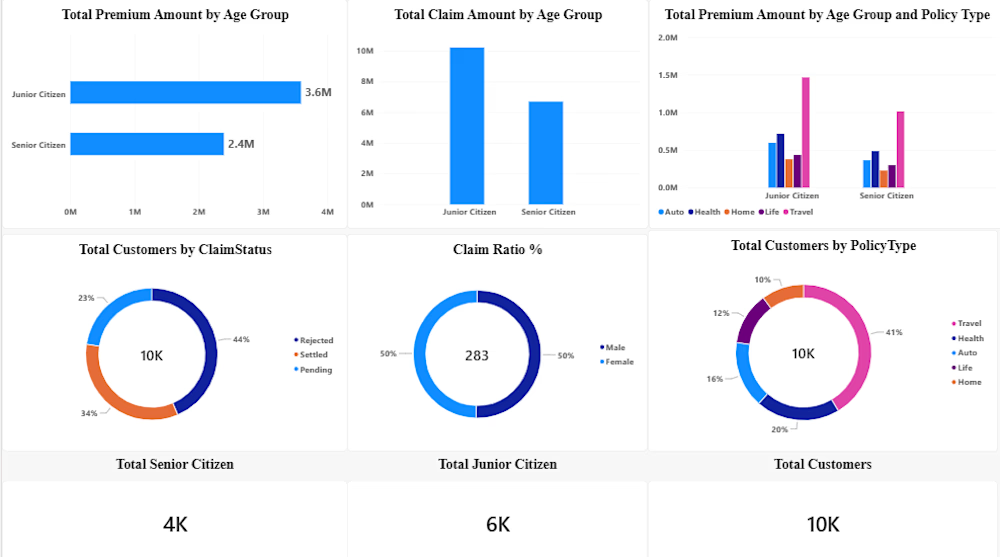
Premium vs Claim Analysis by Age Group (Junior 6K vs Senior 4K)
Claim Status Breakdown: 44% Settled, 34% Pending, 22% Rejected
Claim Ratio % by Gender
Customers by Policy Type: Travel 41%, Auto 20%, Home 16%, Health 12%, Life 11%
KPIs: Total Customers 10K | Senior 4K | Junior 6K | Premium 5M
Business Impact:
Client found Senior Citizens claim 2x more vs Junior, and Travel policy is top seller. Helped them re-price premiums and save $50K in risk.
Tools: Power BI, DAX, Data Modelling, Excel
Timeline: 2 Days | For: Insurance Brokers / Agencies.


The network for creativity
Join 1.25M professional creatives like you
Connect with clients, get discovered, and run your business 100% commission-free
Creatives on Contra have earned over $150M and we are just getting started





Related posts


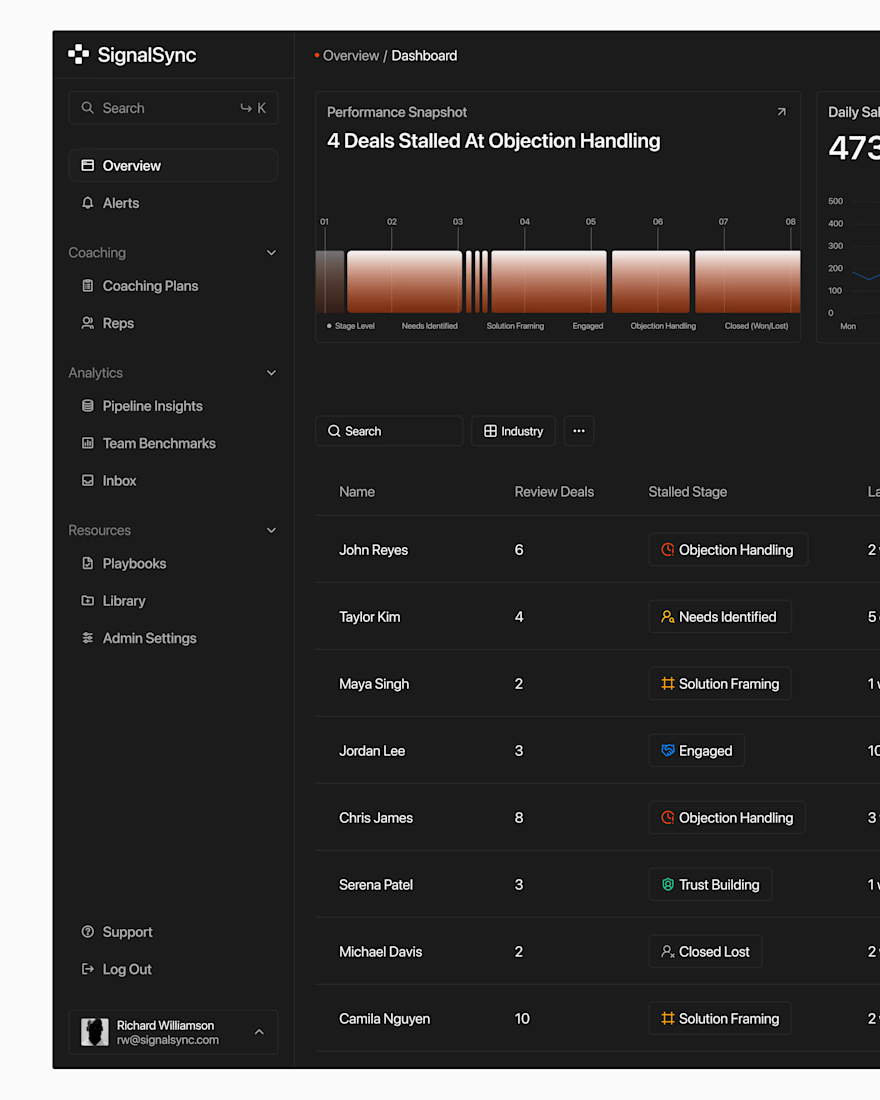

Super clean work!

Public services rarely operate in isolation.
One citizen or business journey can depend on multiple services, systems, approvals and handoffs. When one dependency slows down, understanding where the journey is blocked and what it affects downstream becomes a systems problem.
CIVARA / 007.01 Public Service Operations Command explores how service teams could see journeys, dependencies, bottlenecks and service health from one operational view.
Not another government dashboard. An exploration of the human operational layer behind joined-up public services.
Independent concept study by Jemirae, using Ghana as a research context. Not commissioned, endorsed by, or affiliated with the Government of Ghana. Demo data only.
#govtech #enterpriseux #servicedesign #digitalgovernment #jemirae
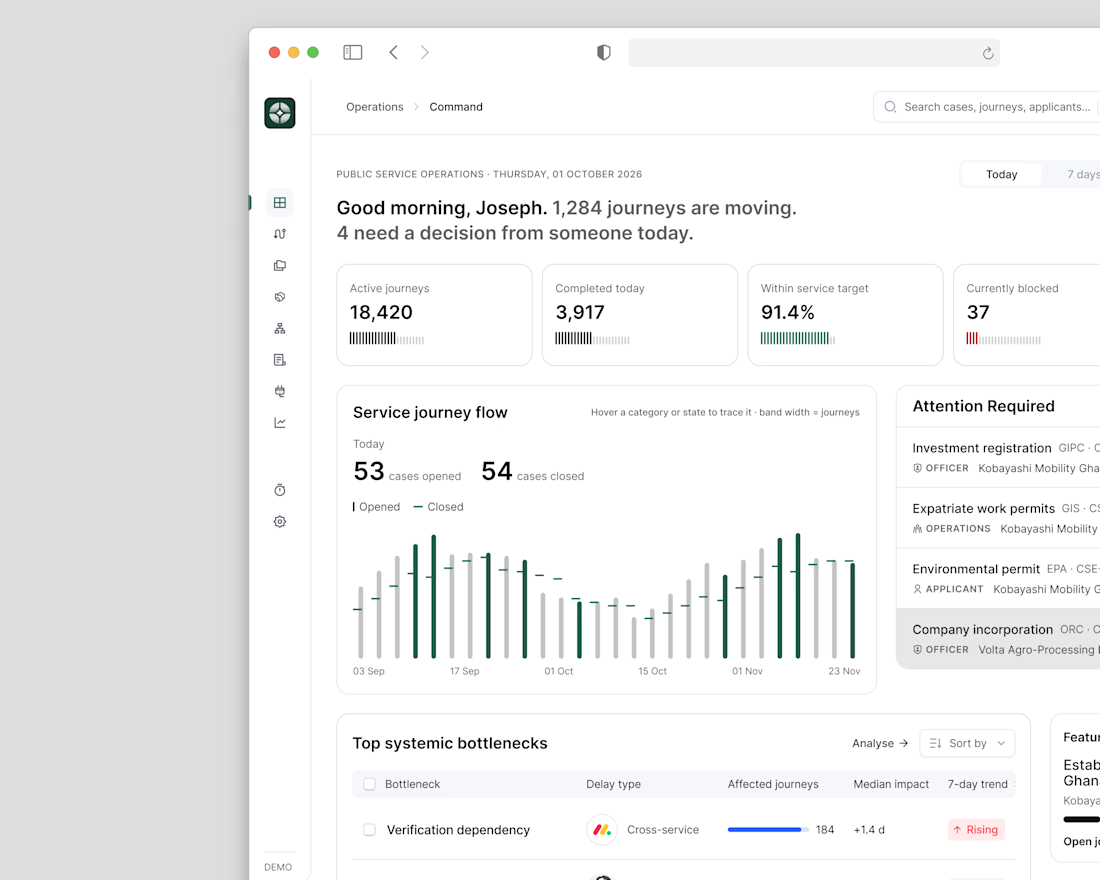
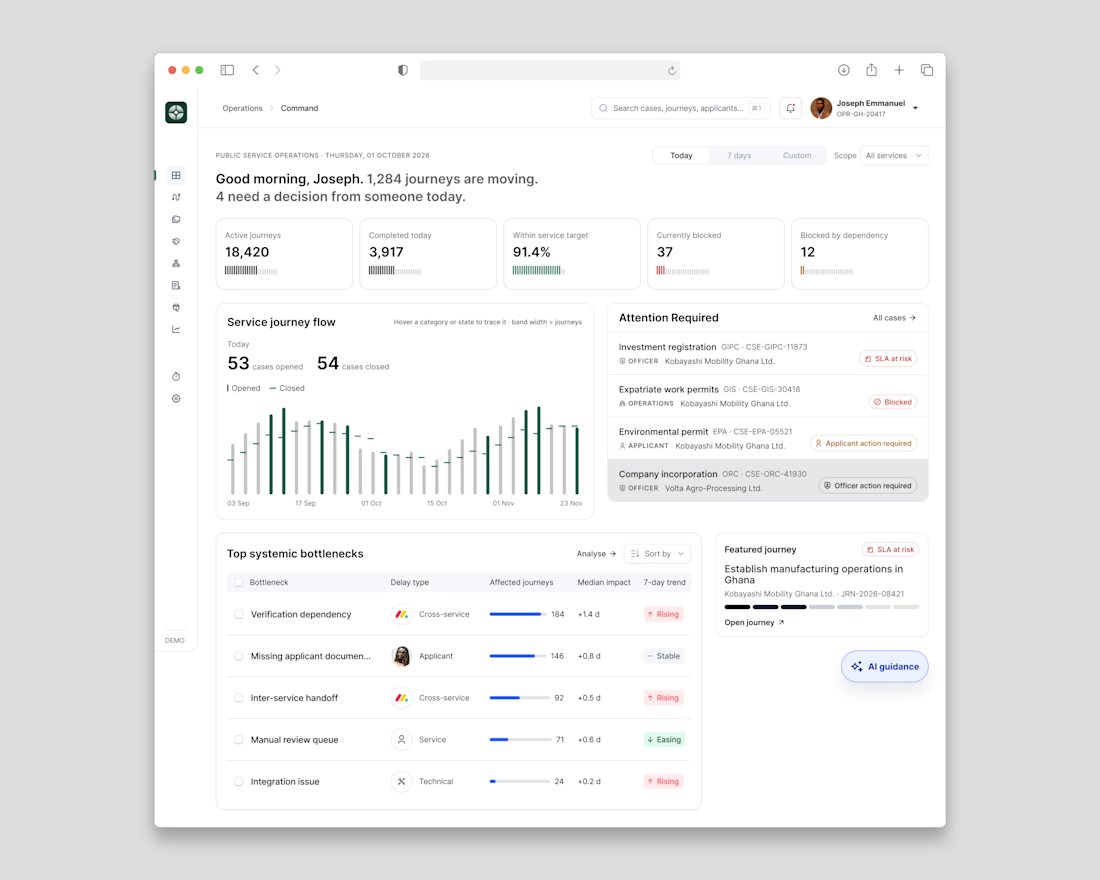
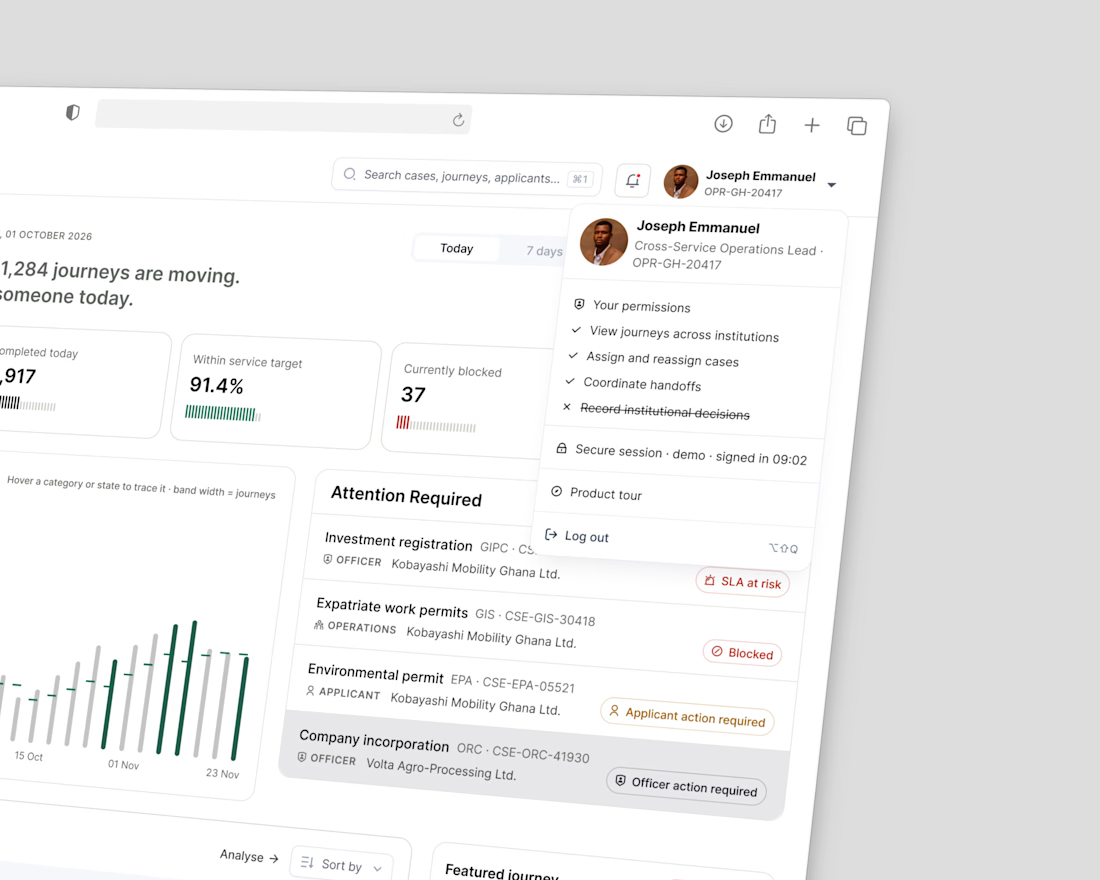

Showing where a journey gets blocked is the part that matters in a dashboard like this.

I just finished building my own open-source farm bot called Farmbt 🌱
It's a team of 13 AI agents. I asked them one question, and they came back with a ranked list of opportunities nobody has fully cracked yet.
You describe a problem area in plain words, and the agents take it from there:
🔎 Researchers search the web in parallel and pull out findings, each with its source
✅ A verifier re-opens the pages and checks every claim against the real text
🗳️ A gap hunter runs three independent passes, and only gaps that show up repeatedly survive
🥊 A critic tries to prove each gap is already solved
🛠️ Solver agents design fixes, check them against existing products and papers, and write an experiment plan
The hard part wasn't getting AI to produce answers. It was making it not make things up. So every claim is graded by evidence, confidence ratings are capped by what the source actually supports, and everything is saved, so a run that hits a rate limit picks up where it stopped.
It runs on free-tier models today and gets better with every model upgrade, with no code changes.
First test: crop-disease detection apps for smallholder farmers. 39 sources, 16 findings and 5 opportunities, ending in a concrete first experiment to run.
Open source: github.com/Samthnalyst1234/Farmbt
If you need an AI pipeline that's reliable enough to trust, for research, automation or anything in between, let's talk 👋


The step where a verifier re opens every page is a solid guard against hallucinations, and persisting state lets the run survive rate limits without missing a beat