The network for creativity
Join 1.25M professional creatives like you
Connect with clients, get discovered, and run your business 100% commission-free
Creatives on Contra have earned over $150M and we are just getting started
Back to feedPost

E-commerce Sales Analytics Dashboard - Power BI | ₹3.27M Revenue Tracking
Client Problem:
2K customers, 8K orders in Excel. Owner had no idea which products actually make profit, which category drives customers.
Dashboard Solution - 6 KPIs + 6 Visuals:
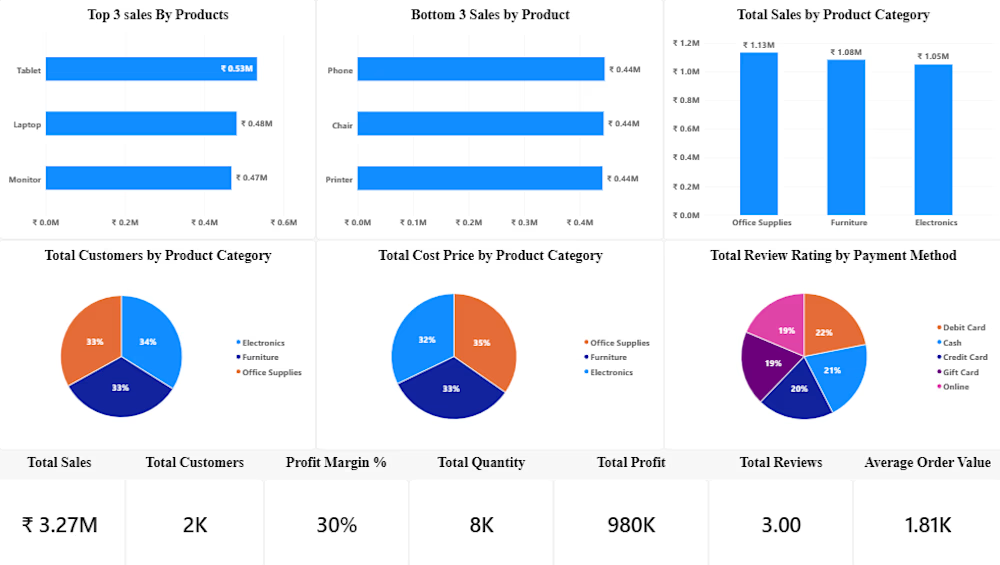
Top 3 Sales: Tablet ₹0.53M | Laptop ₹0.48M | Monitor ₹0.47M
Bottom 3 Sales: Phone, Chair, Printer - Clear underperformers to discount
Sales by Category: Office Supplies ₹1.19M leads Furniture & Electronics
Customer Mix: Electronics 34%, Office 33%, Furniture 33% - Balanced
Cost Price by Category - 39% Office Supplies cost
Review Rating by Payment: Credit Card 29% top, Debit 22% - Improve COD experience
KPIs at Bottom:
Total Sales ₹3.27M | Customers 2K | Margin 30% | Qty 8K | Profit 980K | AOV 1.81K | Rating 3.0
Impact:
Client stopped pushing low-margin Phone/Chair, focused on Tablet/Office Supplies. Increased profit from 30% to 38% in 45 days
Tools: Power BI, DAX, Sales Analytics
For: E-commerce, Retail Stores, D2C Brands.


The network for creativity
Join 1.25M professional creatives like you
Connect with clients, get discovered, and run your business 100% commission-free
Creatives on Contra have earned over $150M and we are just getting started





Related posts



Super clean work!

Public services rarely operate in isolation.
One citizen or business journey can depend on multiple services, systems, approvals and handoffs. When one dependency slows down, understanding where the journey is blocked and what it affects downstream becomes a systems problem.
CIVARA / 007.01 Public Service Operations Command explores how service teams could see journeys, dependencies, bottlenecks and service health from one operational view.
Not another government dashboard. An exploration of the human operational layer behind joined-up public services.
Independent concept study by Jemirae, using Ghana as a research context. Not commissioned, endorsed by, or affiliated with the Government of Ghana. Demo data only.
#govtech #enterpriseux #servicedesign #digitalgovernment #jemirae
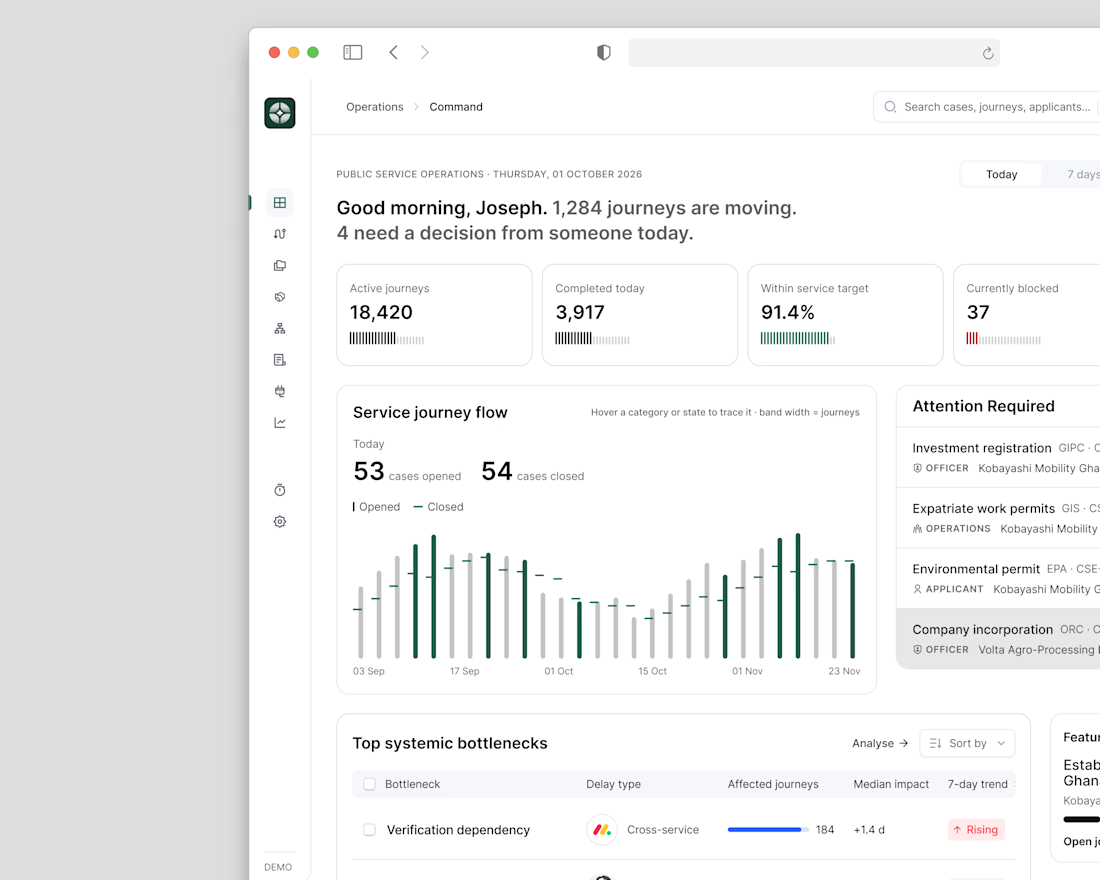
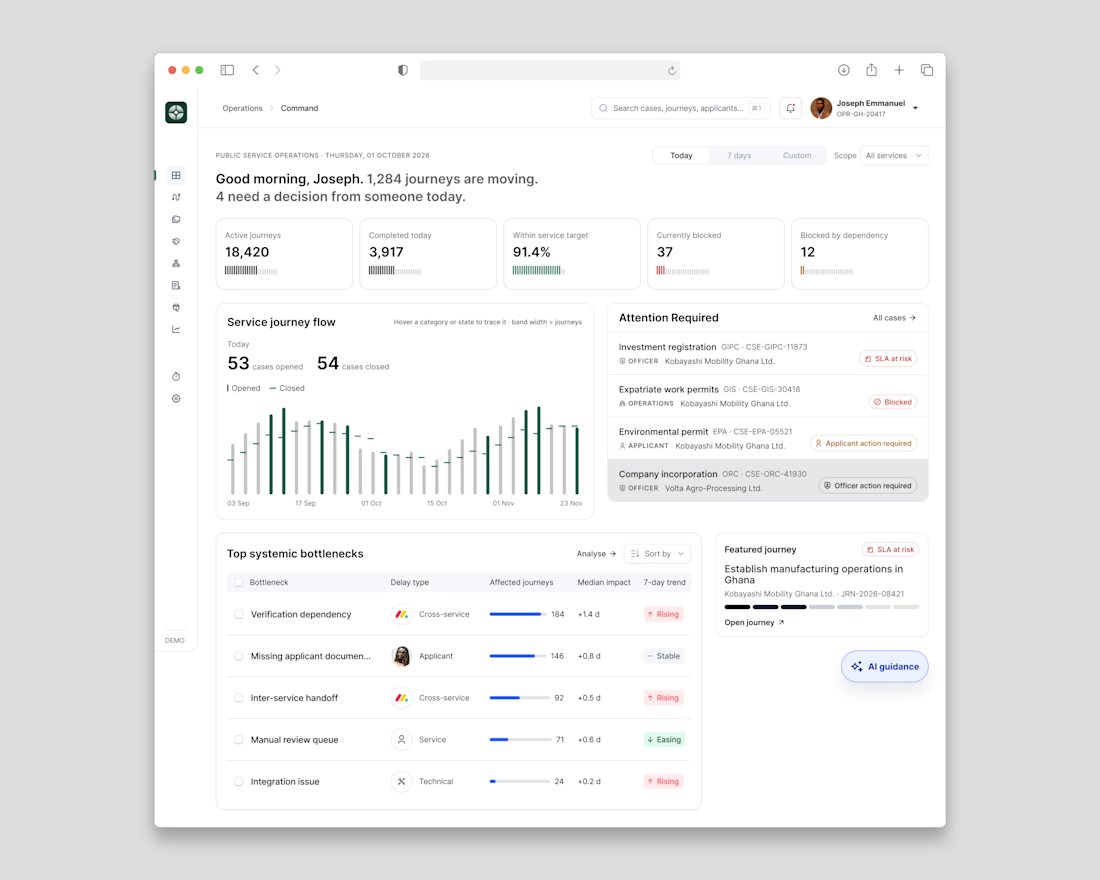
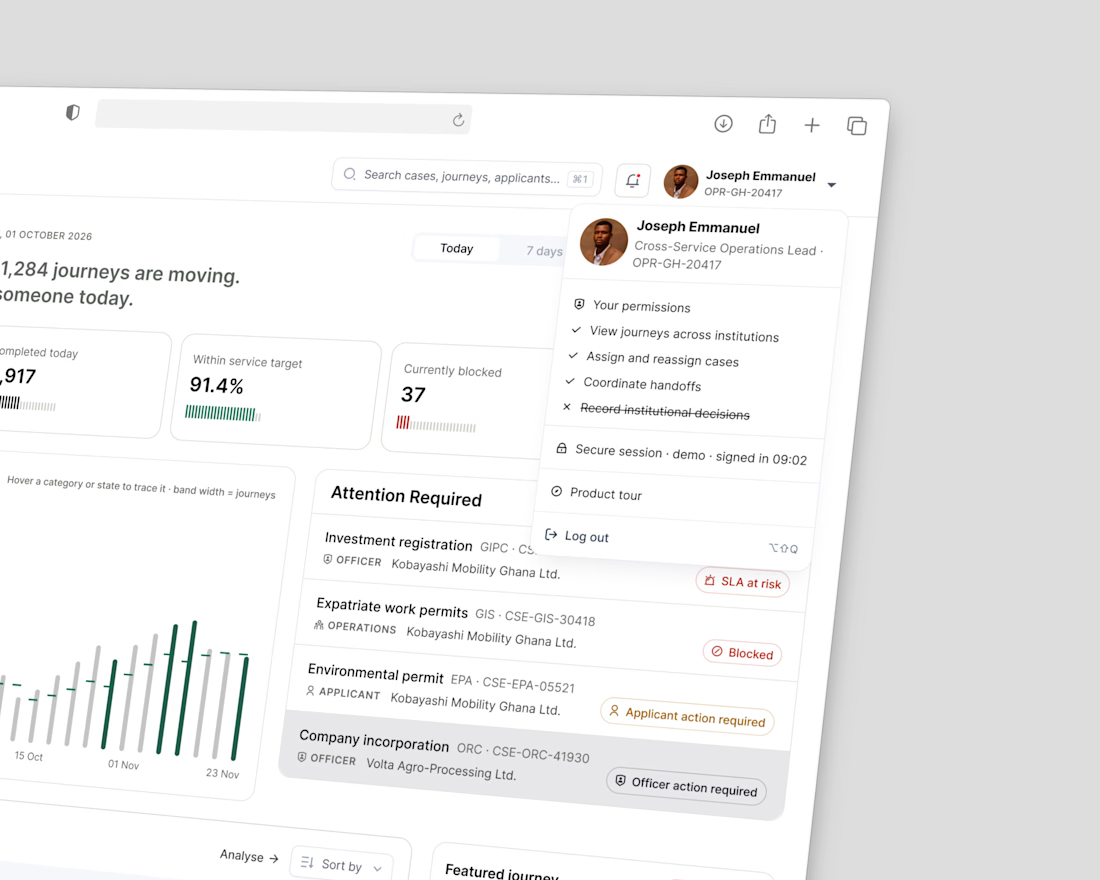

Showing where a journey gets blocked is the part that matters in a dashboard like this.

AI Business Analytics Platform — UI & Motion Design
Concept design for a futuristic AI-powered business platform. I created the interface, dashboard elements, data visualizations and motion design, including a 3D animated globe to represent global connectivity and real-time analytics.


