Freelancers in TanzaniaFreelancers in Tanzania
Content and influencer strategy for mission based brands.

8x
Hired
5.0
Rating
30
Followers
Content and influencer strategy for mission based brands.

Logo design & Branding
New to Contra
Logo design & Branding
Healthcare Data Analyst | Claims,Operations & Readmission
New to Contra
Healthcare Data Analyst | Claims,Operations & Readmission
Cover image for I analyzed a hospital's full
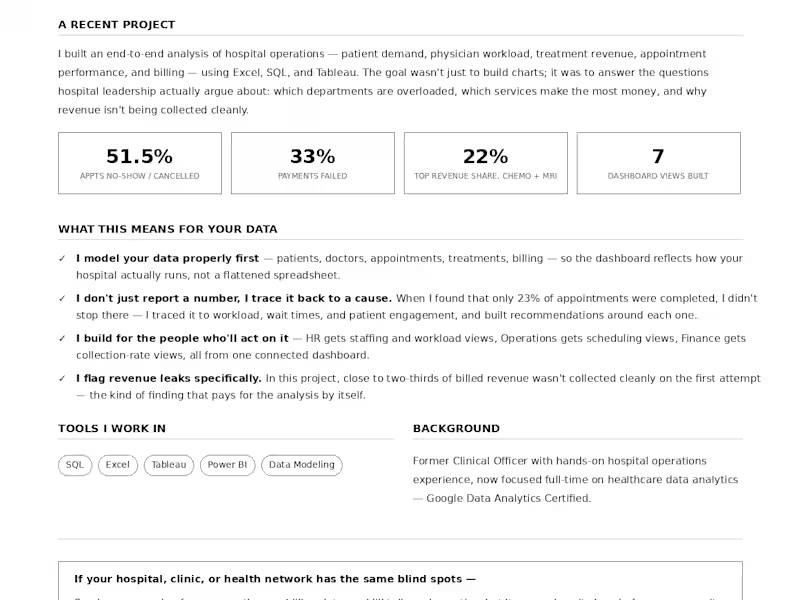
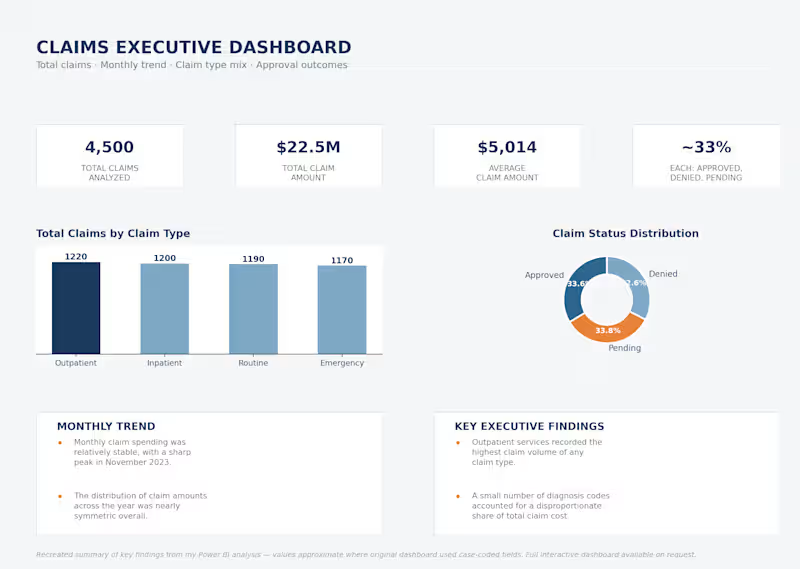
I analyzed a hospital's full operations picture — patient demand, physician workload, treatment costs, appointment performance, and billing — using Excel, SQL, and Tableau, to help hospital leadership see where things were quietly going wrong before the losses added up. A few things stood out. Pediatrics and Dermatology carried the highest patient volume and physician workload — meaning a small group of doctors were absorbing most of the pressure, which is a staffing risk if any of them become unavailable. On the revenue side, Chemotherapy and MRI were the top earners (11.6% and 10.5% of total revenue), driven by cost and case complexity rather than sheer demand. The bigger problems were in the pipeline itself: only 23% of appointments were actually completed, with 26% no-shows and 25.5% cancellations — nearly half the appointments never happened. And on the billing side, only 32% of revenue was cleanly collected; 34% sat pending and 33% failed outright. That's close to two-thirds of billed revenue not coming in on the first try. So what does a hospital actually do with this? Based on the data, I recommended: investigating what's driving the near-50% no-show/cancellation rate and testing fixes like reminders or flexible rebooking; reviewing the billing workflow behind the pending/failed payments, since documentation and payer communication were the likely starting points; adding block scheduling or dedicated clinics for high-cost services like Chemotherapy and MRI to raise equipment utilization; and rebalancing appointment volume away from the Central branch, which was absorbing most of the demand while Eastside and Westside sat underused. I built interactive Tableau dashboards so HR, Operations, and Finance could each track the KPIs relevant to their team in real time — turning a pile of scattered hospital data into something leadership could actually act on.
0
68
Brand & website designer
Full-Stack Engineer & Blockchain Developer
Expert in Framer Websites & Brand Strategy

7
Followers
Expert in Framer Websites & Brand Strategy