Projects using Microsoft Power BI in Pimpri-Chinchwad
Projects using Microsoft Power BI in Pimpri-Chinchwad
Sign Up
Post a job
Sign Up
Log In
Filters
2
Projects
People
Message
0
Smita S
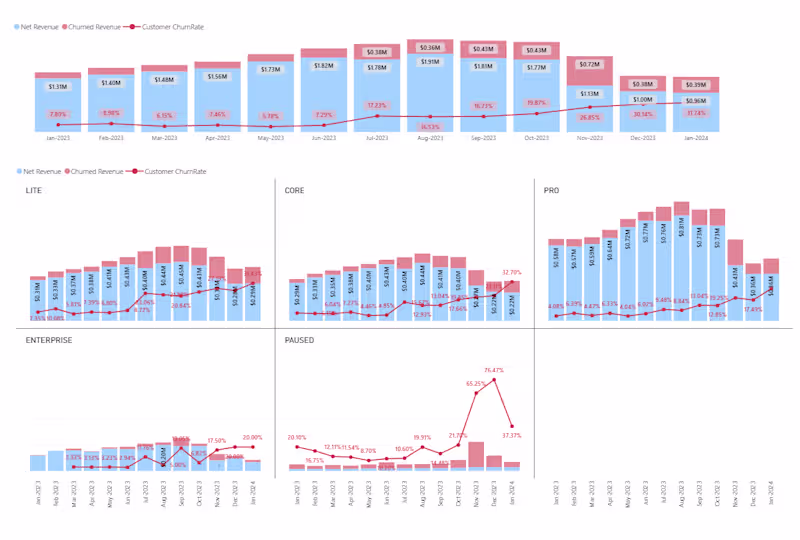
MRR & Churn Analysis Dashboard for SaaS Retention and Growth
0
36
Message
0
Rohit Poddar
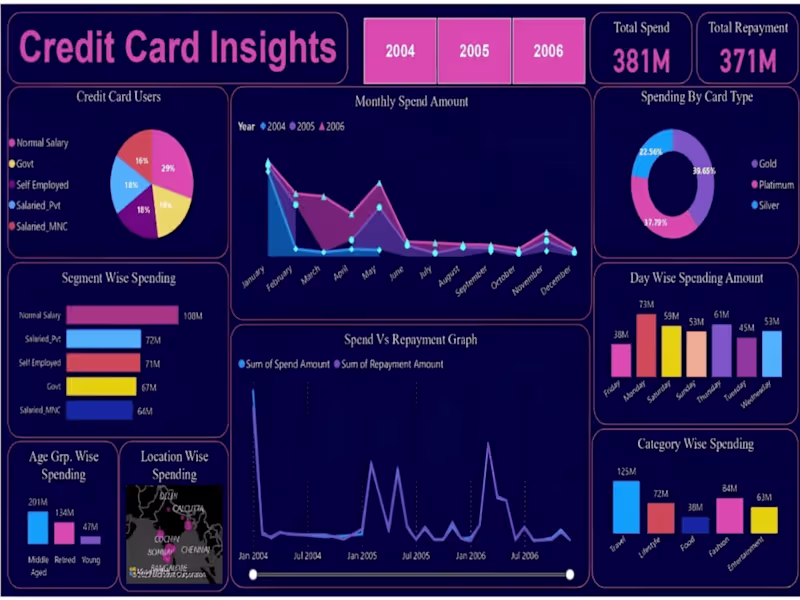
Credit Card Spending Pattern and Customer Acquisition | Power BI
0
67
Message
1
Sarbjot Singh
Data Analytics Project | BlinkIT Grocery Sales Analysis Excited to share my latest Data Analytics project ,where I analyzed BlinkIT Grocery Sales Data and delivery data to uncover meaningful business insights 📈 📊 What I worked on: Analyzed sales performance across product categories, outlet types, sizes, and locations Identified top-performing item categories and customer preferences Studied the impact of outlet size, establishment year, and visibility on sales Converted raw data into actionable insights and business recommendations 💡 Key Insights: Fruits & Vegetables, Snack Foods, and Frozen Foods drive maximum sales FOR FULL PROJECT VIST GIT HUB –( https://lnkd.in/d34sdAPz )
1
53
Message
0
VARSHA ZOKE
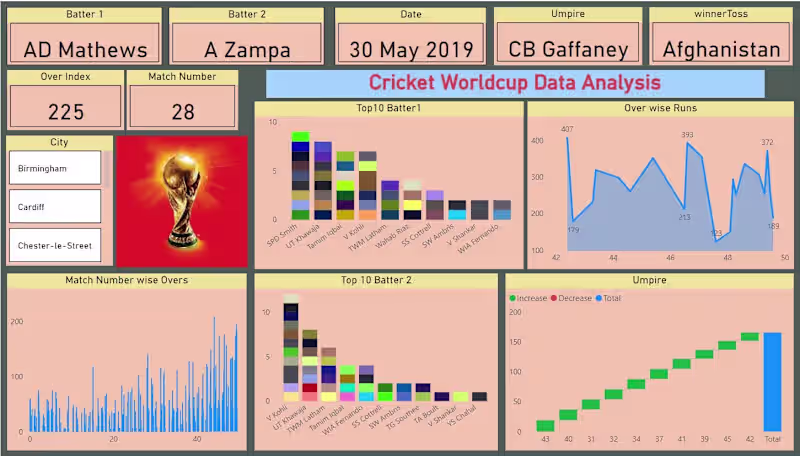
Cricket WorldCup Dashboard
0
7
Message
0
Ateeb Mahedvi
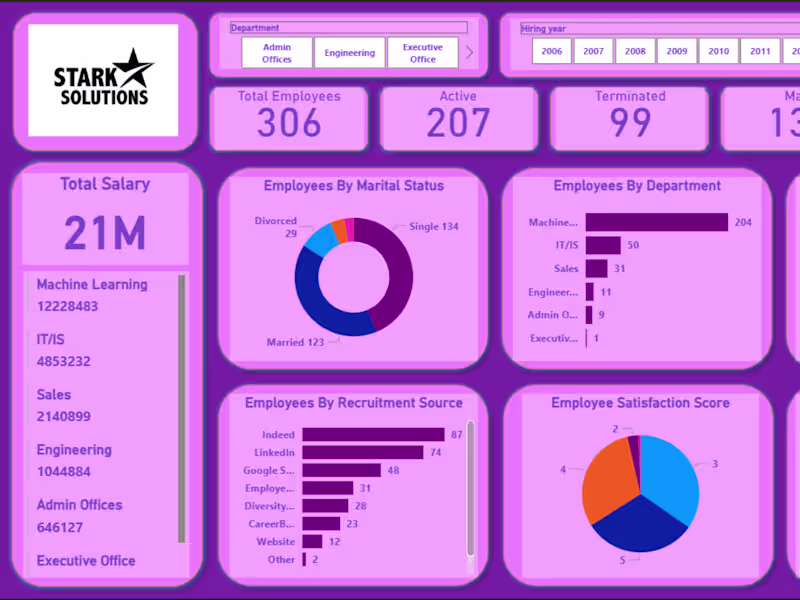
HR Analytics Dashboard
0
2
Message
0
Amal Jose
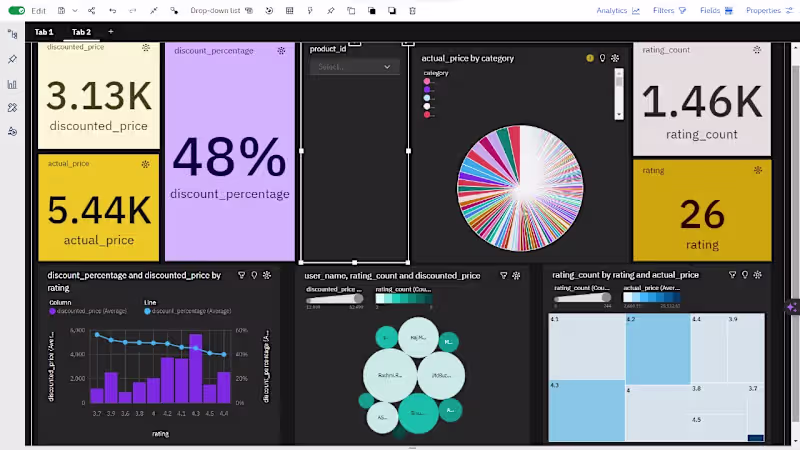
Developed an interactive Amazon Product Analytics Dashboard in Power BI to analyze 200+ product categories, pricing trends, discount effectiveness, customer ratings, and performance drivers. Leveraged Power Query, DAX, and advanced visualizations to transform raw e-commerce data into actionable business insights, enabling data-driven pricing and product strategy decisions.
0
12
Message
0
Daniyal Shaikh
Online Retail Price Analysis - Flipkart vs Amazon
0
2
Message
0
Aishwarya Mahajan
Responsive Sales Dashboard for Madhav Store
0
11
Message
0
Neha Madrala
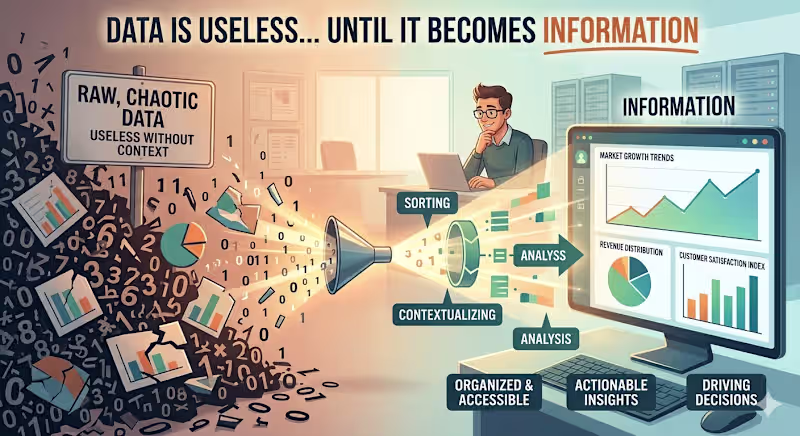
Data is useless. Yes, it is. Because on its own, it doesn’t say much. It’s just numbers, rows, and columns. The real value comes when that data is understood — when it answers a question, shows a pattern, or drives a decision. That’s what turns data into information. And that’s what businesses actually need.
0
101
Message
0
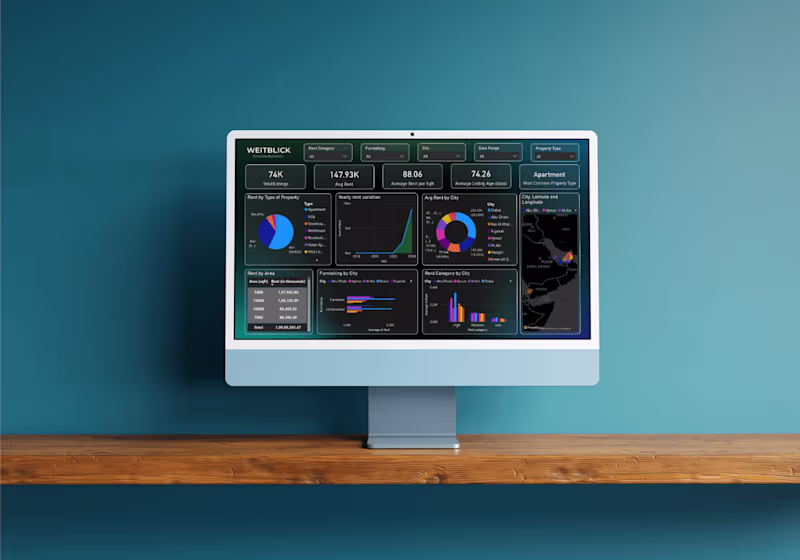
Weitblick
Real Estate Power BI Dashboard
0
3
Message
0
saikat nandi
Sales Analysis E-Commerce Power BI
0
5
Message
0
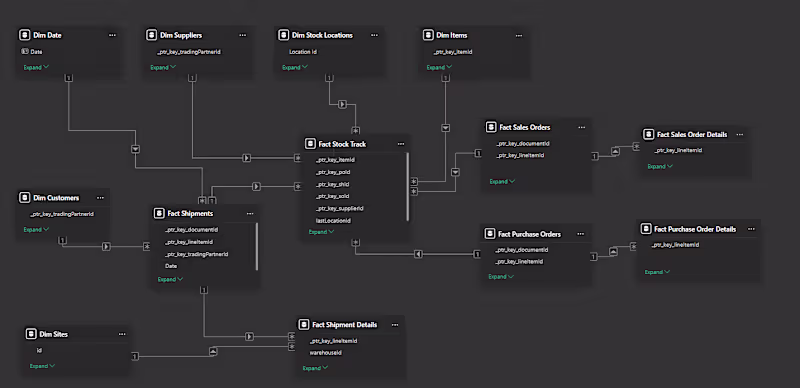
Jash Joshi
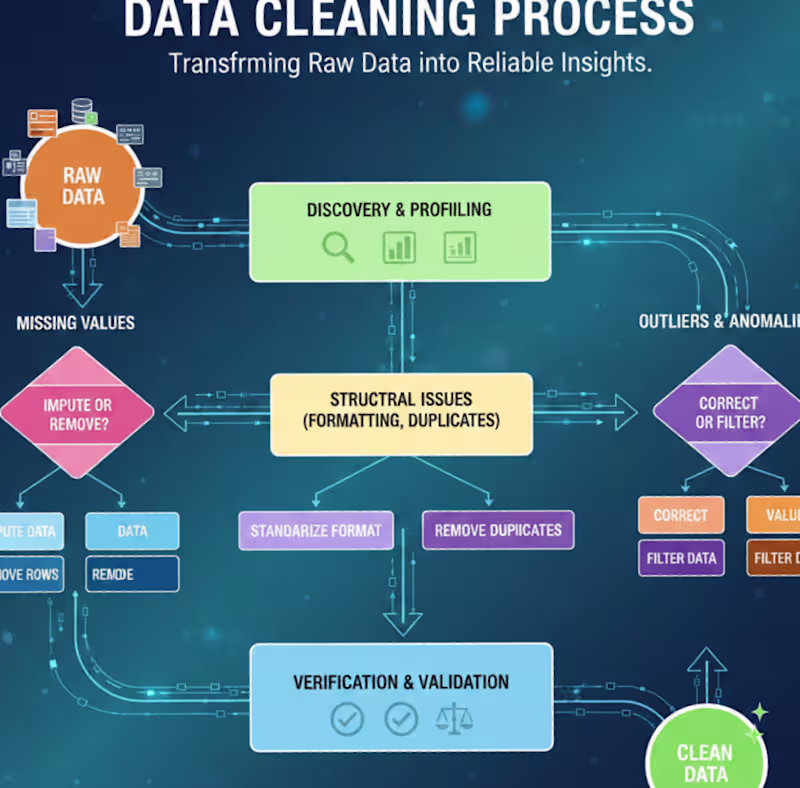
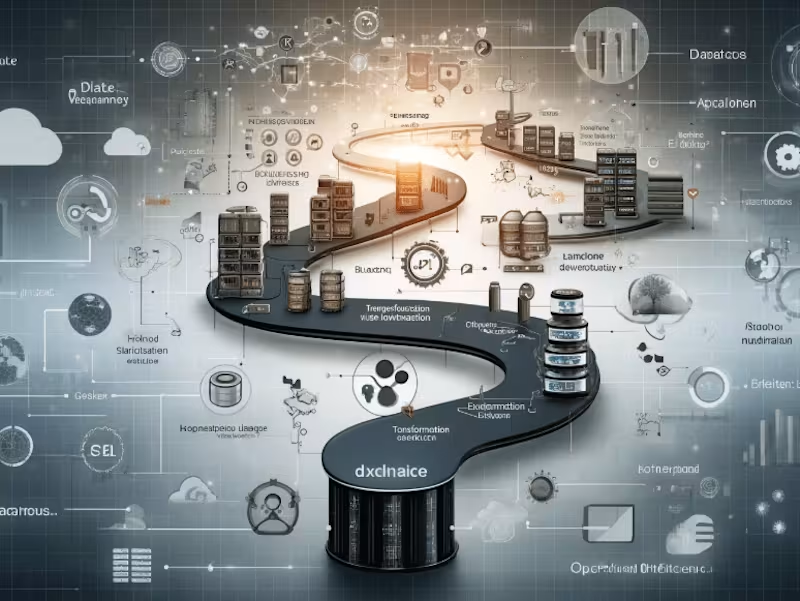
Enhancing Operational Efficiency through ETL Solutions
0
4
Message
0
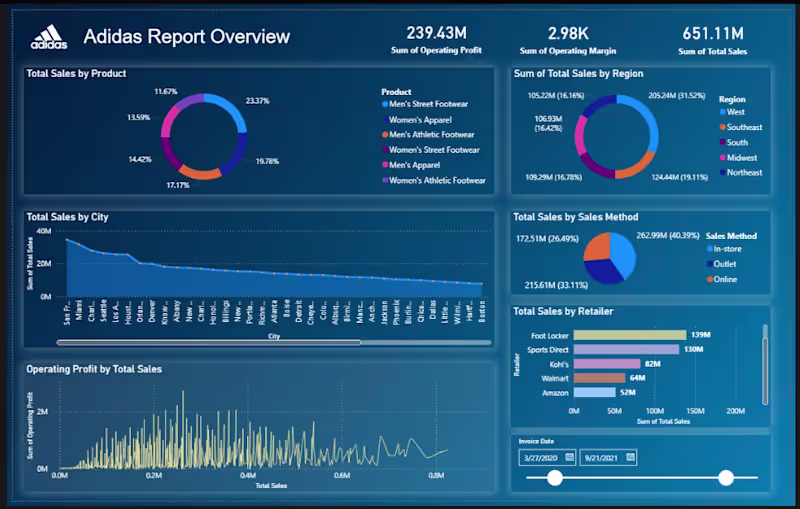
Siddhartha Tiwari
Adidas Report - Sample
0
1
Message
0
Smita S
Power BI Templates for Self-Service Reporting
0
21
Message
2
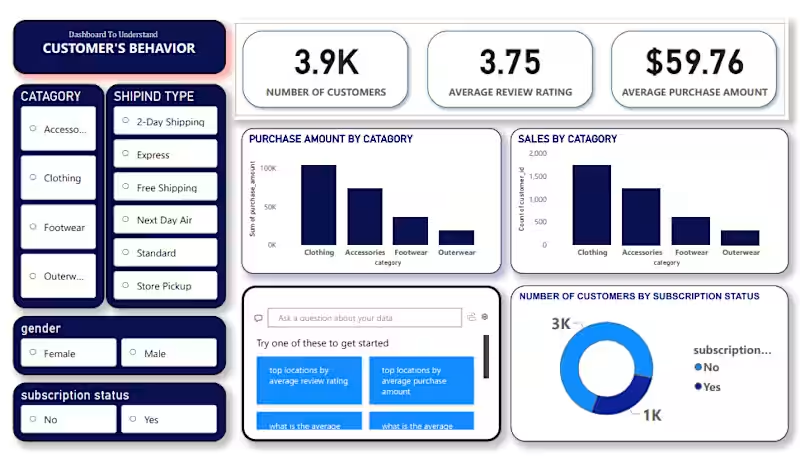
Sarbjot Singh
I’m excited to share my latest Data Analytics project where I analyzed Customer Shopping Behavior to uncover trends in sales, demographics, and purchasing habits.This project was a great exercise in building a complete data pipeline. The Tech Stack: Python (Pandas & NumPy): Used in Jupyter Notebooks for initial data exploration and statistical analysis. PostgreSQL: Utilized for rigorous data cleaning, querying, and structuring the dataset for analysis. Power BI: Built an interactive dashboard to visualize key metrics like seasonal trends, subscription impacts, and category performance. Project Highlights: ✅ Data Cleaning: Leveraged PostgreSQL and Pandas to handle missing values and standardize categorical data.
1
2
79
Message
0
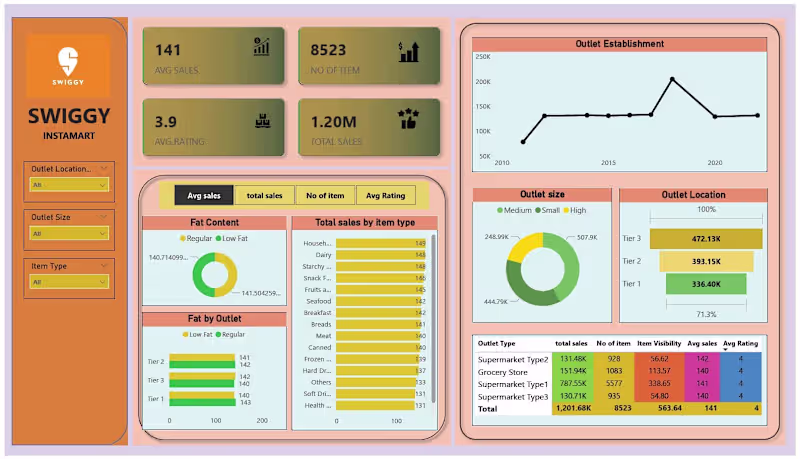
VARSHA ZOKE
Swiggy Instamart Sales Dashboard
0
80
Explore projects