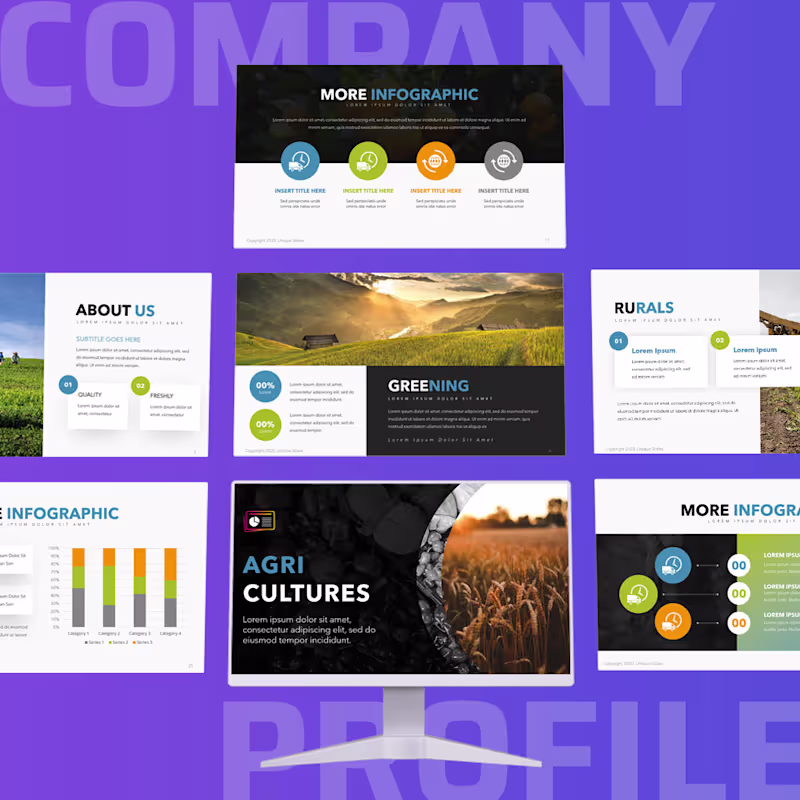
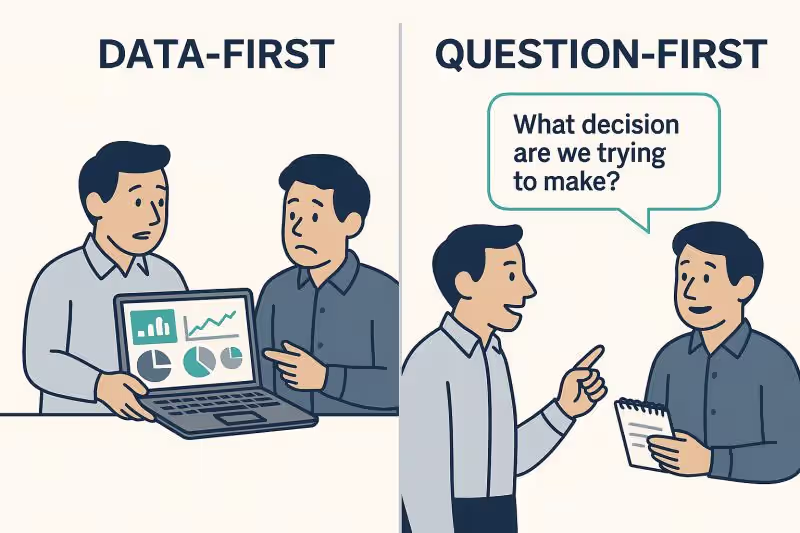
Data-Driven Strategies for Success
Data-Driven Strategies for Success


View more →
Efficient Market Research & Design Expert
Efficient Market Research & Design Expert


View more →
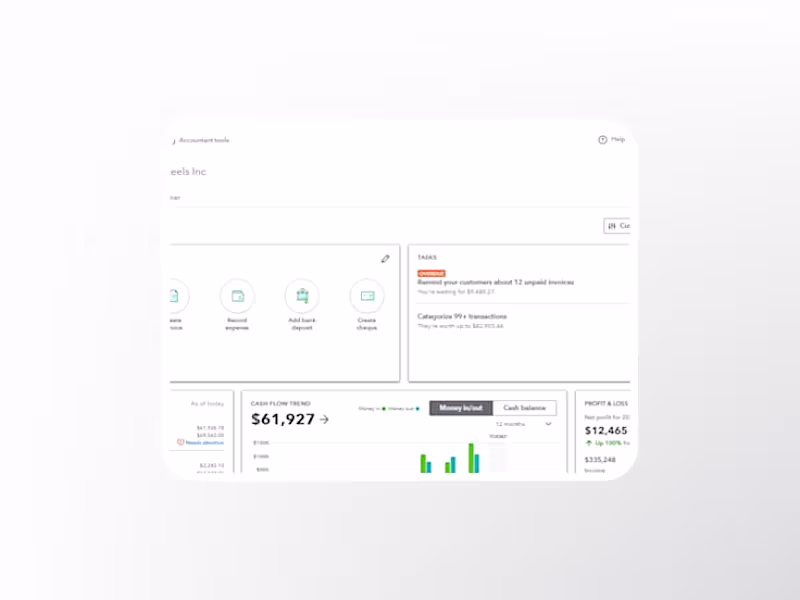
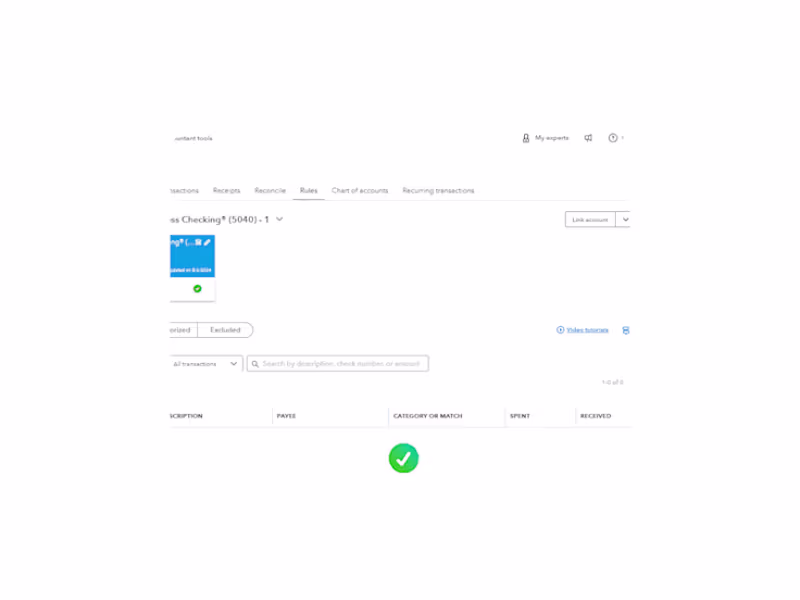
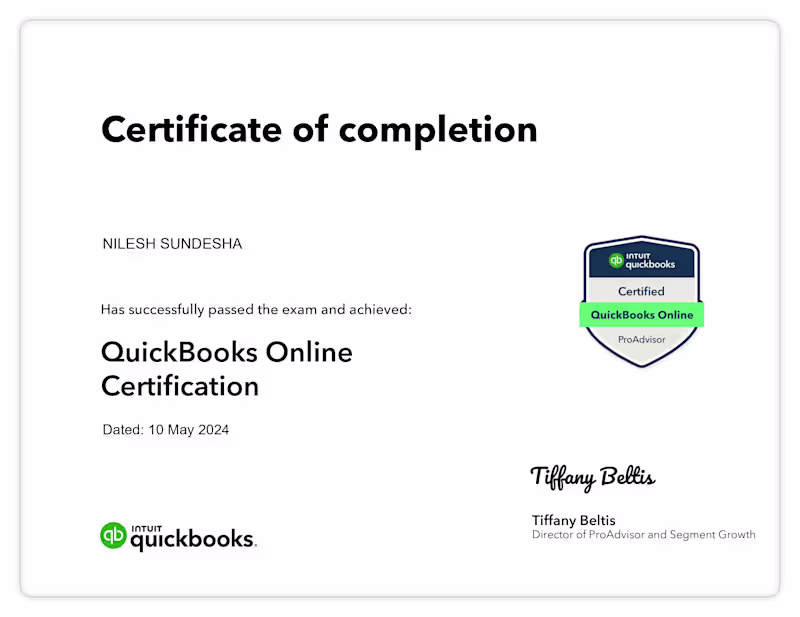
Quickbooks Online Bookkeeper - Proadvisor
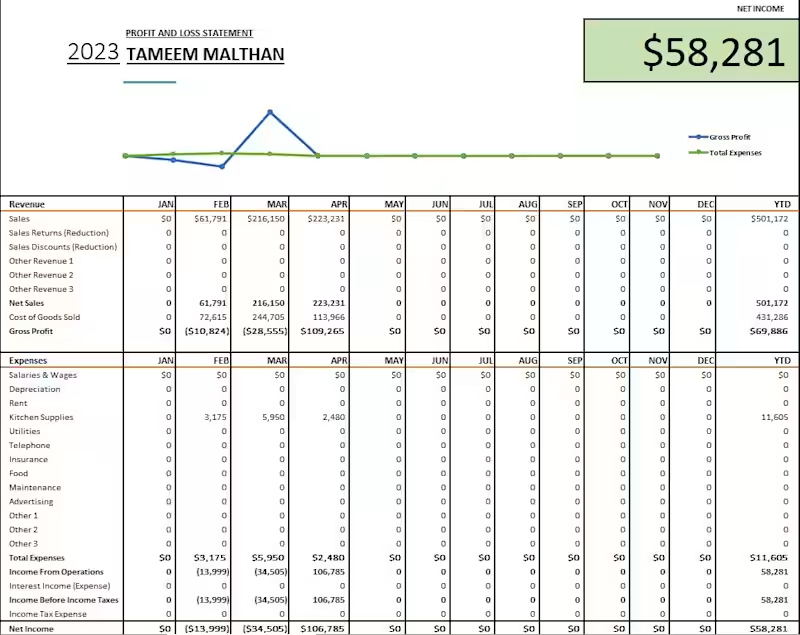
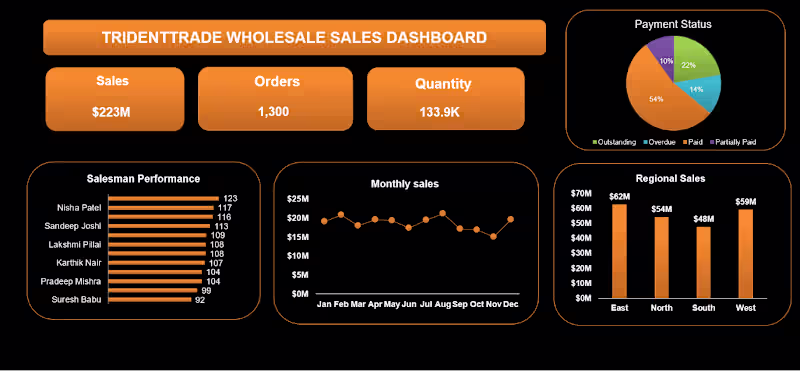
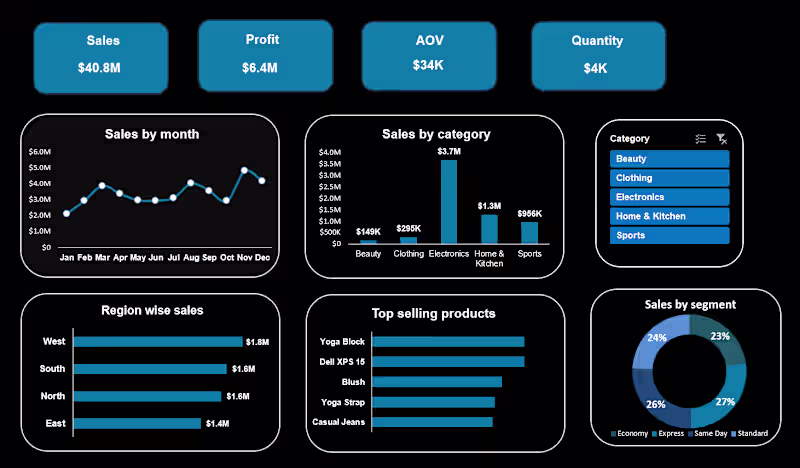
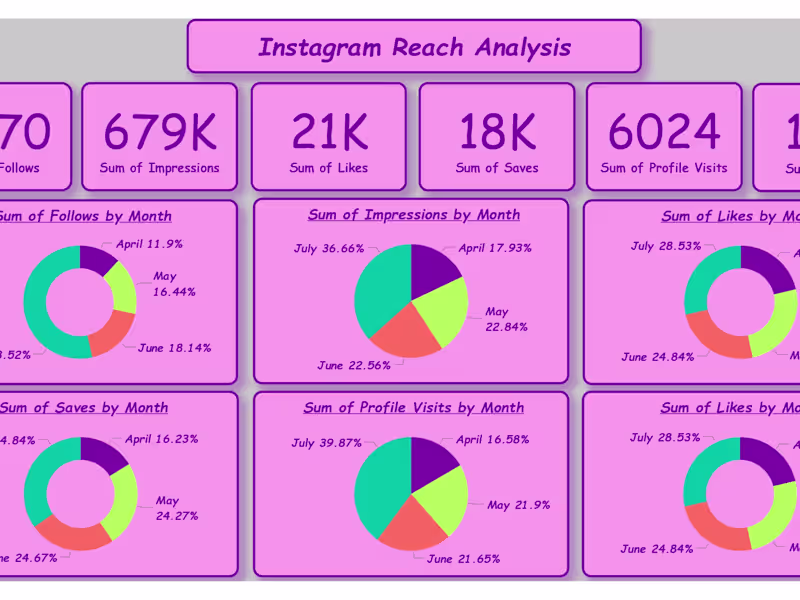
Excel dashboard specialist turning data to dashboards
- 32
- Followers
Excel dashboard specialist turning data to dashboards

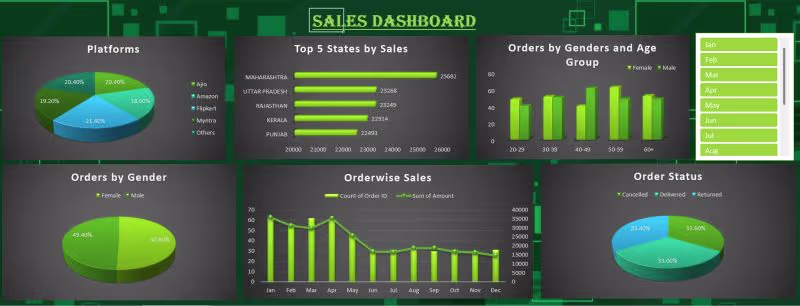
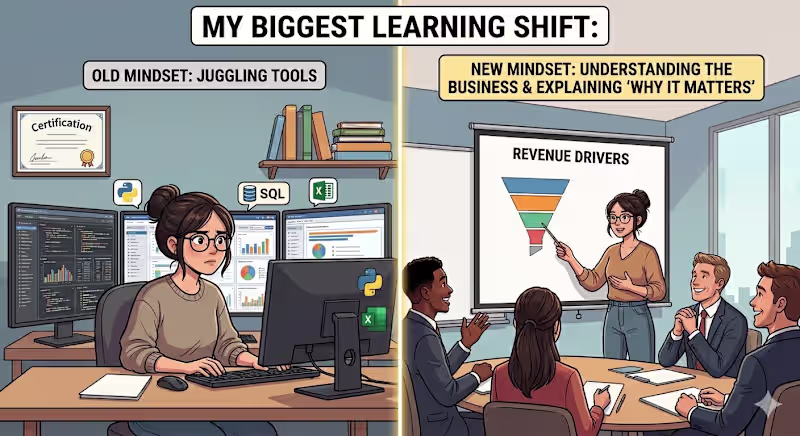
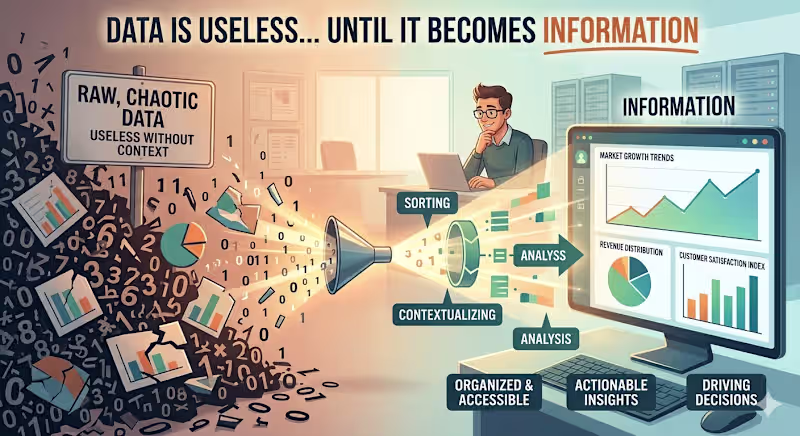
Data Analyst | Transforming raw data into clear insights.
Data Analyst | Transforming raw data into clear insights.
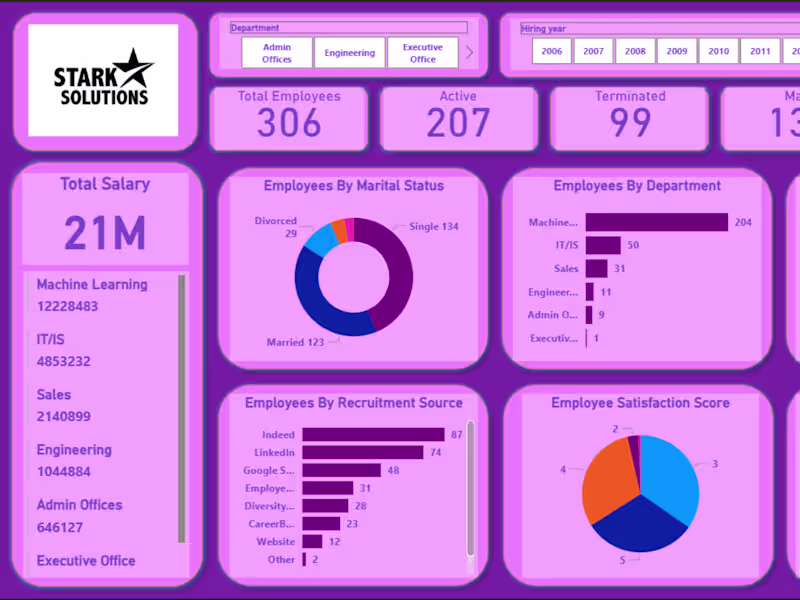
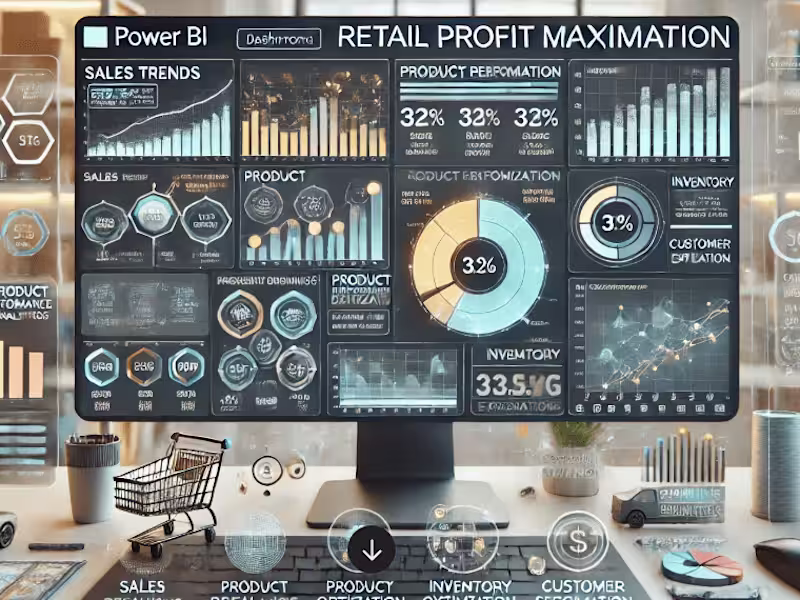
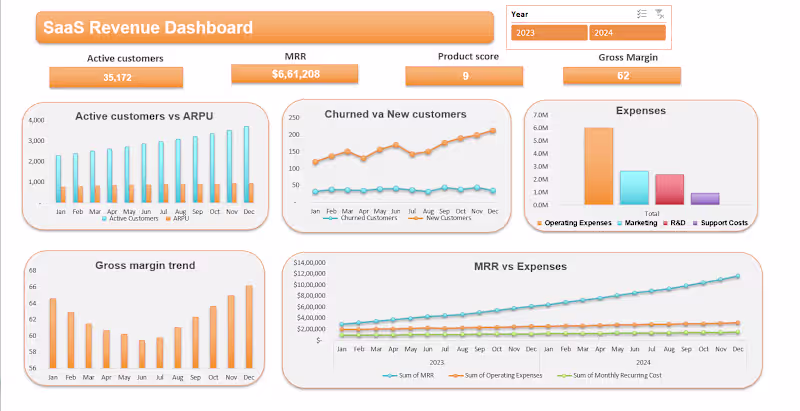
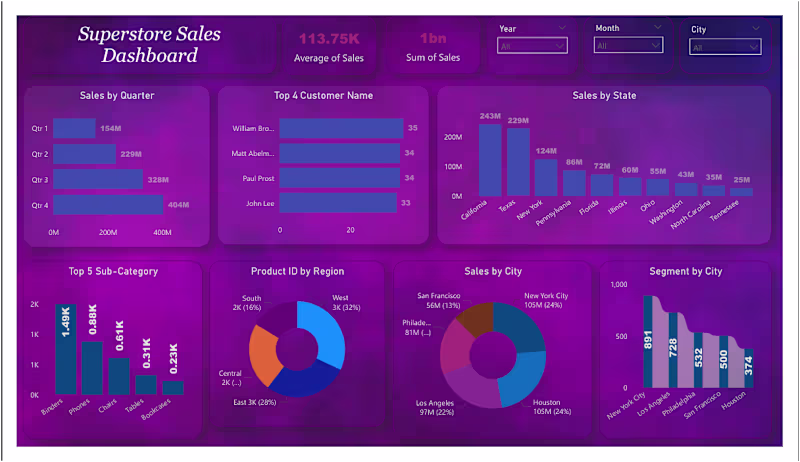
Power BI Data Analyst turning data into insights
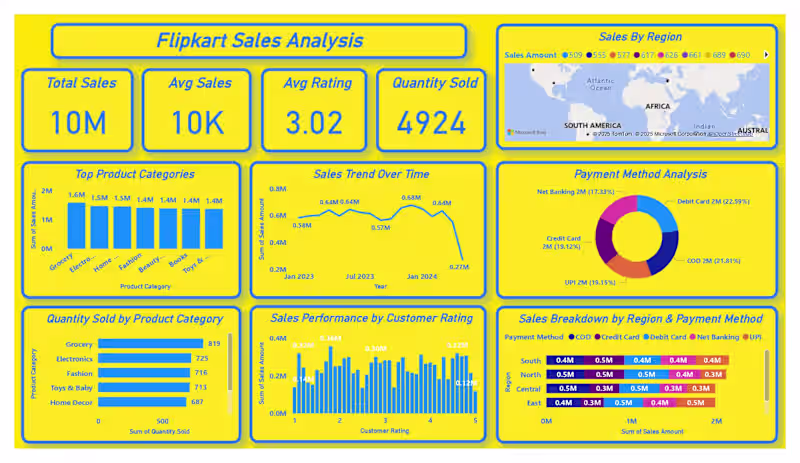
Google Certified GA4 Expert, Data Analyst, Looker Studio
Google Certified GA4 Expert, Data Analyst, Looker Studio


View more →
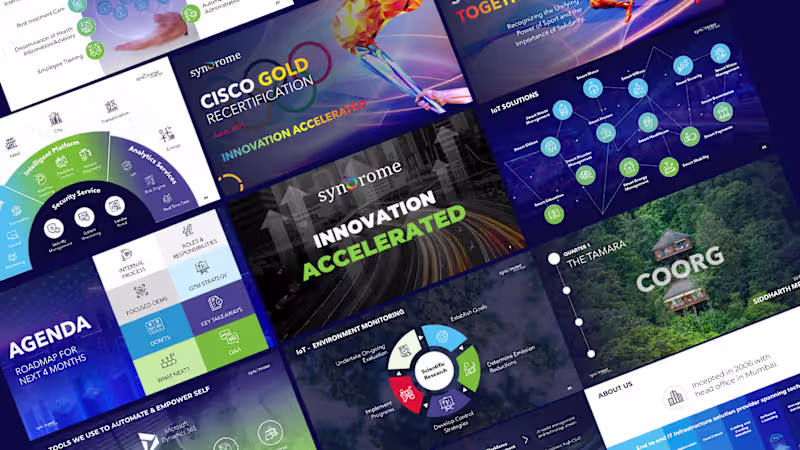
I am Presentation Designer and Visual Designer
I am Presentation Designer and Visual Designer