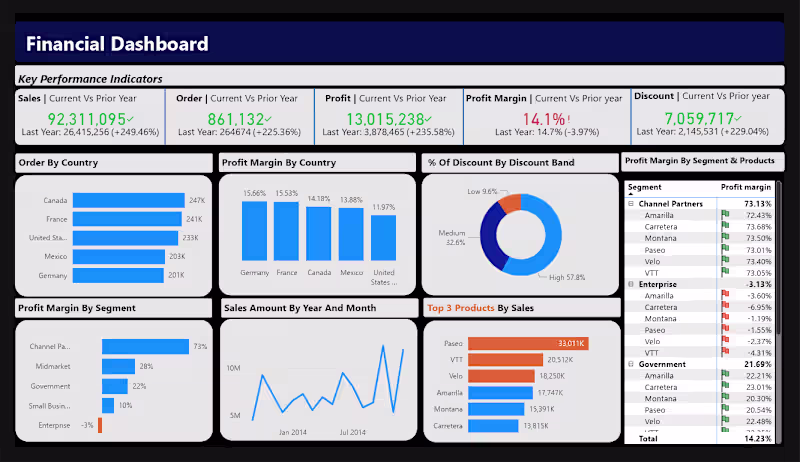
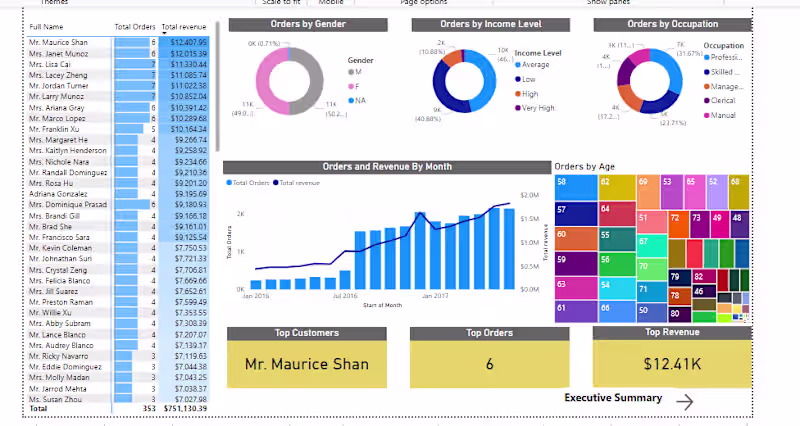
Projects using Microsoft Power BI in Pakistan
Sign Up
Post a job
Sign Up
Log In
Filters
2
Projects
People
Message
3
Tayyab Ali
Airlines Flights Data Visualization in Power BI Integrated with
3
103
Message
1
Devowise .
Epos Now - Azure-Powered Data Engineering Pipeline
1
28
Message
1
Shahid Iqbal
pro
Inventory Management System
1
9
Message
7
Arshia Nasir
pro
Turning Process Data into Visual Insight😯🤯 Process data alone doesn’t create insight. Visual structure does. By combining: • chemical engineering logic • clean graphic layouts • clear charts and flow visuals Raw data becomes decision-ready information. Engineering tells you what’s happening. Design shows you why it matters.🤠
2
7
258
Message
0
Nauman Khan
pro
Cyber Insurance & Security Threat Monitoring Portal
0
4
Message
0
KAZIM HAIDER SYED
🚀 Turning Raw Data into Smart Business Decisions Hi, I’m a passionate Data Analyst helping businesses transform complex data into clear insights, interactive dashboards, and growth-driven strategies. 💡 How I Can Help You: ✔ Data Cleaning & Processing ✔ Interactive Power BI Dashboards ✔ Excel Automation & Reports ✔ KPI Tracking & Business Insights ✔ Data Visualization ✔ SQL & Database Analysis ✔ Sales & Performance Reporting ✔ Trend & Customer Analysis 📊 Tools I Use: • Power BI • Excel • SQL • Python (Pandas, NumPy) • Tableau Whether you need a professional dashboard, automated reports, or meaningful insights from your data — I’m here to help your business grow with data-driven decisions. 📩 Let’s work together and turn your data into results.
0
165
Message
1
Hafsa Khan
In this project, I provide structured data solutions designed to improve business efficiency. My work focuses on maintaining high-accuracy databases through systematic data cleaning, formatting, and CRM integration. I also specialize in creating visual Excel dashboards that transform raw data into clear, actionable insights for B2B lead generation.
1
113
Message
1
Umair Nawaz
Customer Support Performance & SLA Analytics System
1
7
Message
0
Ali Hassan
Bikes Sales Analysis
0
238
Message
3
Ullah Atta
Project Title: Sales Performance Dashboard Using Power BI Description Example: Designed an interactive Power BI dashboard to track sales performance, revenue trends and monthly KPIs. Automated data transformation using Power Query and built dynamic Excel models for reporting accuracy. Tools Used: • Microsoft Excel • Power Query • Power BI
4
3
104
Message
0
Moez Khan
From reactive billing to predictive revenue intelligence in US Healthcare Revenue Cycle Management. Built an end-to-end denial prediction model using XGBoost, integrated with Excel, and deployed in Power BI to surface high-risk claims before submission. Predicts the likelihood of denial at the claim level Helps billing teams prioritize and prevent revenue loss Translates complex ML output into actionable insights. Turning raw data into proactive revenue protection, not just reporting.
0
54
Message
0
Adeel Khan
Social Media Advertisement Performance Dashboard Price range $200-$400 Project duration 7-30 days Industries Social Media Marketing +1
0
15
Message
1
Muneeb Shafique
Sales & Marketing Report by Muneeb
1
3
Message
1
Hashir Bhatti
I’m excited to share my Supply Chain Dashboard, built using Power BI. In this project, I focused strongly on UI/UX design to make the dashboard clean, simple, and easy to use. The goal was to present supply chain data in a clear way so users can quickly understand performance and key metrics. The dashboard shows important numbers using KPI cards and allows users to explore data with slicers and interactive visuals. It also includes smooth page navigation for a better user experience. This project is designed to support better, data-driven decisions through clear and visually engaging dashboards. I’d be happy to hear your feedback or thoughts on this project.
1
1
41
Message
0
Dawood Khan
Cleaned and automated 30,000+ rows of POS data using Power Query, reducing manual reporting time by 80%. Built an interactive Power BI dashboard tracking $6.29M in sales and 255K units sold across multiple locations. Delivered KPIs (YoY, MoM, WoW) and insights into top products and locations. Enabled faster decision-making by identifying high-performing areas and revenue opportunities through clear, real-time visuals.
0
27
Message
0
ALI JAN
Customer Shopping Trend Analysis Dashboard
0
3
Explore projects