Customer Shopping Trend Analysis Dashboard
ALI JAN
Customer Shopping Trend Analysis
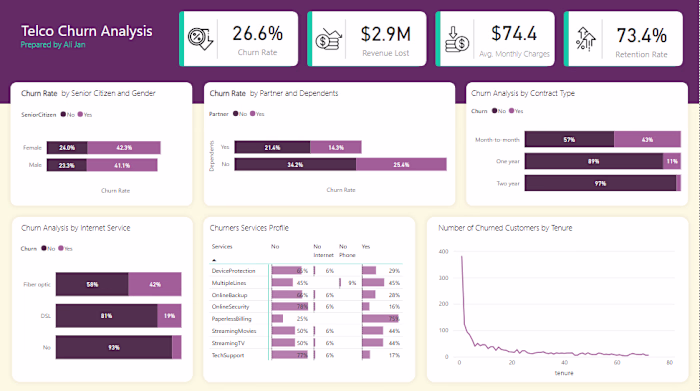
I recently developed a dashboard for a business to understand customer shopping behavior and purchasing trends across demographics, categories, seasons, and regions. Upon analyzing the data, several patterns emerged that highlight both strengths and opportunities for growth.
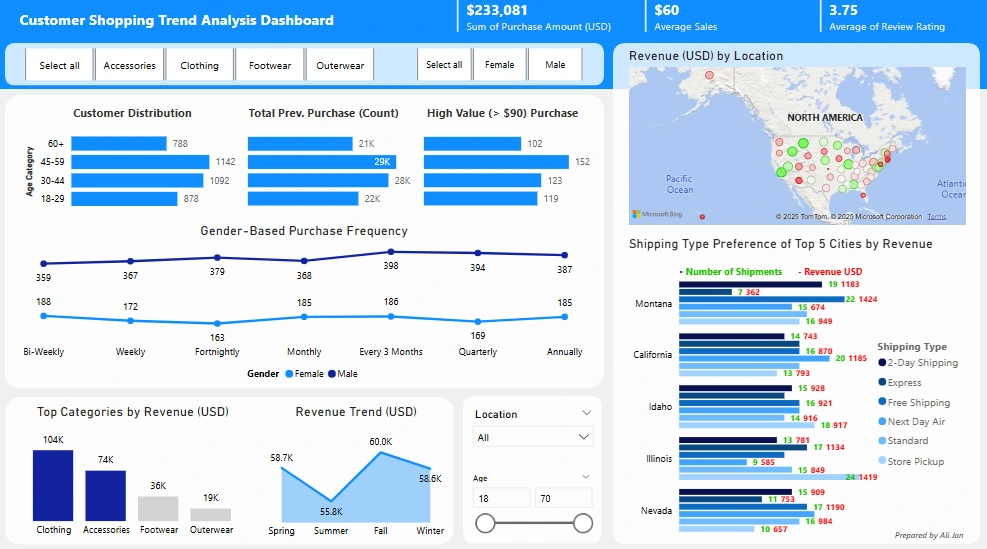
Customer purchases totaled $233,081, with an average sale value of $60 and an average review rating of 3.75, pointing to moderately satisfied customers. The most revenue came from Clothing ($104K), followed by Accessories ($74K), while categories like Outerwear and Footwear contributed significantly less.
The 45–59 age group stands out as the most valuable segment, with the highest number of total and high-value purchases. Not far behind are the 30–44 and 60+ age groups, showing potential for targeted expansion. Younger customers (18–29) made fewer high-value purchases, indicating a price sensitivity or lesser engagement with higher-ticket items.
Gender-based analysis revealed that male customers purchase more frequently than females across all buying intervals, from weekly to annually. This consistency may reflect either stronger product-market fit for male shoppers or more habitual purchasing patterns.
Seasonal trends show a relatively stable revenue distribution across Spring, Summer, Fall, and Winter, with a slight peak in Fall ($60K). This stability is a positive indicator for supply chain planning, allowing for balanced inventory flow year-round.
When it comes to fulfillment, shipping data from top-performing cities (Montana, California, Idaho, Illinois, Nevada) suggests a strong preference for Free Shipping and Store Pickup, especially in Illinois and Montana. Cities like Nevada and California lean more toward Next Day Air and 2-Day Shipping, reflecting possible urban demand for convenience or faster delivery expectations.
Summary:
Underlying these insights are a few important drivers. The 45–59 segment likely has higher disposable income and stronger brand affinity, explaining their higher purchase volume and value. Males purchasing more frequently may be linked to the types of products offered or more streamlined buying behaviors. The popularity of Clothing and Accessories stems from their broad appeal and frequent utility. In contrast, Outerwear and Footwear may be seen as seasonal or infrequent purchases. Lastly, the average review rating of 3.75 hints at potential friction in the customer experience—possibly around product quality, delivery speed, or service.
To capitalize on these findings, the business should:
Double down on marketing to the 45–59 age segment, using loyalty programs or exclusive deals to retain them.
Introduce incentives for younger demographics, such as bundle offers or milestone-based discounts, to drive high-value purchases.
Expand offerings in high-performing categories like Clothing, with curated collections or limited drops to spark interest.
Enhance the shipping strategy by promoting Free Shipping in regions that favor it and offering flexible upgrades in fast-delivery regions.
Investigate the root of customer dissatisfaction to lift the review score above 4.0—this may involve improvements in logistics, product descriptions, or post-purchase support.
Leverage Fall and Spring for major campaigns, since these seasons already perform well and could yield higher ROI with focused promotions.
These insights not only reveal who the most valuable customers are and what they prefer, but also offer clear direction for boosting satisfaction, retention, and revenue across multiple dimensions.
Loading this content connects you to GitHub Gist.
GitHub Gist privacy informationLike this project
Posted Jul 10, 2025
Developed a dashboard to analyze customer shopping trends and provided growth strategies.
Likes
0
Views
5