Freelancers using Microsoft Excel in Pakistan
Sign Up
Post a job
Sign Up
Log In
Filters
2
Projects
People
Devowise Studios
pro
Pakistan
Web Design Studio | Brand Identity | Framer & AI Solutions
$5k+
Earned
3x
Hired
5.0
Rating
124
Followers
expert
Expert
+4
Follow
Message
Web Design Studio | Brand Identity | Framer & AI Solutions
1
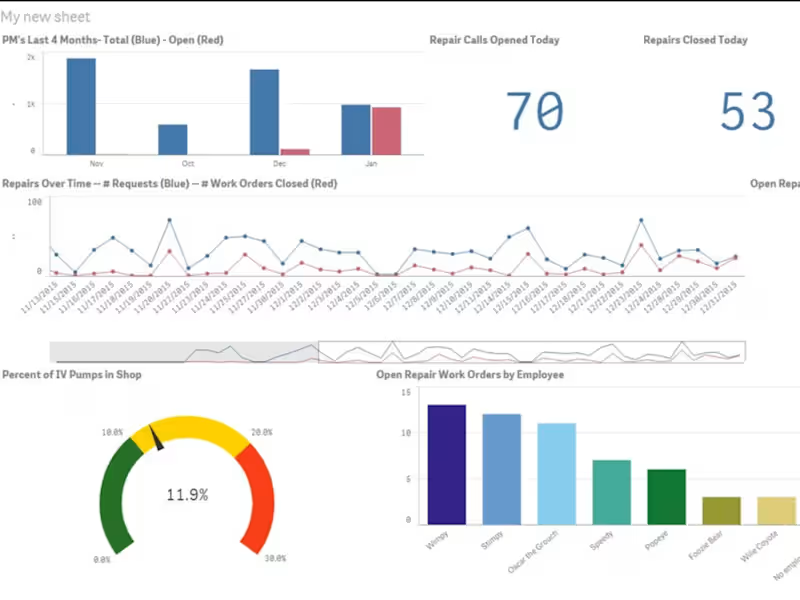
Qlik Sense BI Solution Development for Interactive Analytics
1
8
3
Clay – Modern Real Estate Website Development
3
19
3
NjeyTeam Website Development Project
3
10
2
Farmio Agriculture Website Design
2
4
Microsoft Excel
(1)
Follow
Message
Shahid Iqbal
pro
Bhakkar, Pakistan
AI Automation & Business Systems Expert | Make.com, Zapier
$5k+
Earned
4x
Hired
5.0
Rating
55
Followers
Expert
Follow
Message
AI Automation & Business Systems Expert | Make.com, Zapier
0
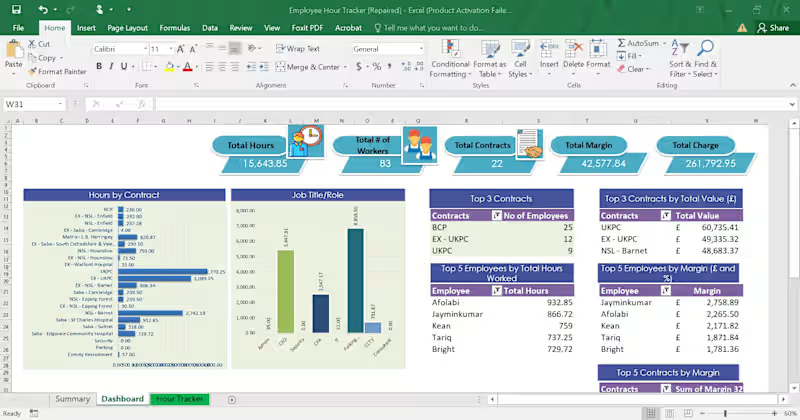
Just finished an Employee Hour Tracker + Dashboard in Excel ⏱️📊 It tracks total hours, workers, contracts, margin, and total charge, plus top employees/contracts with clean visuals so managers can see everything in seconds ✅ If you need an Excel tracker like this (hours, payroll, invoices, KPIs), I can build a custom version for your business, fast and easy to use.
0
146
1
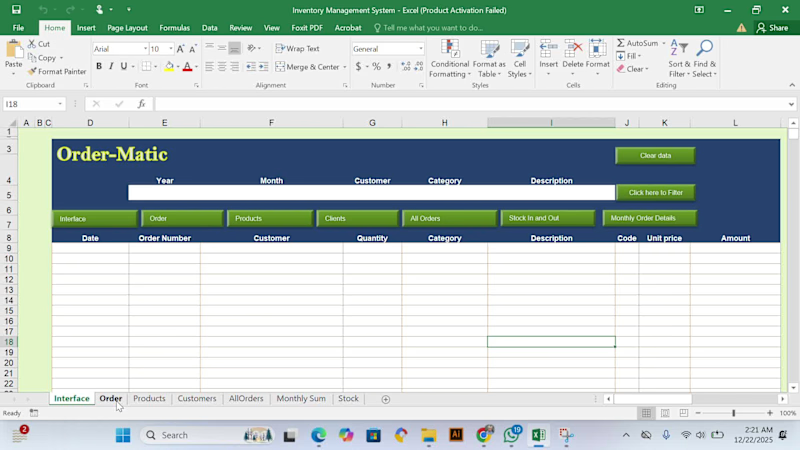
Inventory Management System
1
51
0
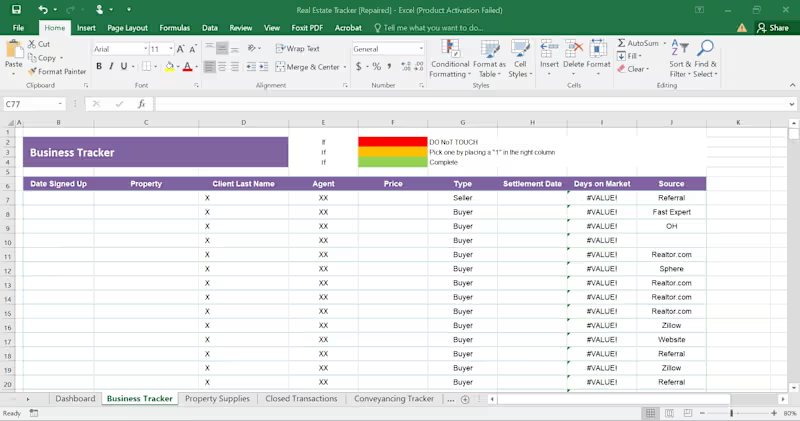
📊 Just completed a Real Estate Tracker in Excel, built to help agents and teams track deals, leads, and performance in one clean dashboard. It includes: 📈 Sales summary by agent 🧲 Lead tracking (weekly + pipeline stages) 🏠 Properties by buyer/rental/seller ✅ Tabs for business tracking, property supplies, closed transactions, and conveyancing flow If you need a custom Excel tracker for your real estate business (leads, listings, closings, commissions), message me, and I’ll build it around your workflow.
0
223
0
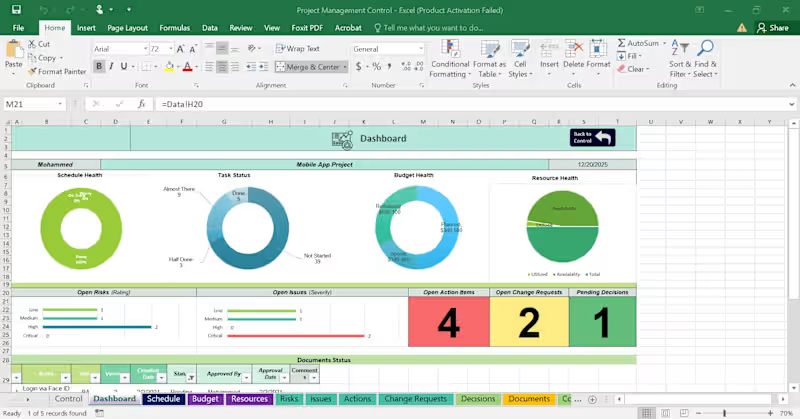
📊 Just built a Project Management Control Dashboard in Excel, a full command center to track project health in one place. It shows: ✅ Schedule, budget & resource health (visual dashboards) 📌 Task status (done / in progress / not started) ⚠️ Risks, issues, and action items with severity tracking 🔁 Change requests + pending decisions so nothing gets missed 📂 Clean tabs for control, schedule, budget, resources, risks, docs, and more If you want a custom Excel PM system for your team (easy to update + executive-ready reporting), message me, and I’ll build it for your workflow.
0
208
Microsoft Excel
(4)
Follow
Message
Faiz Khan
pro
Karachi, Pakistan
I help B2B teams find verified leads & decision-makers
5.0
Rating
14
Followers
Follow
Message
I help B2B teams find verified leads & decision-makers
0
Commercial Cleaning Company Research for Growth-Stage Prospects
0
2
0
Private Equity Buyer Research & Verified Decision-Makers
0
2
0
Beyond lead lists, I also work as a research VA, if you need someone to dig, verify, and organize instead of just generate leads. Some of what this looks like in practice: Deep-dive research on companies, people, or markets before a big decision or pitch Building and cleaning up messy spreadsheets/CRMs so your data is actually usable Verifying and updating outdated contact lists you already have Competitor research, market mapping, or investor/vendor research General admin-heavy research tasks that eat up hours you don't have Same process I use for lead gen: public sources, manual verification, no guessing, no scraped junk data. If you've got a research task sitting on your to-do list that never gets done because it's too time-consuming, that's exactly what I take off your plate. Send me a message and tell me what you need dug up.
0
202
0
Bulk Contact Finder — Extract Verified Decision-Makers From Any Website, Instantly Manually LinkedIn aur Google pe kisi CEO ka email dhoondhna time-waste hai. Bulk Contact Finder se aap sirf domains ki list paste karte hain aur seconds mein Founders, CEOs, Directors & Owners ke verified contacts mil jaate hain — ek click mein CSV export ke saath. Sales teams, agencies, recruiters aur founders ke liye bana hai jo outreach ke liye clean, ready-to-use B2B lists chahte hain — bina manual scraping ke. ✅ Bulk domain processing — no manual research ✅ Verified decision-maker emails ✅ One-click CSV export ✅ Built for outreach at scale 👉 Try it: bulkcontactfinder.com (http://bulkcontactfinder.com)
0
123
Microsoft Excel
(3)
Follow
Message
Tabish Khan
Karachi, Pakistan
I fix warehouse chaos SOPs, SAP & Excel system for ops team
5.0
Rating
10
Followers
Follow
Message
I fix warehouse chaos SOPs, SAP & Excel system for ops team
0
Why ERP systems like SAP, Oracle, and Odoo won't save your business — and what will After years in FMCG warehouse operations and now working as a freelance supply chain consultant, I keep seeing the same mistake in local industries across Pakistan. Every business owner, every operations manager, every CEO believes the same thing: "If we get SAP, everything will be fixed." It won't. Here's why — and what actually will. The misconception ERP systems — SAP, Oracle, Odoo, Microsoft Dynamics — are seen as the solution to every operational problem. Inventory inaccurate? Get an ERP. Deliveries delayed? Get an ERP. Team making mistakes? Get an ERP. But this thinking gets it completely backwards. ERP systems are tools. Powerful ones. But they are only as good as the humans using them — and humans, trained or untrained, make mistakes every single day in every single company. What I saw firsthand I consulted with a company that had spent millions implementing SAP. Six months after go-live, their inventory data was still wrong. The reason? Nobody had agreed on what a "received" delivery actually meant. Was it received when the truck arrived? When the goods were scanned? When they were inspected? When they were put away in the correct location? No SOP. No definition. No standard. Every operator decided for themselves. The ERP logged whatever they entered. Garbage in. Garbage out. SAP didn't cause the problem. The missing process did. SAP just made it faster and more expensive. The truth about AI Now everyone is talking about AI as the next fix. AI will not save you either. AI works on specific, structured, accurate knowledge. If your fundamentals are missing — if your SOPs don't exist, your processes aren't documented, your data isn't clean — AI has nothing meaningful to work with. I've seen this firsthand too. A business tried to use AI-powered demand forecasting on inventory data that hadn't been accurately recorded for 18 months. The AI produced confident, detailed forecasts. Every single one was wrong — because the underlying data was wrong. The AI wasn't the problem. The missing process was. What actually holds a company together The backbone of every thriving operation is not its software. It's its systems and fundamentals: → SOPs — documented, followed, and updated regularly → Work processes — clear steps that any trained team member can follow → SLAs — defined expectations between teams, suppliers, and customers → Data standards — everyone agrees on what "received", "dispatched", and "completed" actually mean Get these right first. Then your ERP becomes powerful — because it's recording accurate, consistent data. Then your AI becomes useful — because it has clean data to learn from. Then your team stops making the same mistakes every quarter — because there's a standard to follow. The formula Software is the amplifier. Your fundamentals are the signal. If the signal is broken, no amplifier in the world will fix it. What this means for your business Before your next software investment, ask these questions: Do we have documented SOPs for our core processes? Does every team member know what "done" means for their task? Are our SLAs defined and measured? Is our data accurate enough to trust? If the answer to any of these is no — fix that first. The software can wait. Need help with this? This is exactly what my Warehouse SOP Audit service covers. In 5 days I'll review your current processes, identify where your fundamentals are missing, and give you a prioritised action plan — before you spend another rupee on software. 👉 Book a discovery call or view my services below. https://contra.com/tabish_khan_r5d8g4t1/services?r=tabish_khan_r5d8g4t1
0
12
0
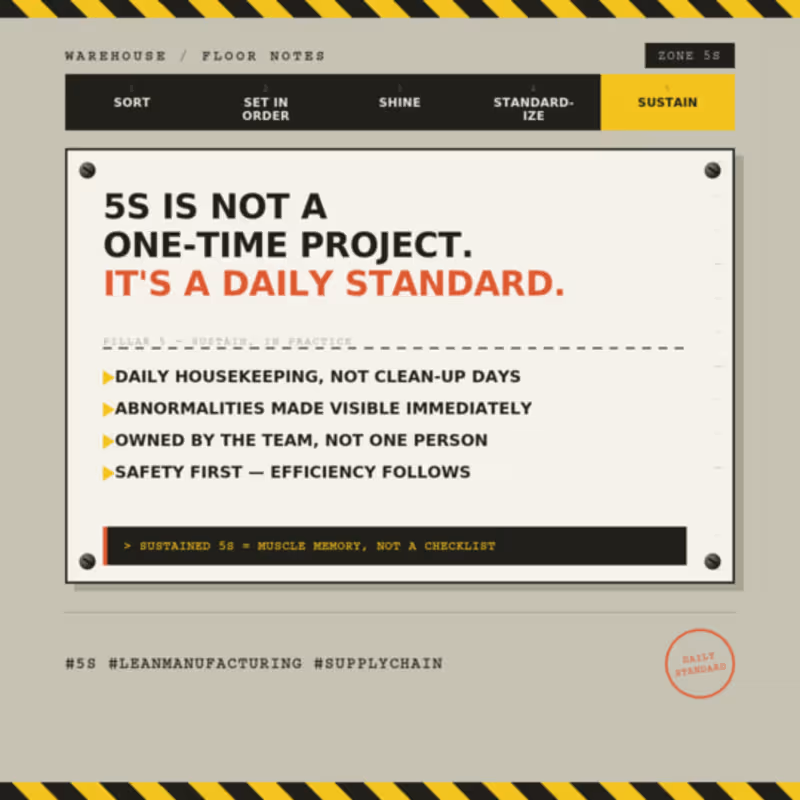
5S is not a one-time project. It's a daily standard. When I first got involved in 5S implementation, I thought of it as a launch event — clean the area, label the bins, take a few before/after photos, done. I was wrong. The real work starts after the launch. 5S only holds if it's checked, audited, and corrected every single day — not once a quarter, not when an audit is scheduled. A few things that made the difference for us: → Daily housekeeping checks, not scheduled "clean-up days" → Making abnormalities visible immediately, not filed away for later → Treating 5S as a discipline the team owns, not a task assigned to one person → Tying it directly to safety — a disorganized warehouse is a safety risk before it's an efficiency one The warehouses that sustain 5S long-term are the ones where it stops being "a project" and becomes muscle memory — something the team does without being told. It's not glamorous. But it's one of the few things that quietly improves safety, accuracy, and efficiency all at once — every single day.
0
107
0
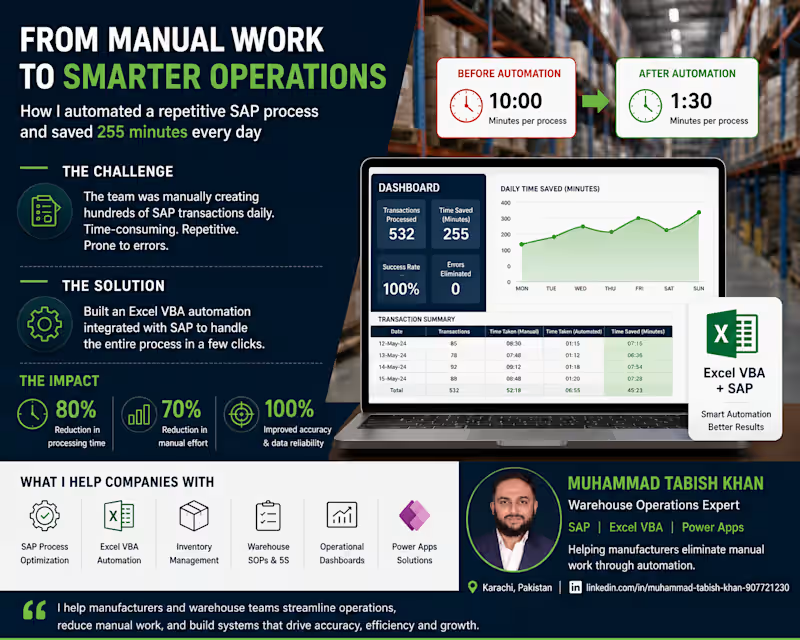
The most expensive warehouse problem usually isn't inventory. It's repetitive work. Recently, I analyzed a warehouse process where the team was manually creating SAP transactions every day. The process itself wasn't difficult—it was just repeated hundreds of times. By building an Excel VBA automation integrated with SAP, I was able to: ✅ Reduce processing time by around 80% ✅ Cut manual effort by 70% ✅ Eliminate repetitive data entry ✅ Allow the team to focus on operational decisions instead of administrative work The best part? It required zero additional software investment. We improved the existing process instead of replacing it. Many companies believe they need a new WMS or another expensive platform. In reality, the biggest opportunities often come from improving the systems they already have. I specialize in helping manufacturing and warehouse teams streamline operations through: • SAP process optimization • Excel VBA automation • Warehouse SOP development • Inventory management improvements • Custom operational dashboards • Power Apps solutions If your warehouse team spends hours every week on repetitive tasks, there is probably a faster way. Let's optimize the process before investing in new software.
0
135
0
In 15 minutes, I can usually find at least one thing that's costing a warehouse time or money. Sometimes it's a layout issue. Sometimes it's a process that made sense two years ago but doesn't anymore. Sometimes it's a blind spot the team is too close to see. I've done this across FMCG facilities — and this month, I'm offering free 15-minute virtual audits to a handful of operations. Here's what you get: → A virtual walkthrough of your warehouse → A written summary of what I observe → Zero obligation, zero sales pitch If you're running a warehouse and curious what an outside eye might catch — let's talk. Comment below or send me a DM to claim a spot.
0
64
Microsoft Excel
(8)
Follow
Message
Darakhshan Zahid
Karachi, Pakistan
Dashboard & Data Analytics Expert
New to Contra
Follow
Message
Dashboard & Data Analytics Expert
0
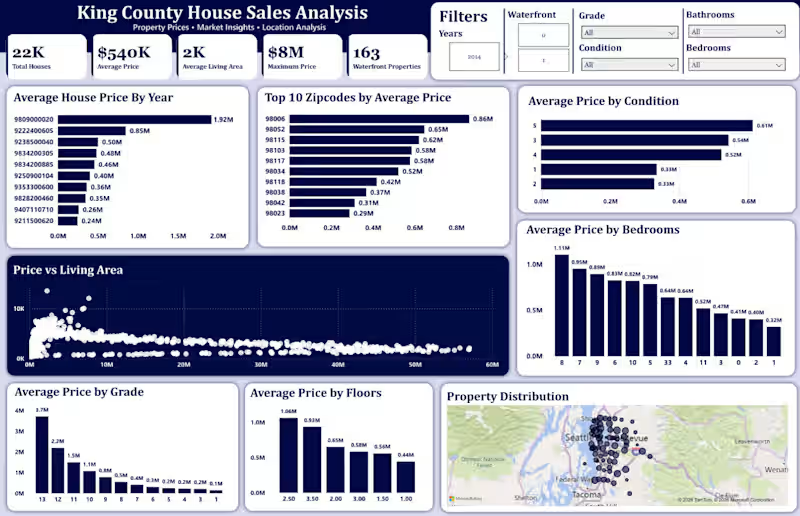
Finally wrapped up the Power BI dashboard for my House Sales Analysis project 🏠📊 After cleaning and exploring the data with Python and writing SQL queries, I used Power BI to turn the analysis into an interactive dashboard. In the dashboard, I explored: House price trends Property size and pricing House grades Waterfront vs non-waterfront properties Location-wise pricing Bedrooms and other property features I also worked with DAX measures, slicers, interactive visuals, and KPIs to make the dashboard more useful for exploring the data. This project helped me practice the complete data analytics workflow: Python → Data Cleaning & EDA → SQL → Power BI Still learning and improving with every project. 🚀 #PowerBI #DataAnalyst #DataAnalytics #SQL #Python #EDA #DataCleaning #DAX #BusinessIntelligence #DataVisualization #PowerBIDashboard #PortfolioProject #DataAnalysis
0
29
0
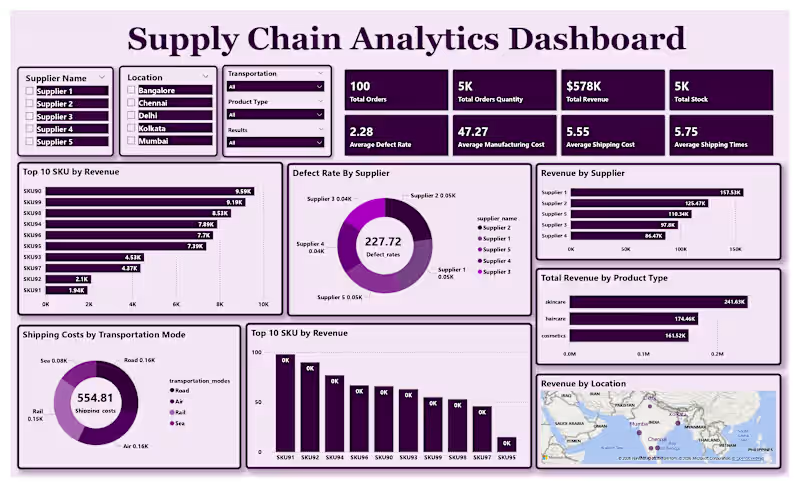
Supply Chain Performance Dashboard 📦📊 Efficient supply chains drive better business outcomes. This dashboard transforms operational data into actionable insights for inventory, logistics, and fulfillment performance. Using Power BI, I analyzed key supply chain metrics such as order status, inventory levels, shipping performance, supplier efficiency, delivery timelines, and overall operational KPIs. The interactive dashboard helps identify bottlenecks, optimize inventory, and support data-driven decision-making. Tools Used: Power BI SQL Python (Data Cleaning & Analysis) Key Skills: Supply Chain Analytics | Inventory Analysis | Logistics Analytics | KPI Dashboard | Business Intelligence | Data Visualization | Data Cleaning | SQL | Power BI | Python | Business Analytics #PowerBI #SupplyChain #SupplyChainAnalytics #Logistics #InventoryManagement #BusinessIntelligence #DataAnalytics #DashboardDesign #SQL #Python #DataVisualization #BusinessAnalytics #PortfolioProject #DataAnalyst
0
56
0
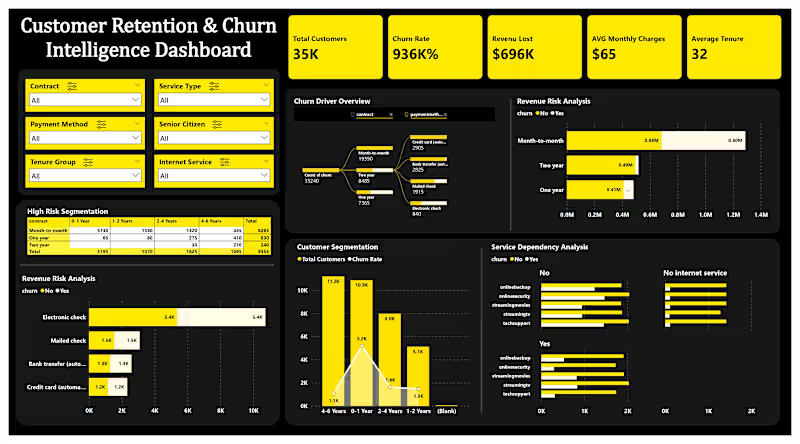
Telecom Customer Churn Analysis Dashboard 📊 Understanding why customers leave is essential for improving retention and business growth. In this Power BI dashboard, I analyzed a telecom customer churn dataset to identify key churn drivers, customer demographics, contract types, monthly charges, payment methods, and tenure patterns. The dashboard provides interactive KPIs and visual insights that help businesses make data-driven decisions to reduce customer churn. Tools Used: • Power BI • SQL • Python (Data Cleaning & Analysis) Key Skills: Customer Churn Analysis | Data Cleaning | Data Visualization | KPI Dashboard | Business Intelligence | Interactive Reports | Data Analytics | Business Insights #PowerBI #DataAnalytics #BusinessIntelligence #CustomerChurn #DashboardDesign #SQL #Python #DataVisualization #BusinessAnalytics #DataAnalyst #PortfolioProject #DataDrivenDecisionMaking
0
56
0
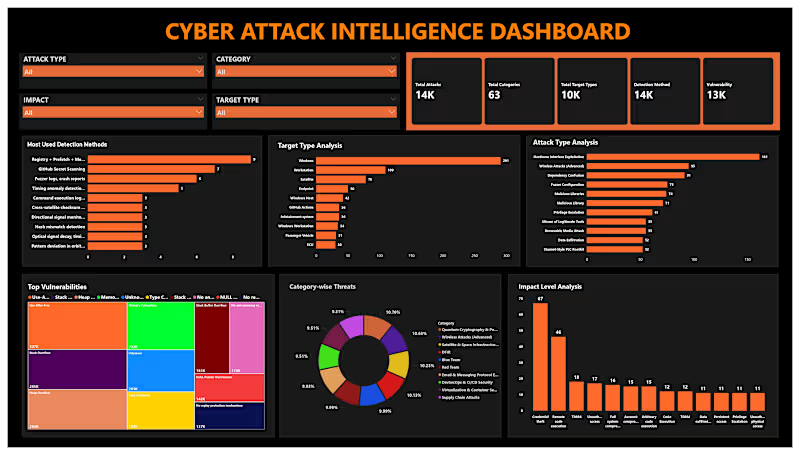
Cyber Security Analytics Dashboard 🔐📊 Cybersecurity is more than detecting threats—it's about turning security data into actionable insights. In this Power BI dashboard, I analyzed cybersecurity data to monitor security incidents, attack patterns, threat severity, affected systems, and overall security KPIs. The interactive dashboard helps organizations identify risks, improve monitoring, and support faster, data-driven security decisions. Tools Used: Power BI SQL Python (Data Cleaning & Analysis) Key Skills: Cyber Security Analytics | Threat Analysis | Security Dashboard | Risk Analysis | Incident Monitoring | Data Visualization | Business Intelligence | SQL | Python | Power BI | Data Analytics #PowerBI #CyberSecurity #CyberSecurityAnalytics #ThreatIntelligence #DataAnalytics #BusinessIntelligence #DashboardDesign #SQL #Python #DataVisualization #DataAnalyst #PortfolioProject #SecurityAnalytics
0
53
Microsoft Excel
(3)
Follow
Message
Dilawar Rajput
Khushāb, Pakistan
Helping Businesses Work Smarter & Grow Better
New to Contra
Follow
Message
Helping Businesses Work Smarter & Grow Better
0
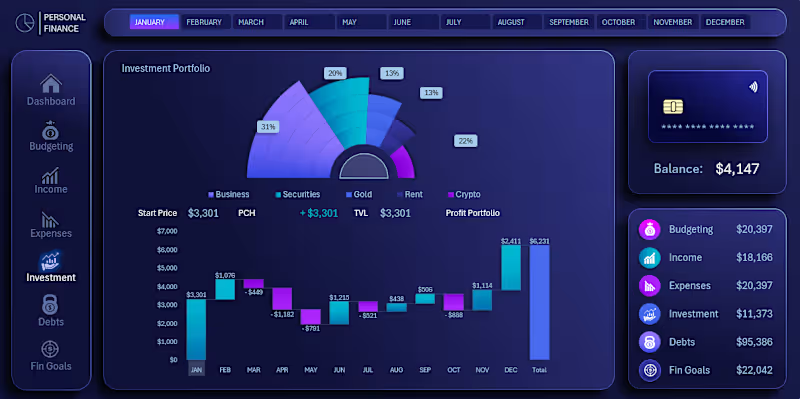
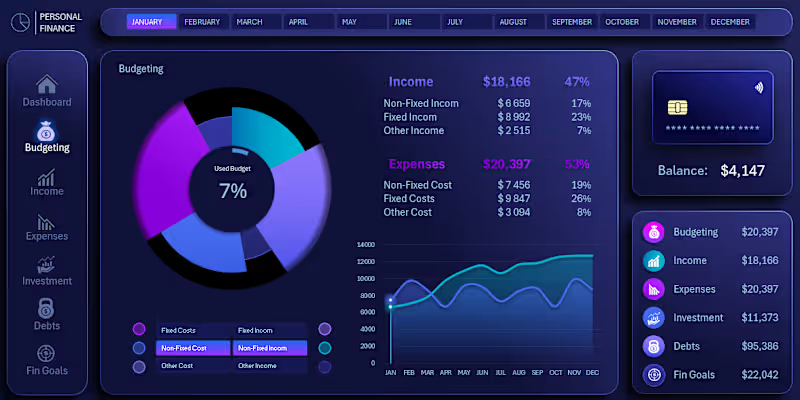
Investment Management Designed an organized Investment Management system in Microsoft Excel to help businesses track and monitor their investment portfolio, investment transactions, returns, current values, and overall portfolio performance. The system provides a centralized view of investments such as stocks, bonds, mutual funds, fixed deposits, real estate, and other business investments, allowing users to monitor investment costs, current values, expected returns, and profitability. Key Features Centralized investment portfolio tracking Investment name, type, and profile management Investment amount and purchase date tracking Current market value monitoring Expected return rate tracking Investment purchase and contribution records Withdrawal and investment sale tracking Dividend and interest income tracking Capital gains monitoring Cost basis vs. current value comparison Unrealized gain/loss analysis ROI and investment performance tracking Portfolio diversification analysis Investment maturity and renewal alerts Investment performance reports Project Focus Investment Management • Portfolio Tracking • ROI Analysis • Financial Analytics • Excel Dashboard • Investment Reporting
0
7
0
Budgeting & Forecasting Designed a structured Budgeting & Forecasting system in Microsoft Excel to help businesses plan their finances, monitor spending, compare actual performance with planned budgets, and make better financial decisions. The budgeting system allows users to create budgets for different categories, departments, or projects across monthly, quarterly, and yearly periods. Actual financial results can then be compared with budgeted amounts to identify spending differences and performance gaps. Key Features Monthly, quarterly, and yearly budget planning Category-wise budget management Department and project-based budgeting Actual vs. budget comparison Variance amount and percentage analysis Expense monitoring against planned budgets Financial performance tracking Historical data-based forecasting Cash flow and profitability forecasting Budget threshold and overspending alerts Visual charts and financial summaries Easy-to-understand Excel dashboard layout Project Focus Budget Management • Financial Planning • Forecasting • Variance Analysis • Excel Dashboard • Business Finance
0
11
0
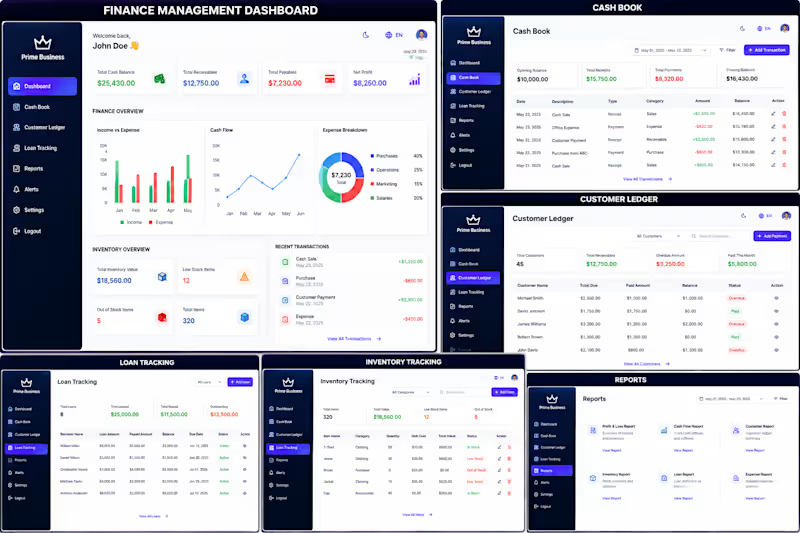
Finance Management Dashboard Designed a professional Finance Management Dashboard in Microsoft Excel to provide a clear overview of a business's financial performance, cash position, income, expenses, profitability, and outstanding balances. The dashboard brings important financial information into one organized interface, making it easier to monitor business performance and review financial data without working through multiple separate spreadsheets. Key Features Financial KPI Dashboard: Revenue, expenses, gross profit, net profit/loss, accounts receivable, and accounts payable. Income Management: Track income by source, category, amount, tax, payment method, account, and date. Expense Management: Organize operating, administrative, payroll, tax, capital, and miscellaneous expenses. Cash Flow Monitoring: Track money coming in and going out across business accounts. Customer/Client Ledger: Maintain transaction history, payments, running balances, and outstanding amounts. Supplier/Vendor Ledger: Track purchases, payments, balances, and amounts owed to suppliers. Bank & Cash Management: Monitor account balances, transfers, deposits, withdrawals, and reconciliation. Budget Tracking: Compare actual financial performance against planned budgets and identify variances. Profit & Loss Analysis: Review revenue, costs, expenses, gross profit, operating profit, and net profit. Financial Reporting: Structured financial reports for reviewing business performance over different periods. Data Visualization: Charts and visual summaries for sales, revenue, expenses, profit, and cash flow trends. Date-Based Analysis: Review financial performance by different time periods and compare historical results. Project Focus Finance Management • Business Analytics • Financial Dashboard • Excel Dashboard • Data Management • Financial Reporting • Business Operations
0
14
0
A professional Finance Management Dashboard designed to help businesses organize and monitor their financial activities in one place. The dashboard provides a clean and easy-to-use interface for tracking income, expenses, cash flow, customer transactions, loans, financial summaries, and reports. The design focuses on clear data presentation, simple navigation, and practical business use. This work sample demonstrates my ability to design professional business dashboards, financial management interfaces, data-driven layouts, and user-friendly web application interfaces with a focus on usability and organized information. Key Features: Finance overview and financial summaries Income and expense tracking Cash book management Customer ledger Loan tracking Financial reports Clean and responsive dashboard interface Organized data visualization Business-focused UI/UX design
0
20
Microsoft Excel
(4)
Follow
Message
Ateeb Syed
Karachi, Pakistan
DTC brand-to-growth strategist for launches and scale
New to Contra
Follow
Message
DTC brand-to-growth strategist for launches and scale
0
ECS: Omnichannel Growth with 53% Higher Digital Sales
0
4
0
KIKO Milano: Paid Media Growth to 5X ROAS
0
2
0
Urban Hydration: Amazon PPC ACOS Cut from 104.85% to 32.37%
0
4
0
Holy Raw: Brand Identity and Packaging Built for Launch
0
5
Microsoft Excel
(3)
Follow
Message
Mehboob Ur Rehman
Islamabad, Pakistan
QuickBooks Accountant & E-Commerce Bookkeeper
New to Contra
Follow
Message
QuickBooks Accountant & E-Commerce Bookkeeper
0
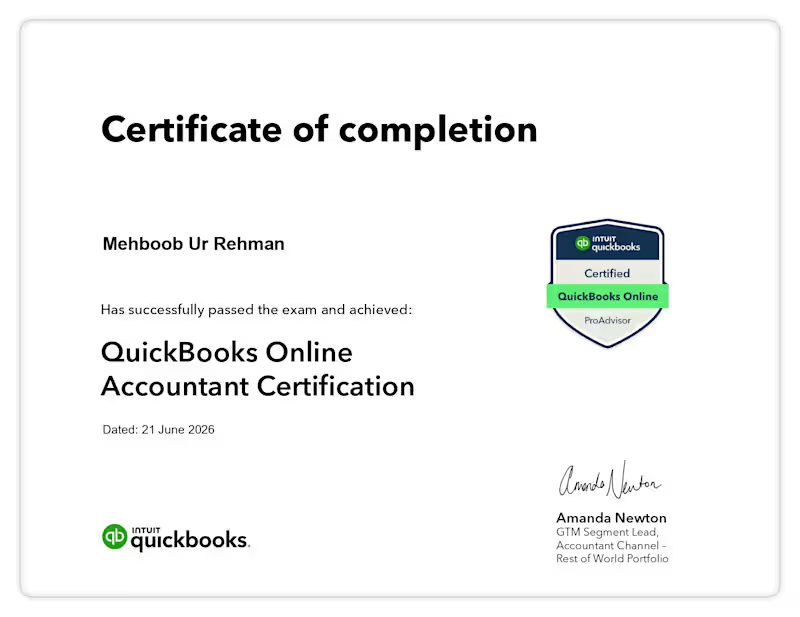
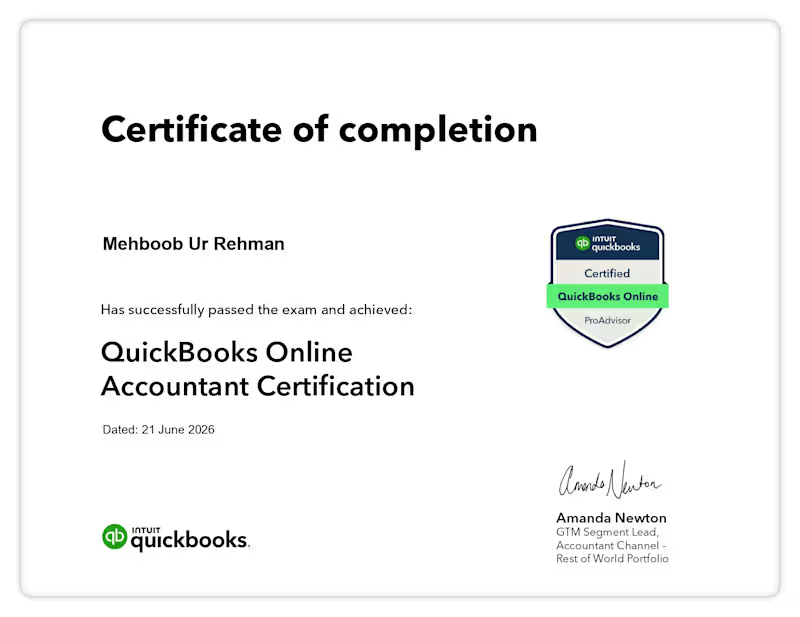
I have successfully completed professional training in QuickBooks, gaining practical knowledge of bookkeeping, company setup, chart of accounts, transaction recording, invoicing, expense management, bank reconciliation, financial reporting, and other essential accounting functions. This certification reflects my commitment to developing professional accounting and bookkeeping skills and applying QuickBooks effectively in real-world business environments.
0
13
0
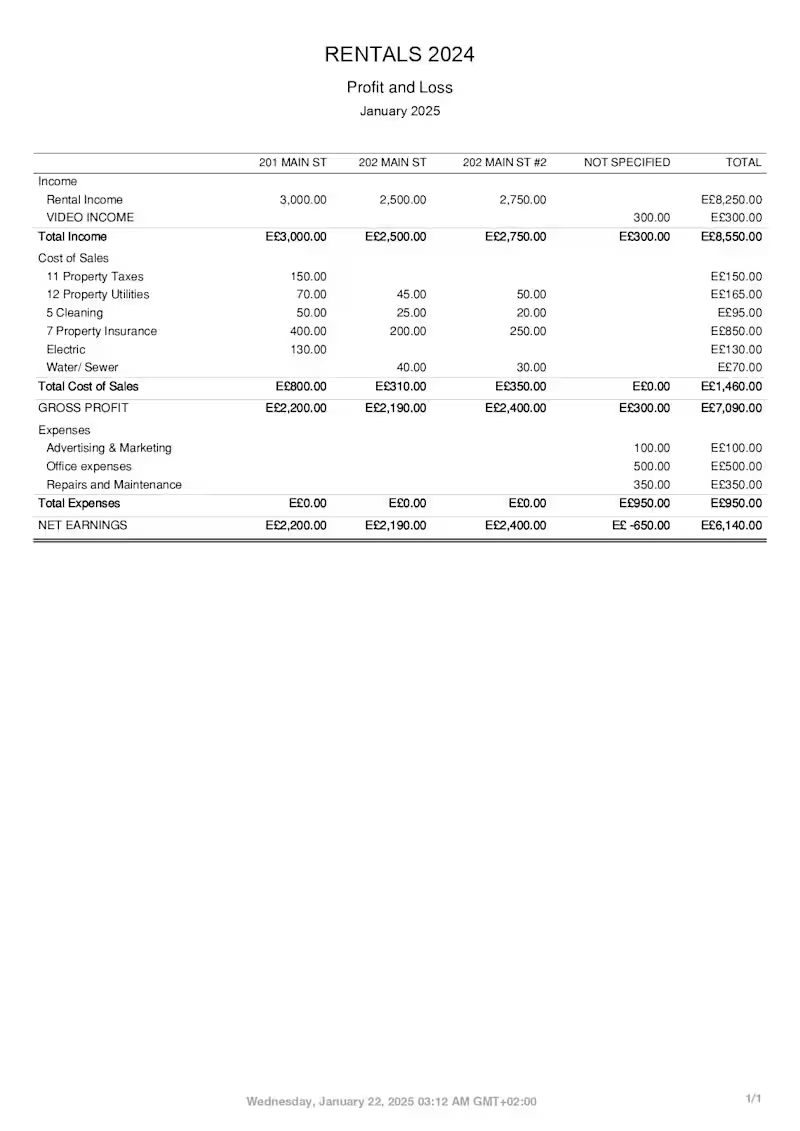
Project Overview: In this project, I managed the end-to-end financial bookkeeping and property-wise reporting for a multi-unit residential rental business based in the UK. The primary goal was to provide the client with clean, organized, and audit-ready monthly financial insights. Key Responsibilities & Tasks Performed: Class & Property Tracking: Segmented and tracked unique income streams and expenses across individual properties (e.g., 201 Main St, 202 Main St) to evaluate the profitability of each asset. Direct Cost Allocation: Accurately recorded and categorized direct property costs, including property taxes, utilities, cleaning services, insurance, and maintenance fees. Overhead Management: Tracked operational expenses such as advertising and office expenses to accurately determine gross profits and net earnings. Financial Reporting: Utilized QuickBooks Online to generate customized Monthly Profit and Loss (P&L) statements, helping the client monitor cash flow and make data-driven investment decisions.
0
53
0
QuickBooks ProAdvisor Certified Badge This official badge represents my verified status as a QuickBooks ProAdvisor. It is awarded by Intuit only to accounting and bookkeeping professionals who have successfully demonstrated advanced proficiency in navigating and managing the QuickBooks Online ecosystem. What this badge guarantees to my clients: Expert-Level Efficiency: Proof of my ability to utilize advanced QuickBooks features to save business owners time and minimize accounting errors. Up-to-Date Knowledge: Ensuring that your company's books are managed using the latest 2026 cloud accounting cloud features and updates. Compliance Ready: Mastery in generating clean financial reports that are fully prepared for tax seasons and business audits.
0
61
0
Intuit QuickBooks Certified ProAdvisor Officially certified by Intuit as a QuickBooks Online ProAdvisor. This certification validates my expertise in cloud accounting, modern bookkeeping workflows, and managing client accounts globally (US/UK markets) using industry best practices. Core Competencies Verified by This Certification: Company Setup & Clean-up: Setting up brand new company profiles, adjusting global settings, managing multicurrency, and executing complete data purges/clean-ups. Banking & Automation: Linking bank feeds, creating smart bank rules, and performing precise bank reconciliations to ensure zero-discrepancy ledgers. Sales & Expenses Lifecycle: Managing the end-to-end process of tracking customer invoices, receiving payments, entering supplier bills, and recording expenses. Tax & Financial Reporting: Applying accurate tax codes (VAT/Sales Tax) and generating professional, audit-ready Profit & Loss statements and Balance Sheets. Status: Active & Verified ProAdvisor
0
64
Microsoft Excel
(8)
Follow
Message
Explore people