Qlik Sense BI Solution Development for Interactive Analytics

Devowise Studios
Verified


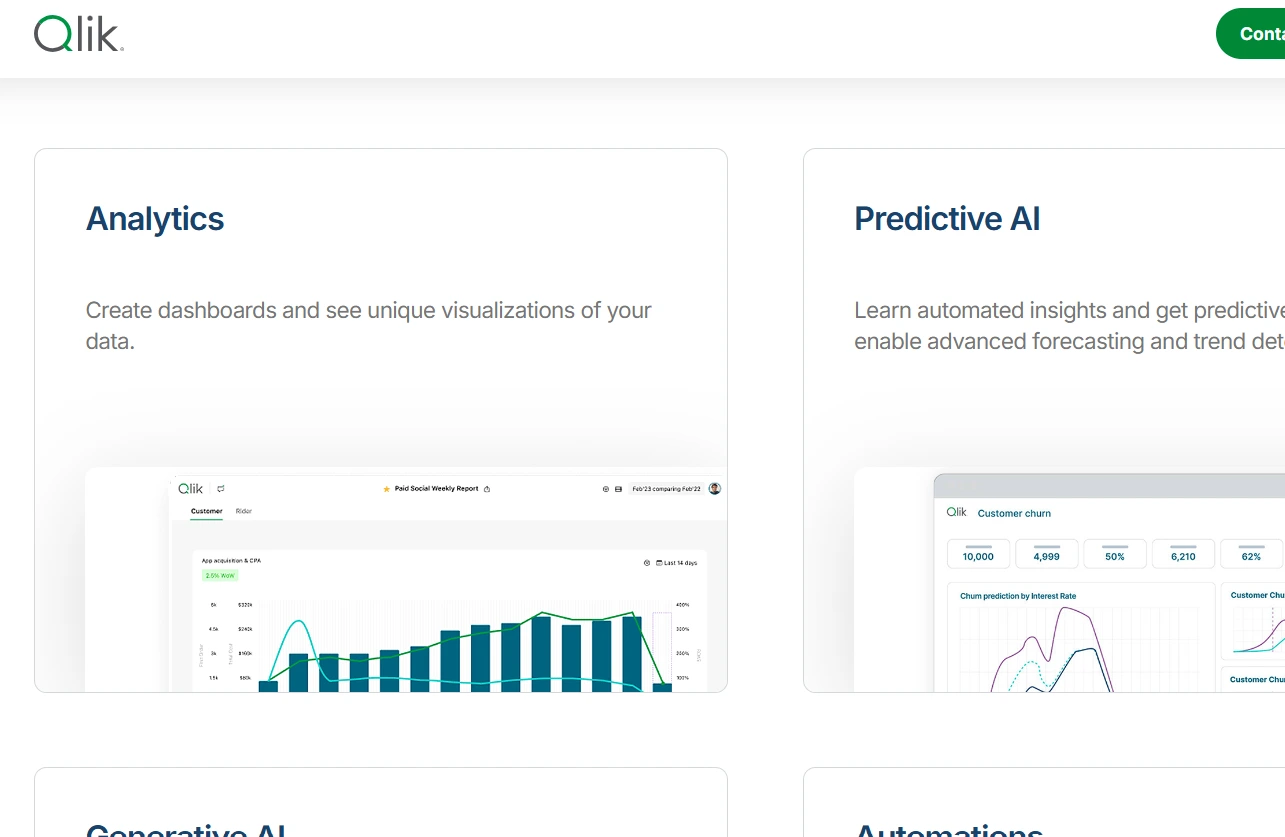
Qlik Sense Business Intelligence Platform
Overview
Businesses generate data across finance, operations, sales, customer management, and internal systems, but that data often exists in silos. Without a centralized reporting platform, stakeholders rely on spreadsheets, manual exports, and static reports that quickly become outdated.
For this project, we designed and developed a comprehensive Qlik Sense Business Intelligence solution that transformed raw operational data into an interactive analytics platform. The system enables teams to explore information through intuitive dashboards, monitor business performance in real time, and make informed decisions backed by accurate, consolidated data.
The Challenge
The client needed a reporting platform capable of bringing together information from multiple sources while maintaining performance as datasets continued to grow.
The existing reporting process involved:
Manual report generation.
Data spread across multiple databases and files.
Inconsistent KPI calculations between departments.
Limited visibility into operational performance.
Slow report generation for large datasets.
Difficulty identifying trends and anomalies without extensive manual analysis.
The objective was to replace these fragmented workflows with a scalable business intelligence environment that could support interactive analytics across the organization.
Discovery & Planning
Before dashboard development began, we worked to understand the client's reporting requirements, business processes, and key performance indicators.
This phase included:
Identifying critical business metrics.
Mapping data relationships across different systems.
Defining reporting hierarchies.
Planning dashboard navigation and user flows.
Structuring reusable calculation logic.
Designing a scalable data model capable of supporting future reporting needs.
Technical Implementation
The project covered the full BI development lifecycle—from data preparation through dashboard delivery.
Data Integration
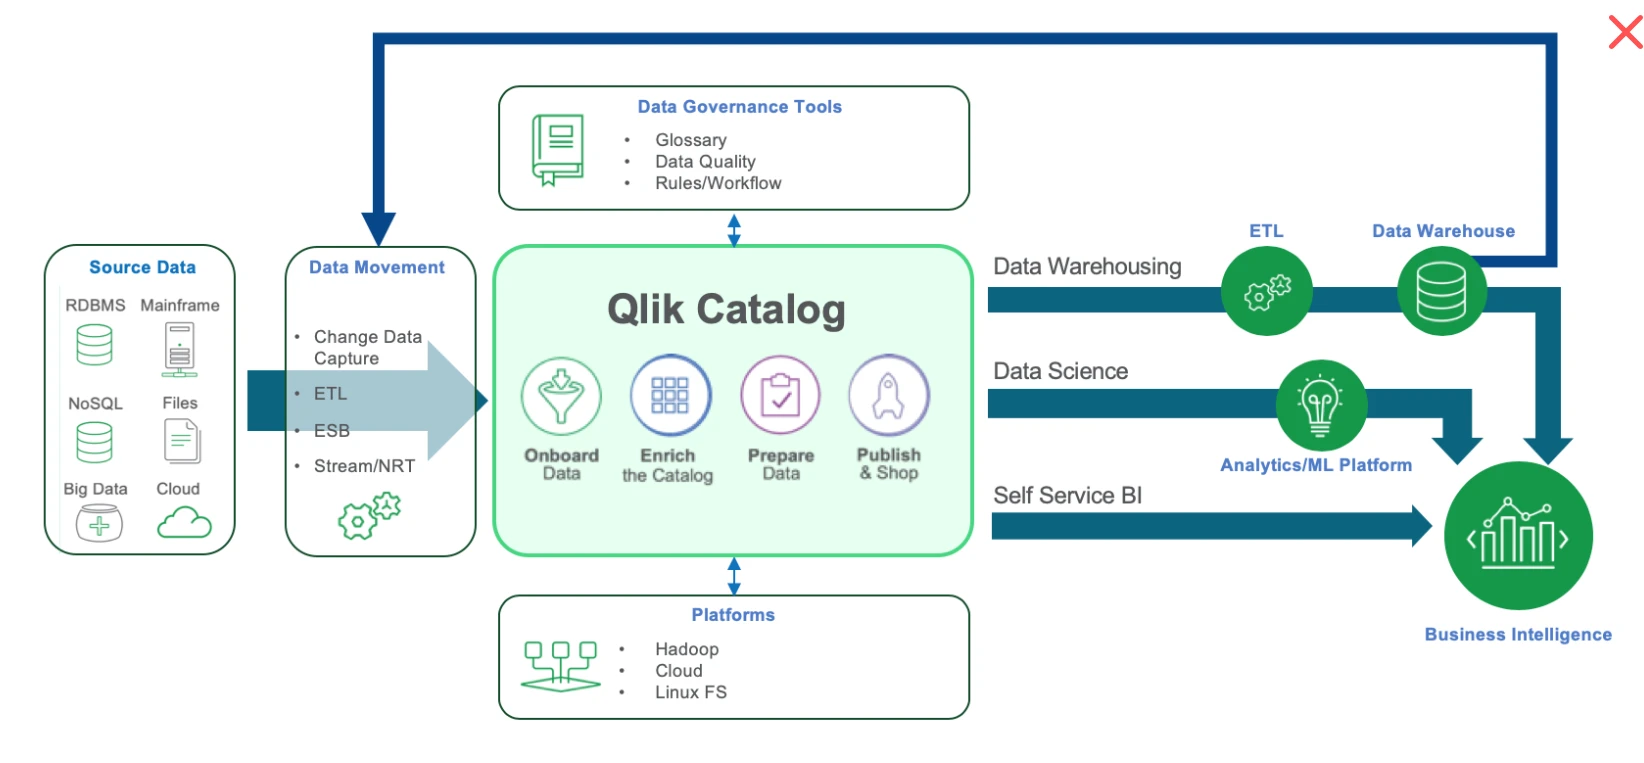
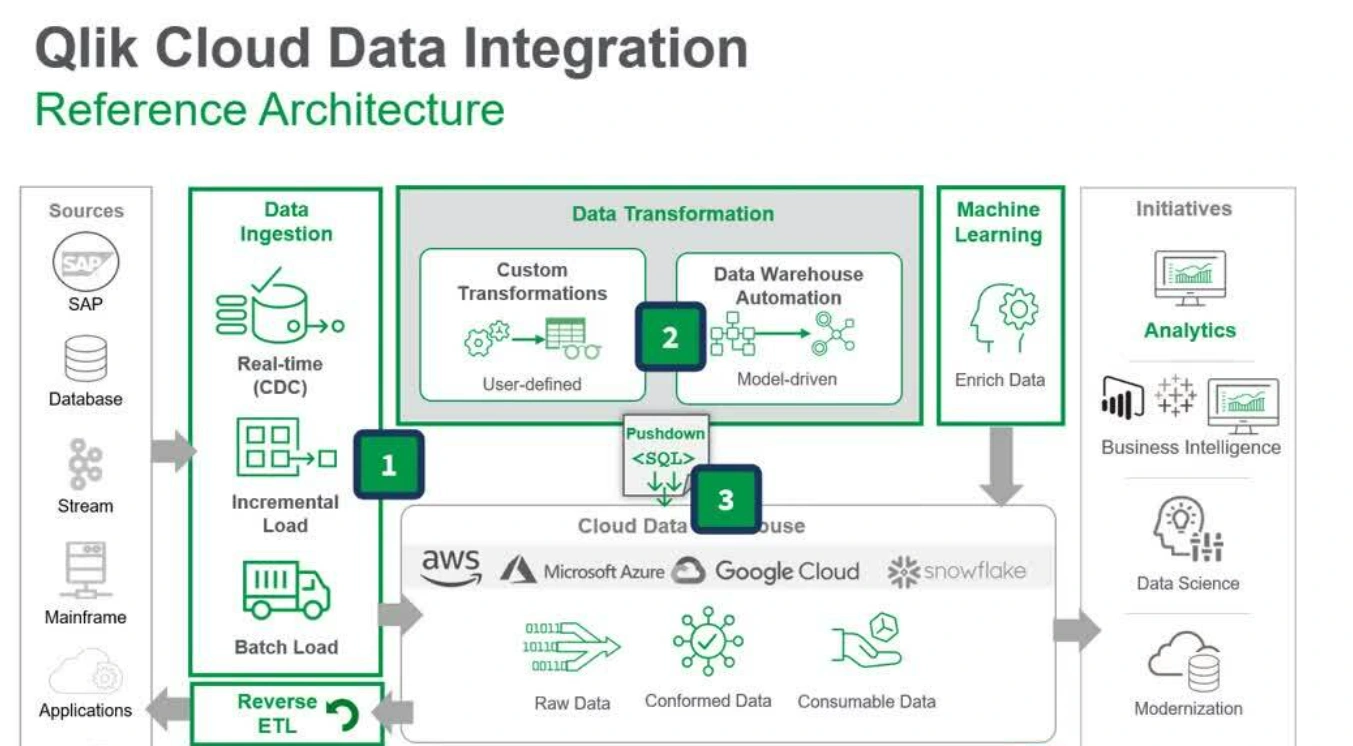
We connected and consolidated data from multiple sources, including:
Microsoft SQL Server
Excel workbooks
CSV datasets
REST APIs
Internal operational databases
Data extraction processes were designed to ensure consistency while minimizing refresh times.
ETL & Data Transformation
Using Qlik Load Scripts, we developed ETL pipelines responsible for:
Data cleansing
Normalization
Field mapping
Removing duplicate records
Standardizing formats
Creating calculated fields
Incremental data loading
Optimizing reload performance
The transformed data was organized into an optimized associative model that supported rapid filtering and exploration.
Data Modeling
A scalable Qlik data model was created using best practices to:
Establish efficient table associations.
Eliminate synthetic keys and circular references.
Reduce memory consumption.
Improve calculation speed.
Maintain data integrity across multiple datasets.
Dashboard Development
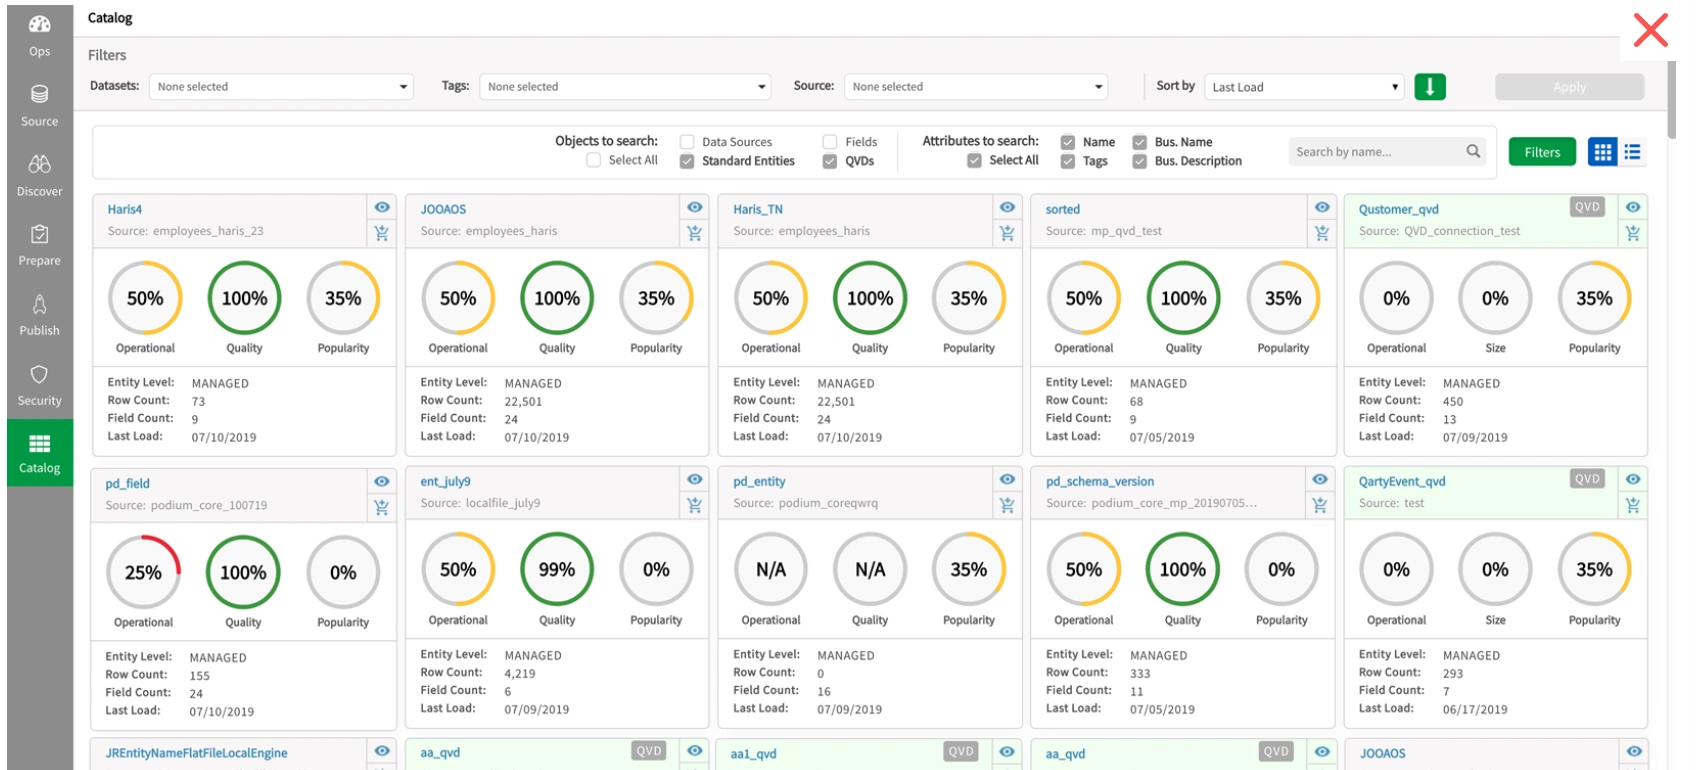
We designed a suite of interactive dashboards tailored for different business functions.
Features included:
Executive KPI dashboards
Sales performance tracking
Revenue analysis
Operational monitoring
Trend analysis
Comparative period reporting
Interactive filtering
Drill-down navigation
Drill-through analysis
Dynamic charts
Pivot tables
Geographic visualizations
Conditional formatting
Responsive layouts
Dashboards were structured to allow users to move from high-level business metrics to detailed transactional data within only a few interactions.
Advanced Analytics
Complex business logic was implemented using:
Set Analysis
Variables
Master Measures
Master Dimensions
Dynamic Expressions
Alternate States
Conditional Calculations
Running Totals
Rolling Averages
Custom KPI calculations
Reusable components were created to simplify future dashboard expansion and maintenance.
Performance Optimization
Large datasets required careful optimization throughout development.
Performance improvements included:
Script optimization
Optimized QVD usage
Efficient joins and mappings
Reduced calculation complexity
Incremental loading strategies
Optimized expressions
Efficient chart rendering
Memory usage optimization
These improvements ensured smooth dashboard interaction while maintaining fast reload and response times.
Quality Assurance
Before deployment, dashboards underwent extensive validation to ensure both technical accuracy and business correctness.
Testing included:
KPI validation
Cross-source data verification
Dashboard interaction testing
Filter behavior validation
Performance benchmarking
User acceptance testing
Data consistency checks
Results
The completed Qlik Sense platform delivered a centralized analytics environment capable of replacing manual reporting processes with automated, interactive dashboards.
The solution enabled business users to:
Monitor key business metrics in real time.
Analyze trends across multiple dimensions.
Explore data without relying on static reports.
Access consistent KPI calculations across departments.
Identify operational issues more quickly.
Make faster, data-driven decisions using a single source of truth.
The modular architecture also provides a strong foundation for future reporting requirements, allowing additional datasets, dashboards, and business metrics to be incorporated with minimal development effort.
Like this project
Posted Jul 6, 2026
Built interactive Qlik Sense dashboards with data modeling, ETL, KPI reporting, and real-time analytics for faster business insights.
Likes
1
Views
14
Timeline
Apr 23, 2025 - Apr 25, 2025