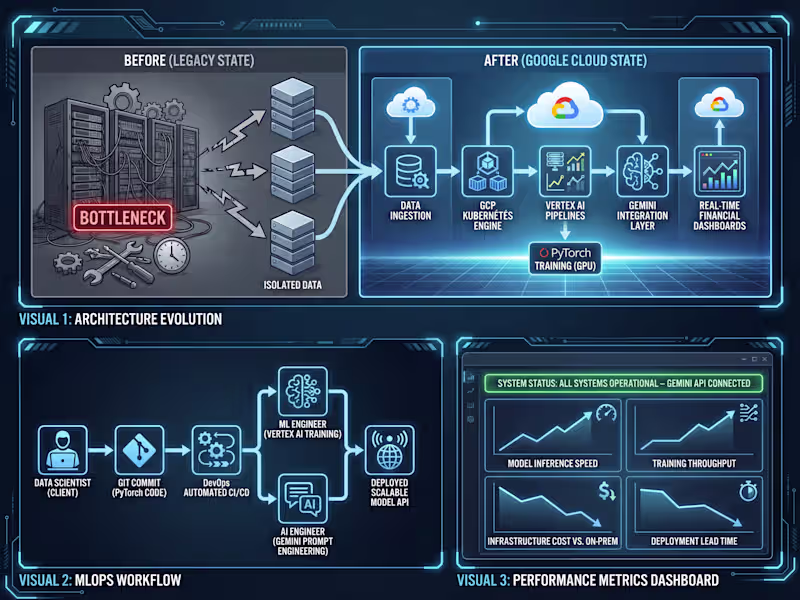
AI Integration & Automation Engineer | Full-Stack Web Apps
AI Integration & Automation Engineer | Full-Stack Web Apps


Enterprise Cloud · DevOps · AI/ML · Email · Marketing Expert
- $10k+
- Earned
- 12x
- Hired
- 4.4
- Rating
- 36
- Followers
Enterprise Cloud · DevOps · AI/ML · Email · Marketing Expert


AI Automation & Business Systems Expert | Make.com, Zapier
AI Automation & Business Systems Expert | Make.com, Zapier
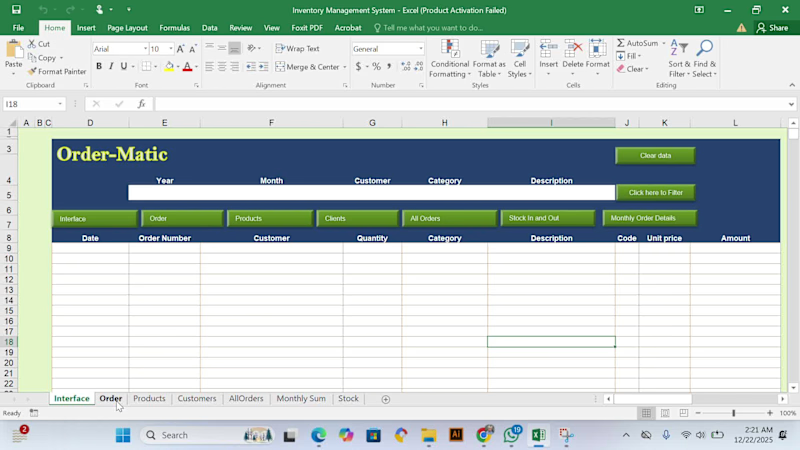


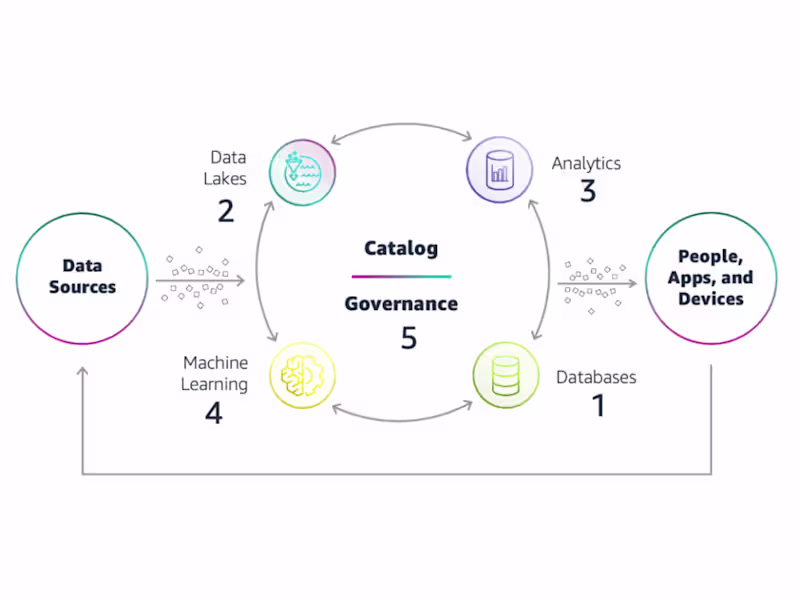
AI System Architect | Database Expert | Data Analyst
- $25k+
- Earned
- 1x
- Hired
- 5.0
- Rating
- 71
- Followers
AI System Architect | Database Expert | Data Analyst

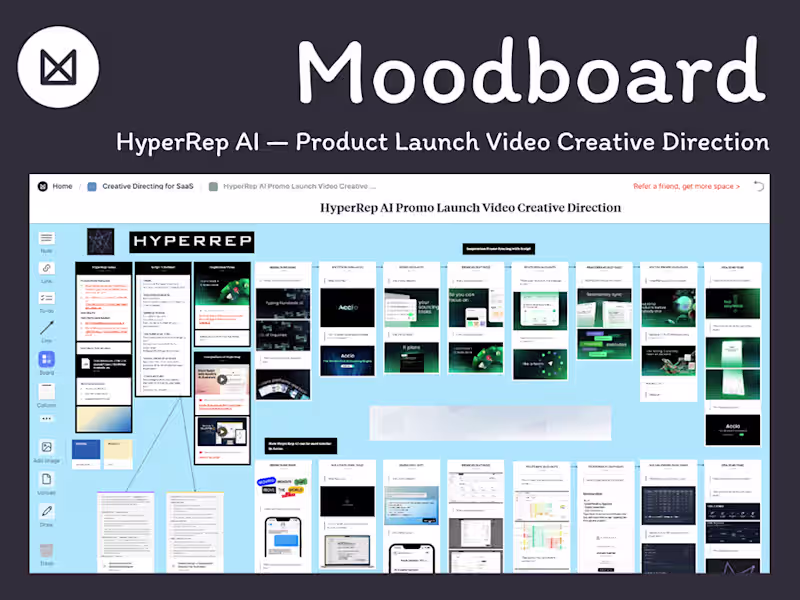
Creative Partner | Bridging SaaS & Motion
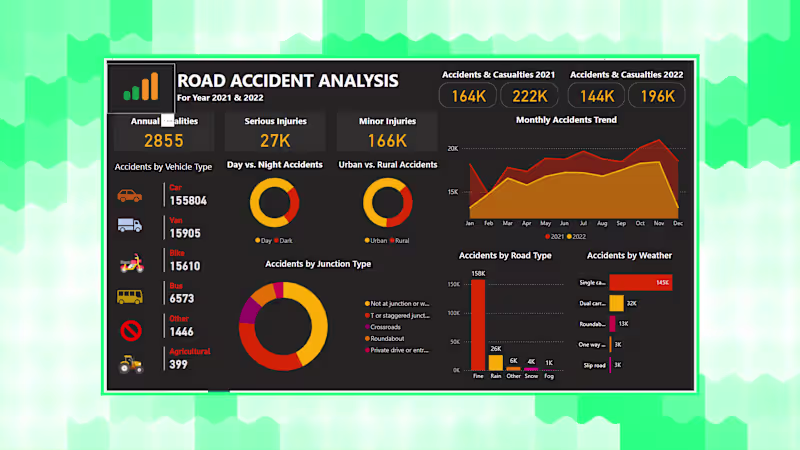
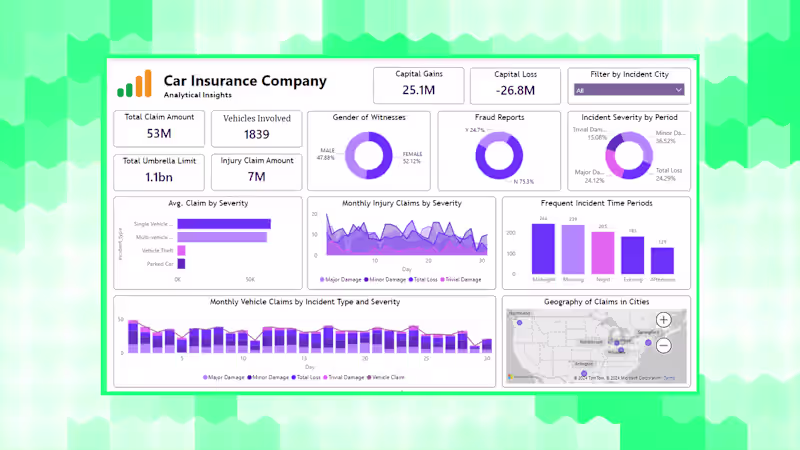
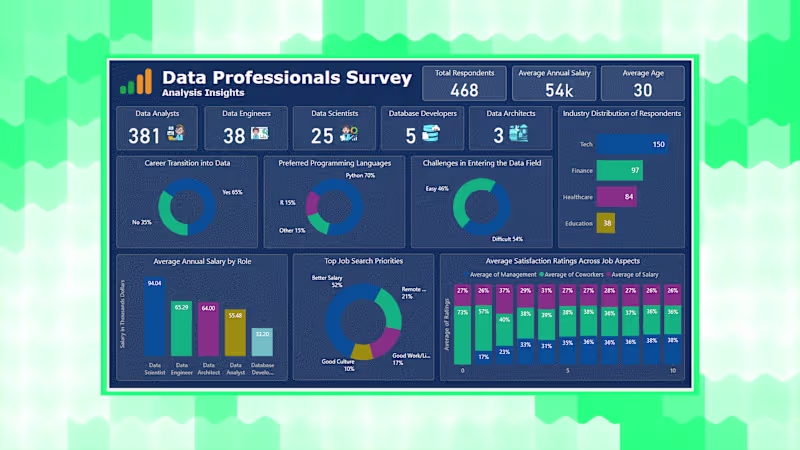
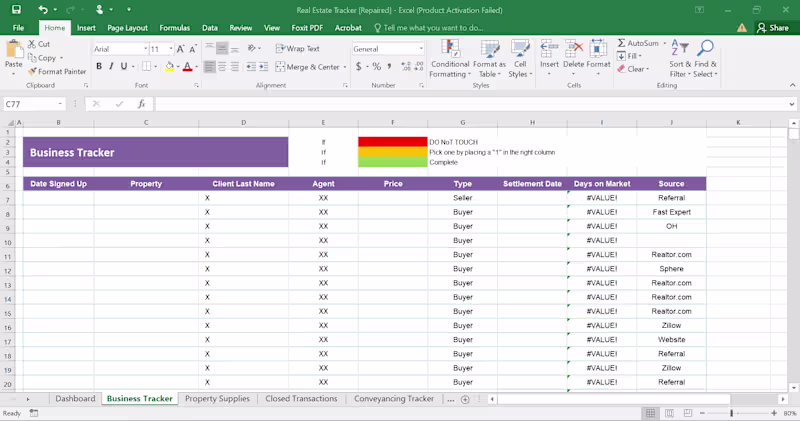
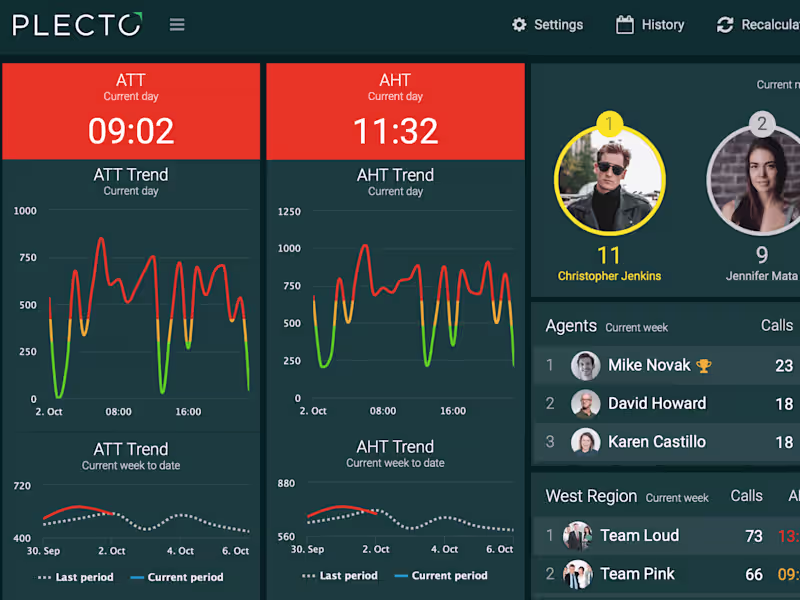
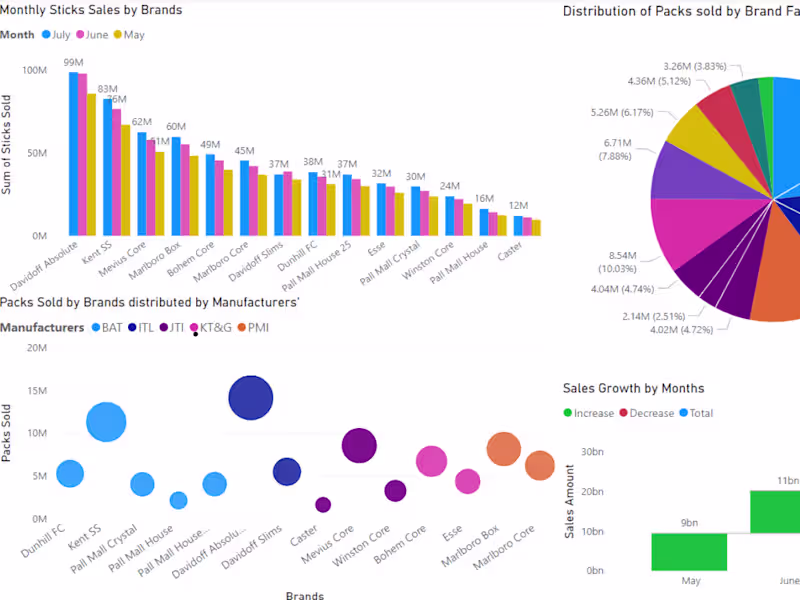
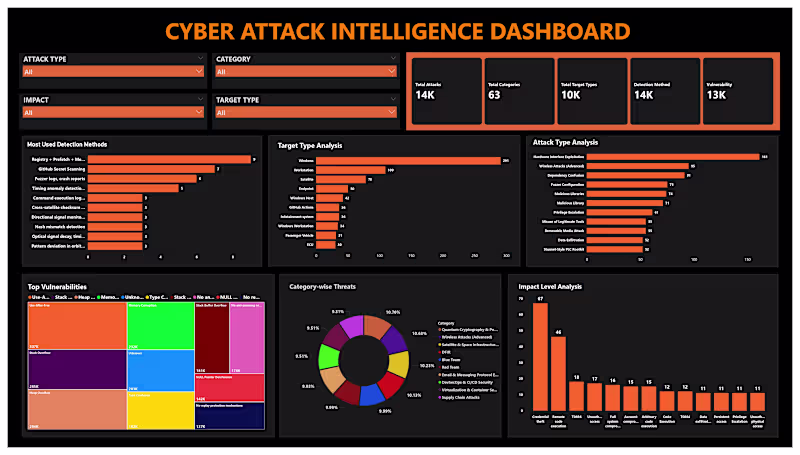
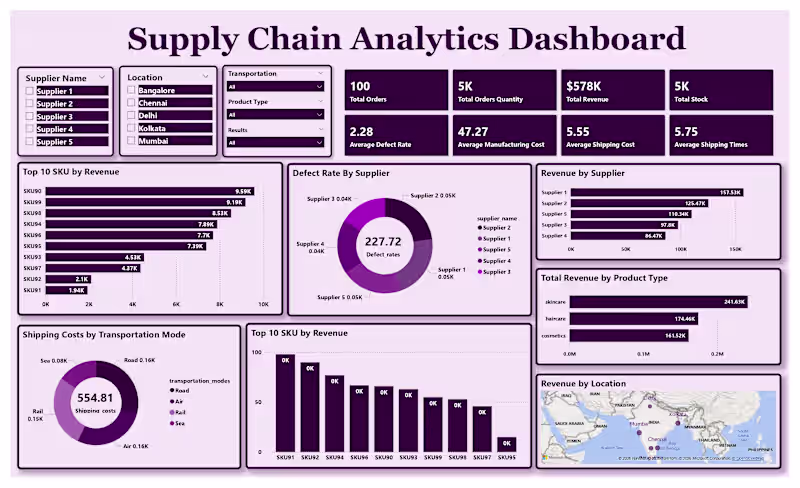
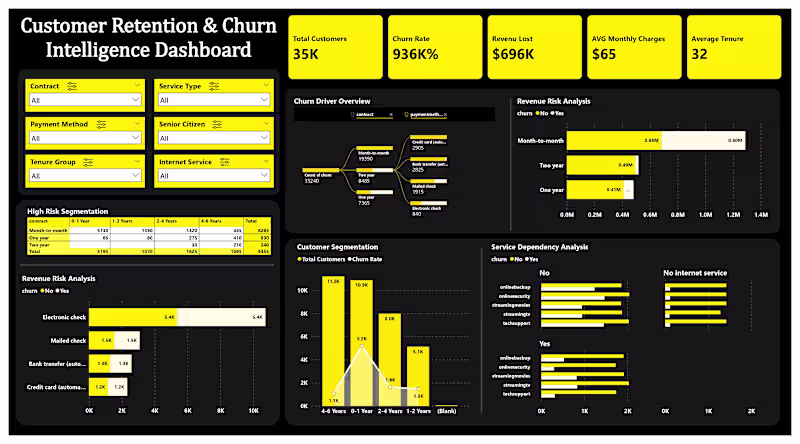
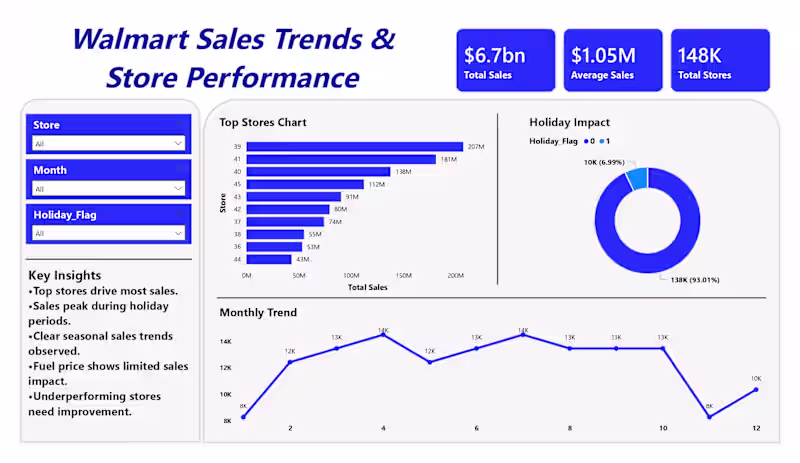
Dashboard & Data Analytics Expert
Versatile wordsmith and design enthusiast


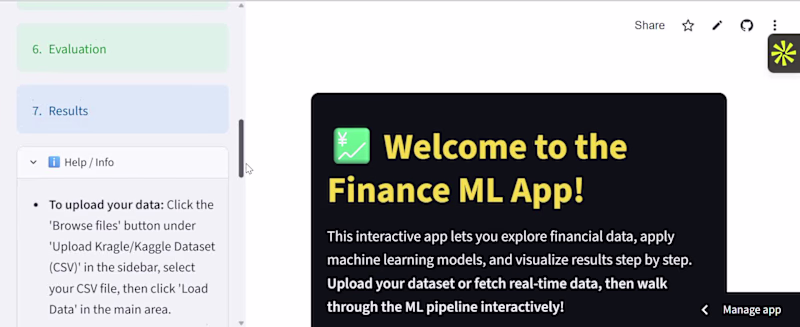
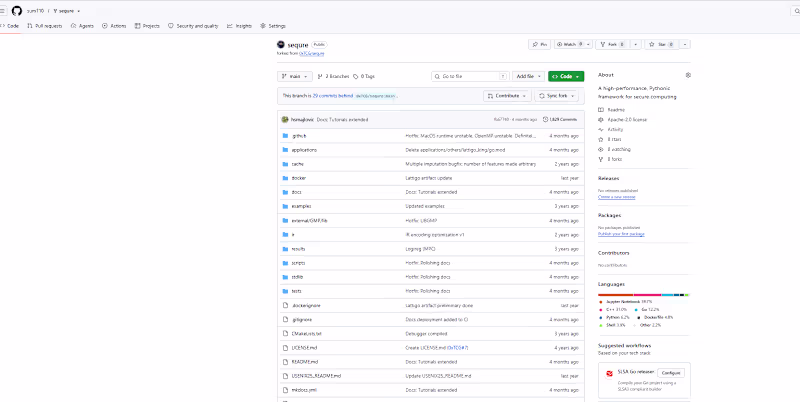
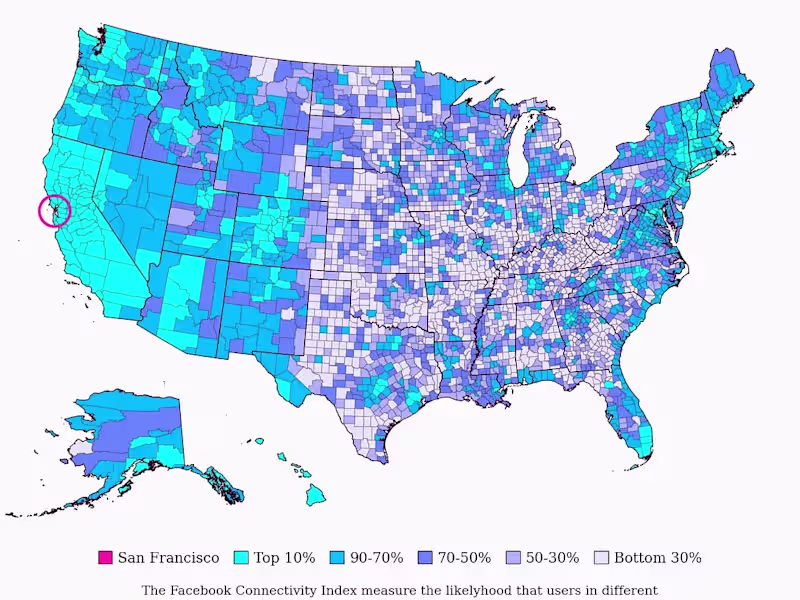
FinTech developer building secure, modern web platforms.
New to Contra
FinTech developer building secure, modern web platforms.