The network for creativity
Join 1.25M professional creatives like you
Connect with clients, get discovered, and run your business 100% commission-free
Creatives on Contra have earned over $150M and we are just getting started
Back to feedPost

Overview
This project provides an interactive platform for financial data analysis and predictive modeling. Built with Python and Streamlit, it enables users to visualize financial trends and explore machine learning-driven insights through an intuitive, web-based interface.
Key Features
Data Pipeline: Automated ingestion and cleaning of financial datasets.
Feature Engineering: Implementation of financial indicators and technical features to capture market dynamics.
Predictive Modeling: A streamlined training and evaluation workflow using robust machine learning algorithms.
Interactive Visualization: Real-time dashboards allowing users to experiment with different parameters and model configurations.
Technical Workflow
Data Loading: Robust ingestion of historical financial data.
Preprocessing: Handling missing values, noise reduction, and data normalization.
Feature Engineering: Extraction of meaningful market features (e.g., technical indicators, volatility metrics).
Model Training & Evaluation: A modular approach to training, testing, and validating model performance using industry-standard metrics.
Experience It Live
Explore the application and interact with the model here:


The network for creativity
Join 1.25M professional creatives like you
Connect with clients, get discovered, and run your business 100% commission-free
Creatives on Contra have earned over $150M and we are just getting started











Related posts

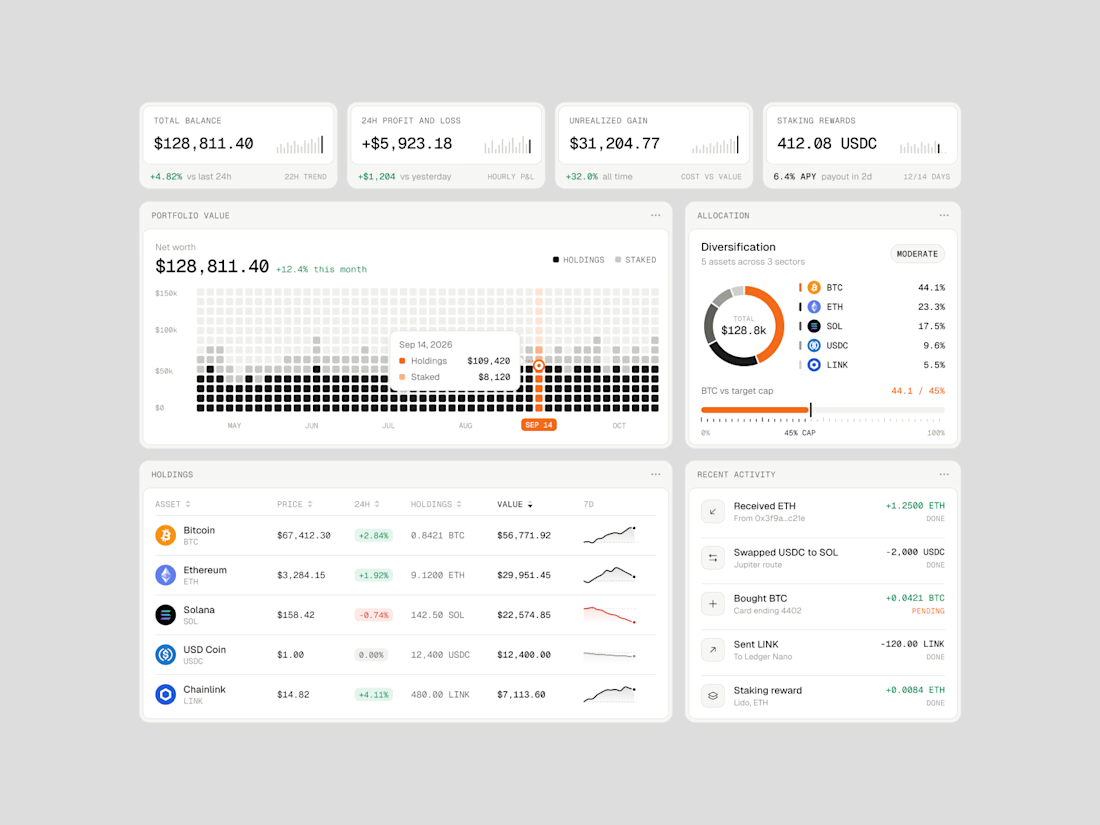
Exploring how complex financial data can feel simple, structured, and easy to navigate.
Vault One is a crypto portfolio dashboard concept that brings together asset performance, portfolio allocation, transaction history, and key financial metrics in one workspace.
I focused on visual hierarchy, information density, and data visualization, using a neutral color palette, subtle UI details, and selective accent colors to keep the interface clean without compromising functionality.
The goal was to make the data easier to understand, not just nicer to look at.
Would love to hear your thoughts on the visual direction and layout!
#ProductDesign #UIDesign #Fintech #DashboardDesign #UXDesign




Sunny Rock — Cinematic Paris Travel Website | Creative Web Development
Experience Paris through Sunny Rock, a cinematic travel website concept designed to combine immersive visuals, elegant UI/UX, and interactive scrolling into a premium digital experience.
This self-directed project explores modern web design through cinematic imagery, scroll-driven animations, glassmorphism, smooth transitions, and responsive layouts.
🛠️ Technologies & Skills
HTML5 & CSS3 — Semantic structure, modern styling, and responsive layouts
JavaScript (ES6+) / TypeScript — Interactive behavior and animation logic
React.js — Reusable components, hooks, and state management
Tailwind CSS — Utility-first styling and responsive design
HTML5 Canvas API — 2D rendering for visual effects and image sequences
Scroll-Driven Animation — Frame-by-frame image sequences synchronized with scrolling
requestAnimationFrame & Linear Interpolation (Lerp) — Smooth animation updates
Lenis Smooth Scrolling — Fluid scrolling experiences
Intersection Observer API — Scroll-triggered reveals and entrance animations
UI/UX & Visual Design — Visual hierarchy, typography, glassmorphism, and interaction design
SVG Graphics — Scalable icons and vector elements
AI Visual Generation & Prompt Engineering — Cinematic visual assets
Cloudinary — Media hosting and image optimization
Performance Optimization — Efficient asset loading and animation rendering
Python & Browser Automation — Development utilities, asset processing, and testing
✨ Design Highlights
Cinematic, immersive visual storytelling
Premium travel-inspired aesthetic
Smooth, scroll-based animation sequences
Modern glassmorphism interface
Responsive layouts for different screen sizes
Interactive elements and refined micro-interactions
Project Type: Self-Directed Portfolio Project
Focus Areas: Creative Front-End Development · Web Design · UI/UX Design · Interactive Experiences · Animation
Designed and developed by Ubaid | Ubaid Web Studio.🔥


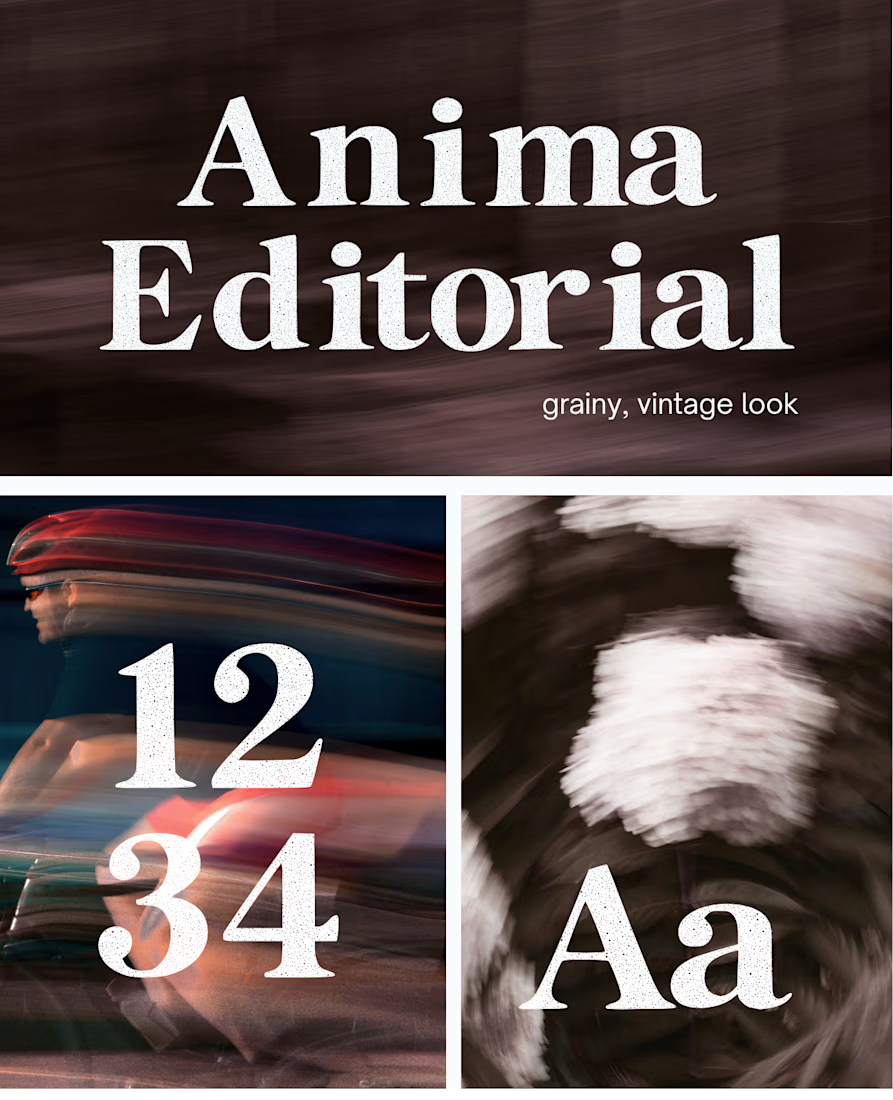
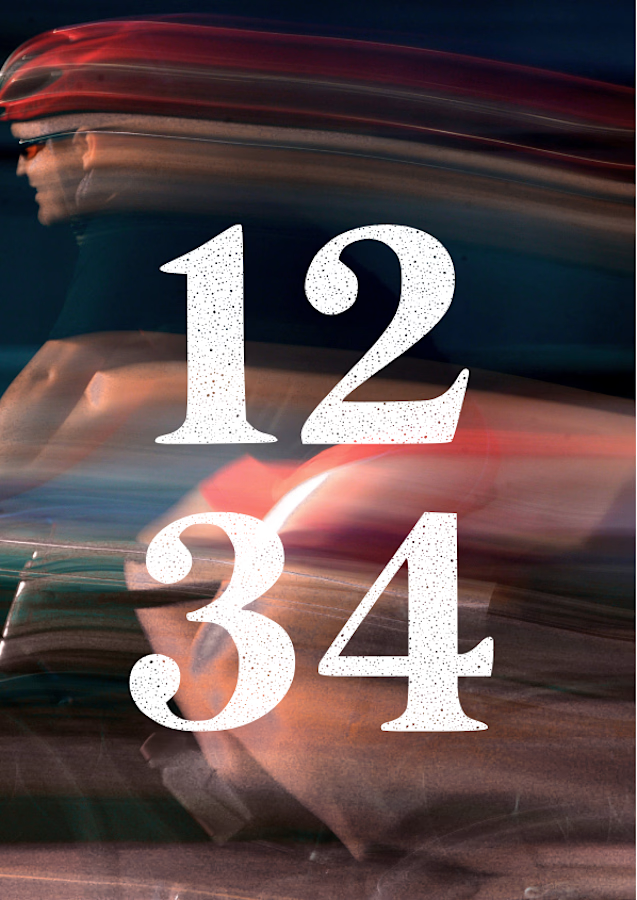
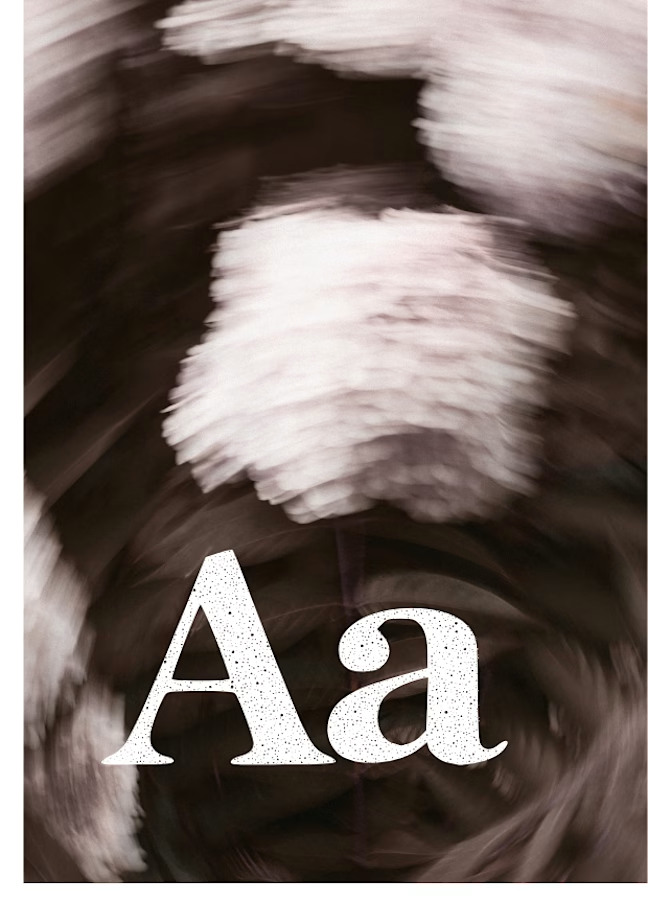
I created this font & it is free to download and use in your free or paid projects. Enjoy 🚀 find it at https://twaperdigital.com/anima-editorial


I like this font