Results that are similar to your search
Similar results

Spatial Data Visualization & AI Workflow Systems
Spatial Data Visualization & AI Workflow Systems
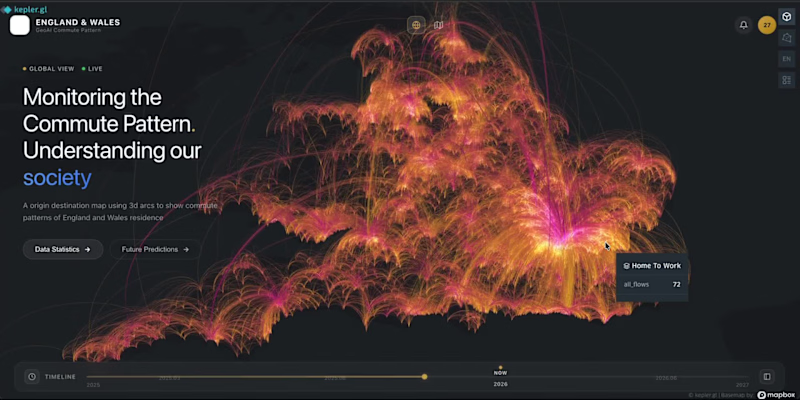
From static maps → interactive spatial experiences. 🚀
Recently experimented with building a Geo-inspired commute dashboard using Vibe Coding + geospatial visualization.
The interesting shift for me:
Instead of spending days moving between GIS software, frontend development, and UI iteration, ideas can become working interfaces much faster.
Still early, but it opens up interesting possibilities:
→ spatial analytics that feel more accessible
→ interfaces ready for predictive layers and AI workflows
→ reducing the barrier between geographic data and end users
Curious where GIS + AI + Vibe Coding goes next.
2
164
One of the most interesting shifts in AI right now:
Real estate AI systems are only as smart as the spatial data behind them.
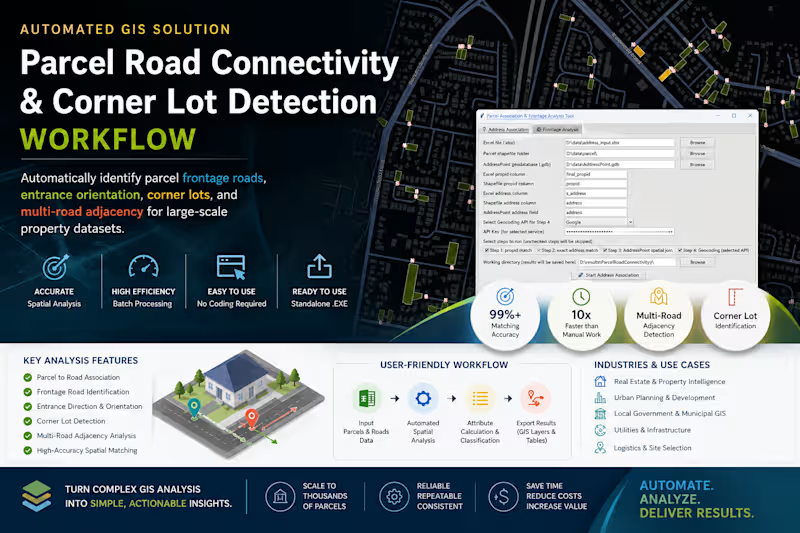
Just wrapped up a GeoAI-oriented automation project for large-scale parcel intelligence in Australia.
Built a standalone workflow that automatically detects:
→ frontage roads
→ corner lots
→ parcel orientation
→ multi-road adjacency
→ spatial access relationships
The interesting part wasn’t the GIS itself.
It was converting messy spatial relationships into structured knowledge that downstream AI systems can actually understand.
A lot of “AI for real estate” conversations focus on LLMs.
But the real bottleneck is often:
How do you turn geography into machine-readable reasoning context?
Ended up packaging the entire workflow into a production-ready executable app for non-technical teams, with batch processing + configurable spatial rules.
Feels like we’re moving from:
“mapping data” to “building spatial reasoning infrastructure.”
#GeoAI #PropTech #SpatialComputing #Automation #GIS #AIInfrastructure
1
280
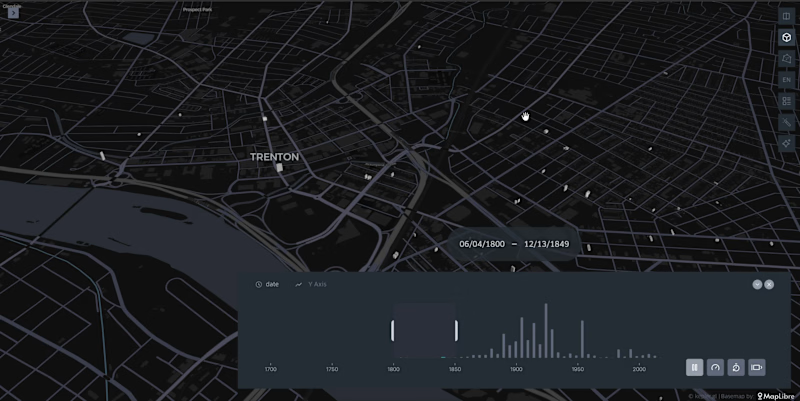
I create interactive 3D city visualizations showing how urban areas evolve over time. Using Kepler.gl (http://Kepler.gl), building footprint data is visualized in 3D with a time slider based on construction year, revealing the growth of a city.
Each building is clickable and includes a direct link to street-level imagery in Google Street View, allowing users to explore the real-world view of the building.
This visualization is ideal for urban planning, real estate analysis, city storytelling, and digital twin presentations.
2
225
🚀 Most people calculate driving distances one route at a time.
That doesn’t scale.
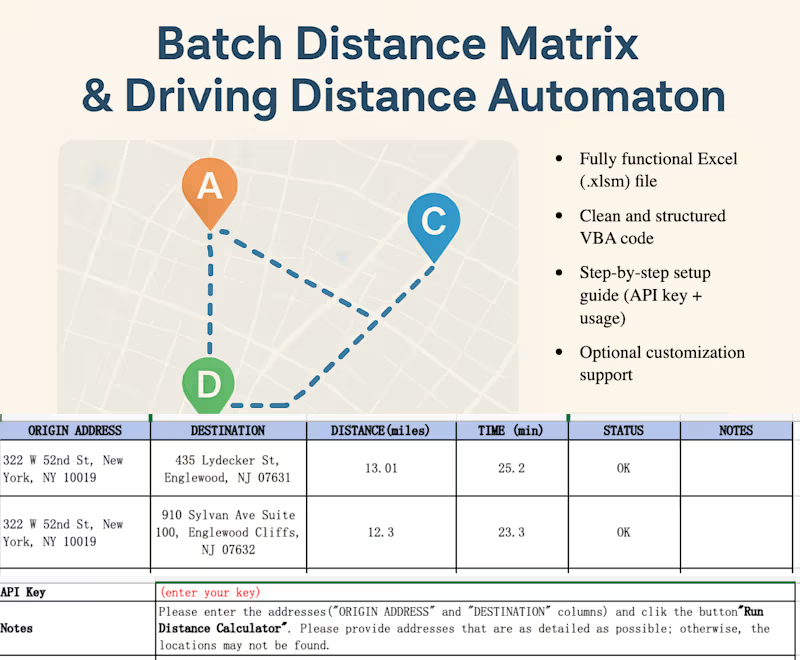
I built an Excel-based tool that automates distance and travel time calculations for large datasets using an API.
You can input hundreds of origin–destination pairs and get:
☑️ Distance (miles/km)
☑️ Travel time (minutes)
☑️ All processed in bulk, directly in Excel.
This is particularly useful for:
☑️ Freight pricing models
☑️ Logistics planning
☑️ Route analysis
☑️ Location-based datasets
What used to take hours can now be done in minutes.
Happy to share more details or customize it for specific workflows.
https://contra.com/s/eFoEEFRF-bulk-driving-distance-and-time-calculator-excel-api-automation
1
185


Software engineer building web, GIS, 3D & data products


Work Life Balance
Work Life Balance
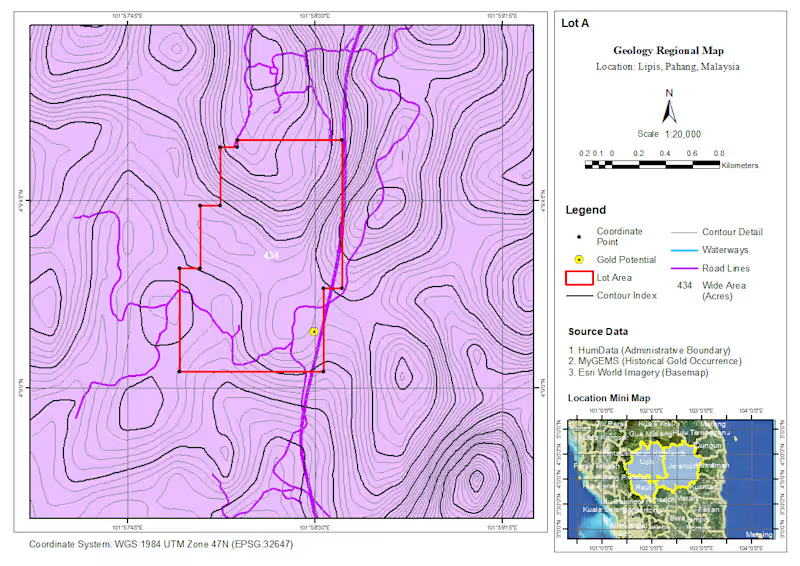
Recently completed a GIS-based desktop study for a gold exploration project in Pahang, Malaysia, covering areas around Lipis, Jerantut, and Raub.
As a GIS Analyst, I worked on compiling and integrating multiple spatial datasets to support preliminary assessment and planning of potential exploration areas.
The analysis and mapping included:
• Regional geological mapping
• Geomorphological analysis
• Satellite imagery interpretation
• Gold occurrence and resource visualization
• Accessibility and surrounding area analysis
• Quarry/resource mapping
• Project planning and infrastructure mapping
• Permit application mapping
The workflow involved combining geological and mineral occurrence data with terrain, satellite imagery, road networks, waterways, and project boundaries to create clear and structured thematic maps for desktop-level assessment.
The maps were developed using ArcGIS with a focus on consistent cartographic standards, spatial accuracy, and presenting complex geospatial information in a format that can support further exploration planning and decision-making.
This project was a great opportunity to apply GIS not only for visualization, but also as a tool for integrating geological, environmental, and spatial information into a more structured exploration workflow.
📍 Pahang, Malaysia
🗺️ GIS Analysis & Cartography
⛏️ Gold Exploration Desktop Study
1
195
Geomorphological Mapping Project | GIS Analysis
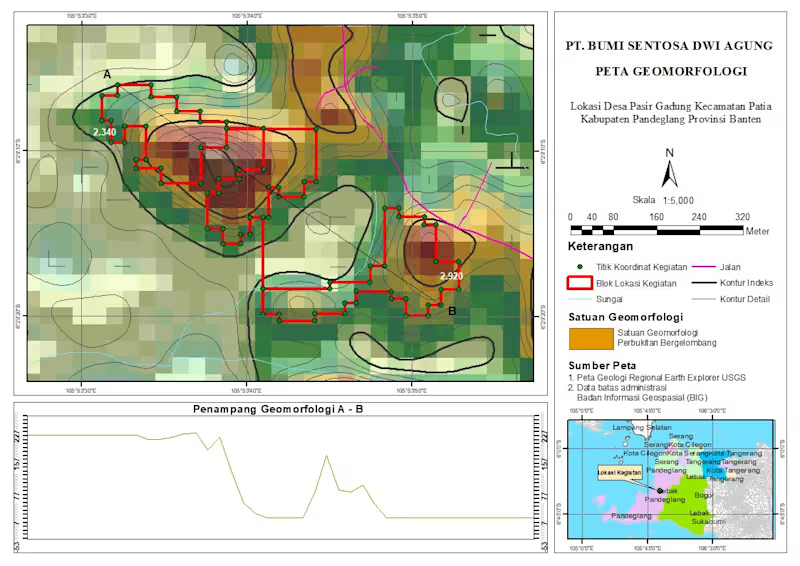
Just wrapped up a geomorphological mapping project for a site located in Pasir Gadung Village, Pandeglang, Banten. This work focuses on identifying landform characteristics and terrain variation to support better spatial understanding and decision-making.
In this map, I combined elevation data, contour analysis, and spatial interpretation to classify geomorphological units—highlighting areas dominated by undulating hill formations. The red polygons represent the project activity zones, supported by coordinate points collected from the field.
I also included a cross-section (A–B) to visualize terrain changes more clearly, giving a better perspective of slope variation and landform structure across the site.
Tools & Approach:
- GIS processing and spatial analysis
- Contour and elevation modeling
- Geomorphological interpretation
- Map layout and visualization
This kind of analysis is essential for projects related to land development, environmental assessment, and infrastructure planning.
Always open to feedback and collaboration—let’s connect 🚀
2
325
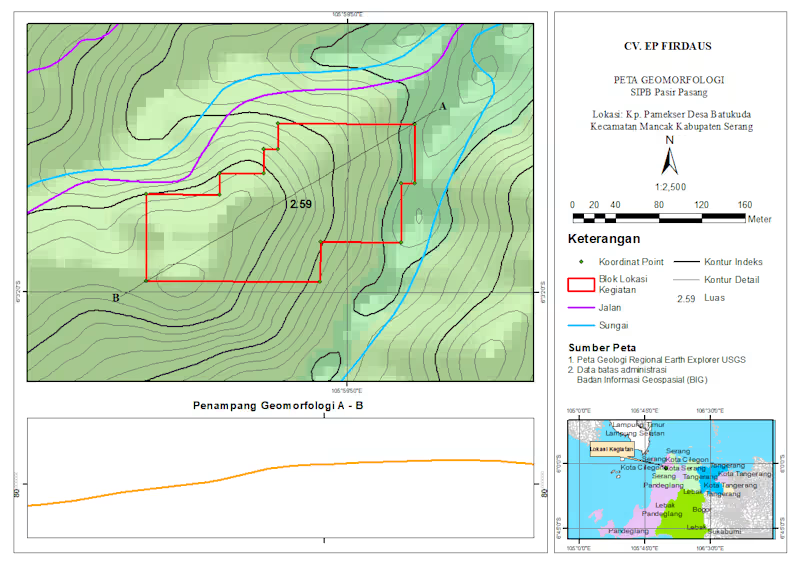
Professional Geomorphology Map & Terrain Profile (ArcGIS/QGIS)
I create precise and visually clear geomorphological maps like this, including:
- Contour mapping (index & detailed)
- Landform interpretation
- River and infrastructure overlay
- Project boundary mapping
- Elevation cross-section analysis (A–B profile)
Perfect for research, environmental analysis, mining, or land development projects.
5
5
395
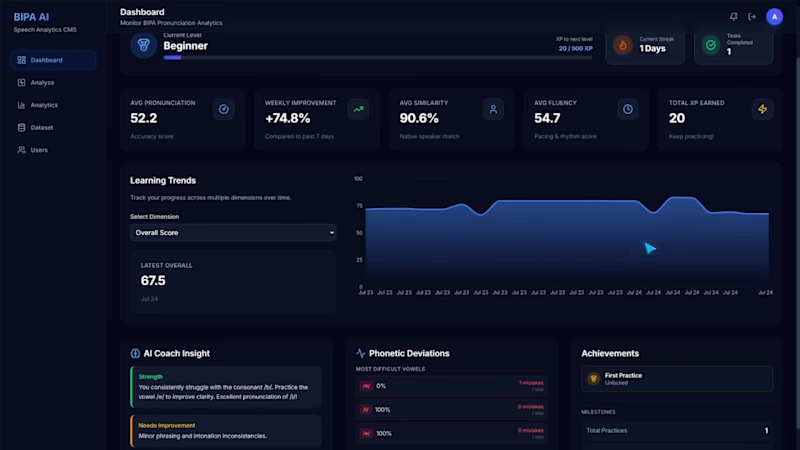
BIPA AI — AI-Powered Pronunciation Learning Platform
BIPA AI is an intelligent pronunciation learning platform that helps non-native Indonesian speakers improve their speaking skills through AI-driven speech analysis and personalized learning.
The platform evaluates pronunciation across multiple dimensions—including pronunciation accuracy, fluency, intonation, clarity, vowel articulation, phoneme accuracy, and native speaker similarity—to provide detailed, actionable feedback after every speaking exercise.
Designed as more than just a speech analyzer, BIPA AI introduces structured pronunciation tasks, learning progress tracking, historical performance analytics, and adaptive AI recommendations, creating an engaging learning experience similar to modern language learning platforms.
By combining speech processing, machine learning, and interactive analytics, the application transforms spoken audio into measurable insights that support continuous pronunciation improvement.
Highlights
- AI-based pronunciation evaluation
- Native speaker comparison
- Speech performance analytics dashboard
- Guided pronunciation learning
- Personalized AI feedback
- Long-term learning progress tracking
- Modern responsive web application
0
98

GIS & Python Developer | Geospatial AI Specialist
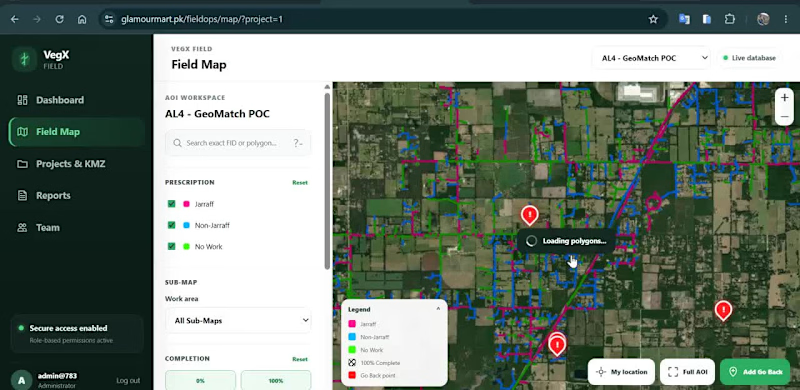
🗺️ Web GIS for Field Operations & Location-Based Data Collection
I developed an interactive geospatial platform designed to help teams visualize, manage and update field-work information directly on a map.
The application combines Web GIS, satellite imagery, spatial data management and field reporting in a single workflow.
Key capabilities include:
• Interactive field map with spatial work areas
• Color-coded work / prescription classifications
• Multiple GIS sub-maps and project views
• Satellite and OpenStreetMap basemap switching
• Work completion and status tracking
• Location-based field-point creation
• GPS coordinate capture
• Field categorization and notes
• Photo attachment support for field observations
• Map-based project and team workflows
The goal is to replace disconnected field records with a centralized spatial workflow, where teams can see exactly where work is required, record observations from the field, and maintain geographically accurate project information.
Built around Web GIS, spatial databases and interactive mapping.
Interested in projects involving GIS development, field-data collection, asset management, spatial dashboards and geospatial workflow automation.
0
134
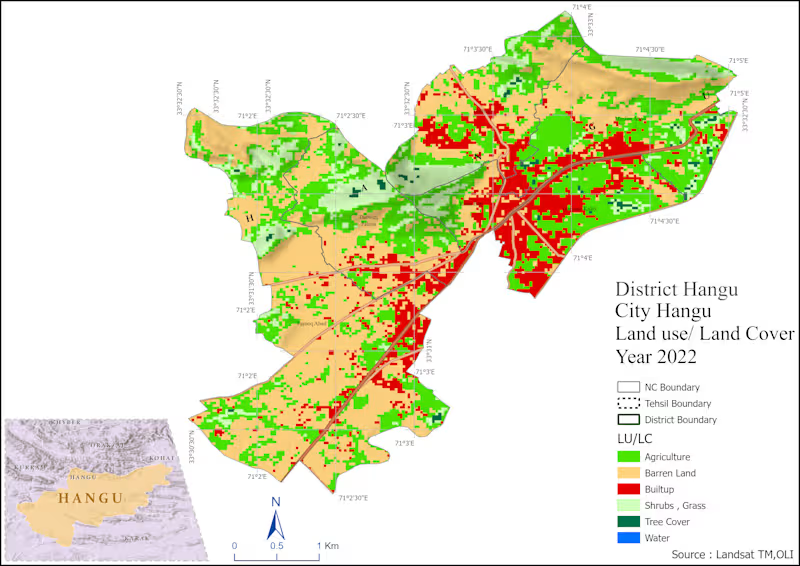
GIS-based spatial analysis and mapping project using ArcGIS, QGIS, and Remote Sensing data. Developed accessibility, land use, and spatial distribution maps to support urban planning and decision-making.
0
55
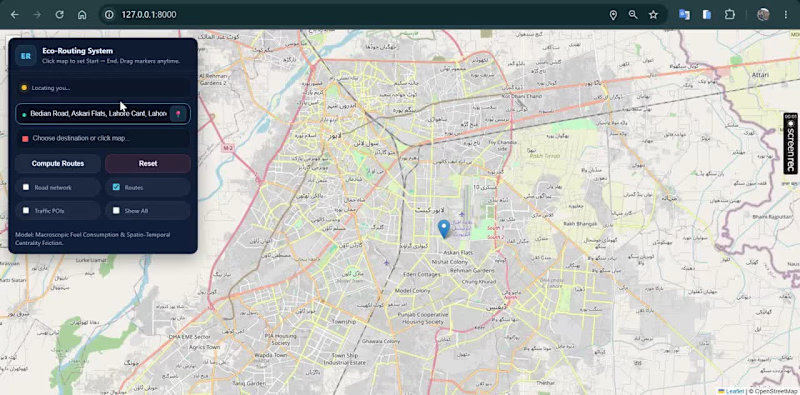
🚗🌍 Can a navigation system recommend the most fuel-efficient route instead of simply the shortest one?
This project was developed as part of my MPhil Remote Sensing & GIS thesis.
I designed and developed an intelligent Web GIS routing system that generates and compares four alternative routes between an origin and destination and recommends the most suitable route using a Multi-Criteria Decision-Making (MCDM) approach.
Instead of considering only distance, the system evaluates multiple factors such as:
• 🌱 Fuel-efficiency / environmental suitability
• ⏱ Travel duration
• 🚧 Road hurdles and route conditions
• 📏 Travel distance
The alternatives are evaluated using a TOPSIS-based decision model, allowing the system to identify the route with the best overall balance rather than simply choosing the shortest path.
I also integrated an AI assistant that explains route recommendations in natural language, helping users understand why one route is preferable to the alternatives.
Key features:
• Interactive Web GIS navigation
• Four-route generation and comparison
• MCDM/TOPSIS route ranking
• Fuel-efficient route recommendation
• Route distance and travel-time analysis
• Road-condition / hurdle consideration
• AI-generated route explanations
• Interactive route visualization
• Decision-support interface for sustainable mobility
Built with Python, Django, GIS, Leaflet/OpenStreetMap, MCDM and AI integration.
This research explores how GIS + decision science + AI can support smarter and more sustainable urban mobility.
1
160
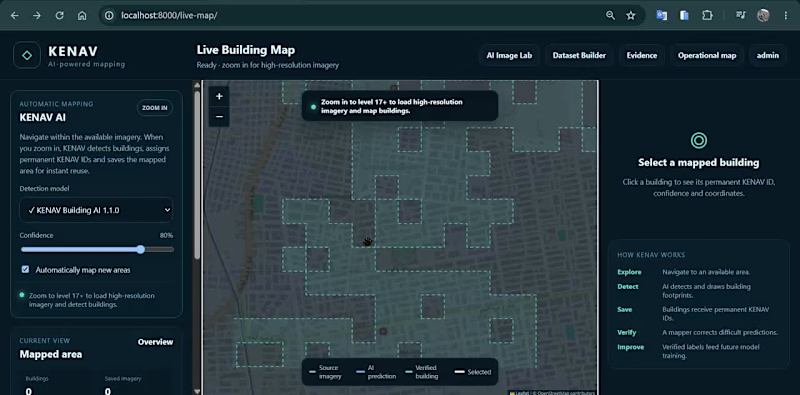
🛰️ AI-Powered Building Detection & Human-in-the-Loop GIS
A look at a geospatial AI platform I developed for detecting, reviewing, and managing building footprints from satellite imagery.
The workflow combines GeoAI, GIS and human validation to turn AI predictions into reliable geospatial datasets.
In this demo:
• AI-based building footprint detection
• Interactive satellite imagery and GIS mapping
• Building polygon visualization
• Confidence-based AI predictions
• Accept / reject prediction workflow
• Manual correction of detected footprints
• Human-reviewed labels for future model improvement
• Geospatial coordinates and building-level data management
The goal is to create a scalable workflow where AI performs the initial mapping while human review improves accuracy and provides better training data for subsequent model versions.
Built around GIS + GeoAI + computer vision + satellite imagery.
Always interested in connecting with people working in GIS, GeoAI, remote sensing, mapping and spatial AI.
1
238

GIS software engineer who bring AI into GIS & real estate
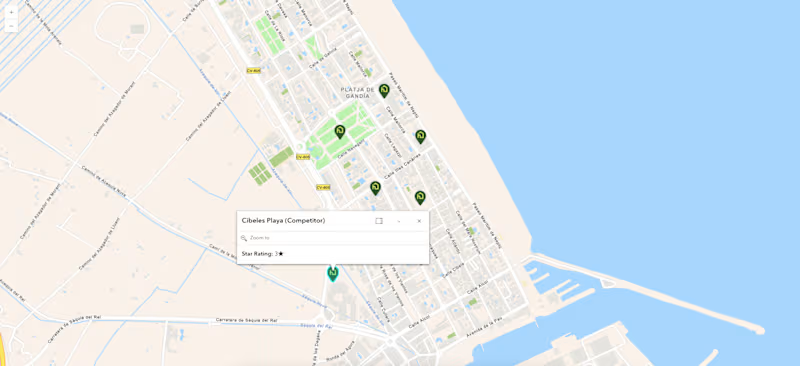
🗺️ Map design is where technical GIS data meets user adoption. For this ArcGIS API project, we engineered a dynamic spatial intelligence tool—featuring custom polygon territories, real-time geocoded competitor benchmarking with interactive popups, and clean SVG pin UI layers. Result? Clients turn complex competitor metrics into clear, actionable site selection insights instantly ⚡
3
5
465
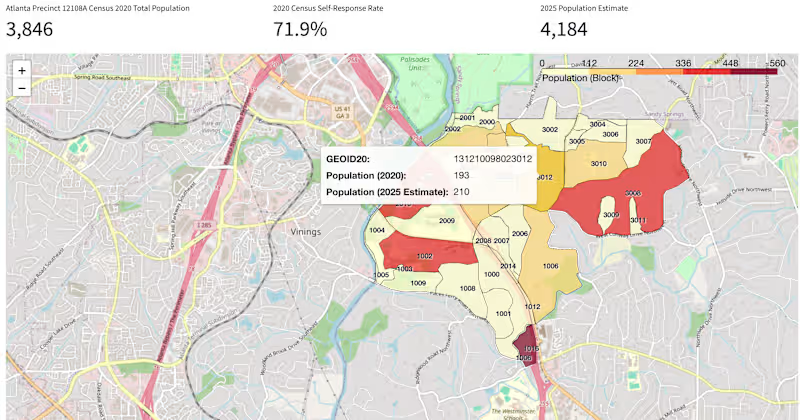
🏔️ Most organizations sit on mountains of spatial data they can't interpret fast enough. For the Census Map Application, we didn't just digitize demographic data—we built an automated spatial intelligence layer using 🤖 AI to turn raw census boundaries into real-time predictive insights 📊. Result? Decision-makers cut territory planning time from days to minutes ⚡
1
122
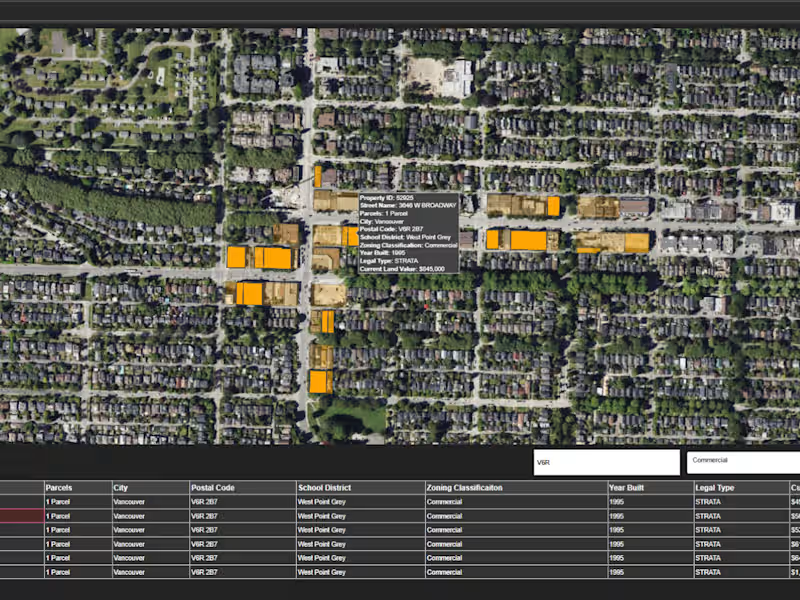
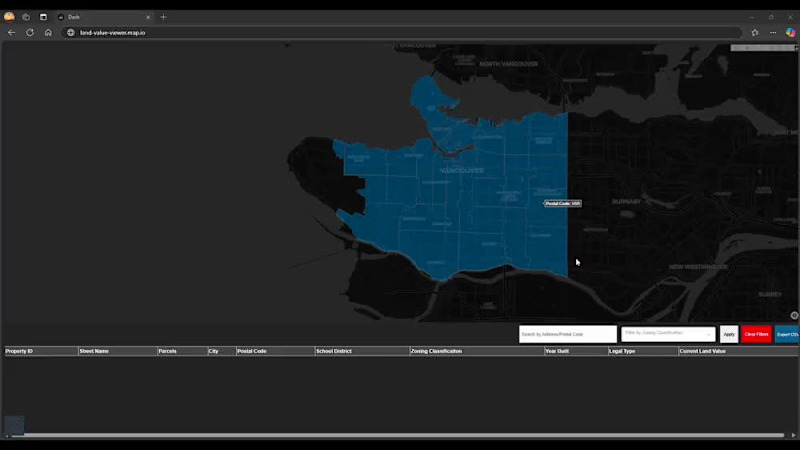
🗺️ The biggest challenge in commercial real estate valuation isn't finding data—it's separating market noise from true geographic value 📉. For the Land Value Analysis Platform, we built a high-precision GIS spatial model powered by 🤖 AI regression layers to evaluate multi-variable zoning, historical sales, and parcel boundaries instantly 📊. Result? Investors and developers pinpoint high-yield land opportunities 10x faster ⚡
0
31

Top notch Product Design
Top notch Product Design


Visual Artist in 3D, VFX, mirroring ideas into reality.
Visual Artist in 3D, VFX, mirroring ideas into reality.





Where geography meets design excellence
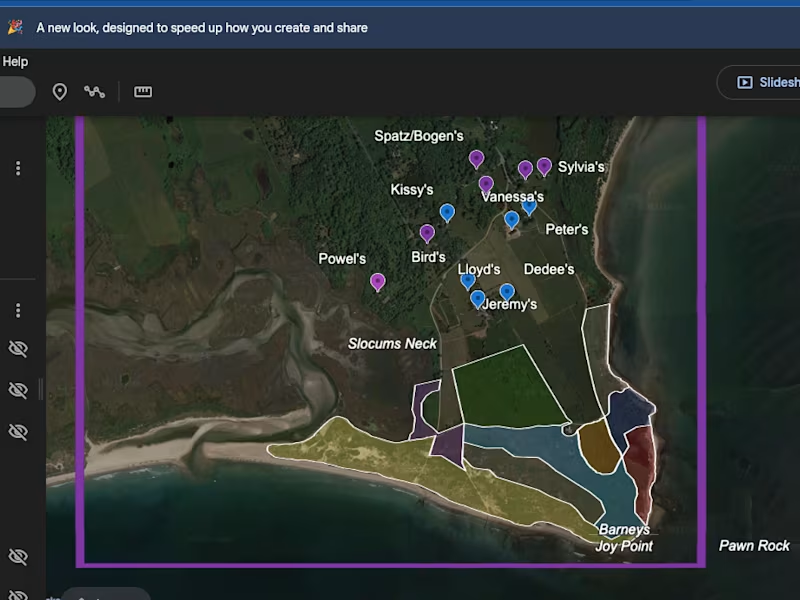
Designed and developed an interactive web visualization application featuring dynamic maps, data dashboards, and user-friendly analytics. The platform enables efficient exploration of complex data through responsive and visually engaging interfaces.
0
64