Ocean Environmental Monitoring & Pollution Drift Visualization

Yong Zhang


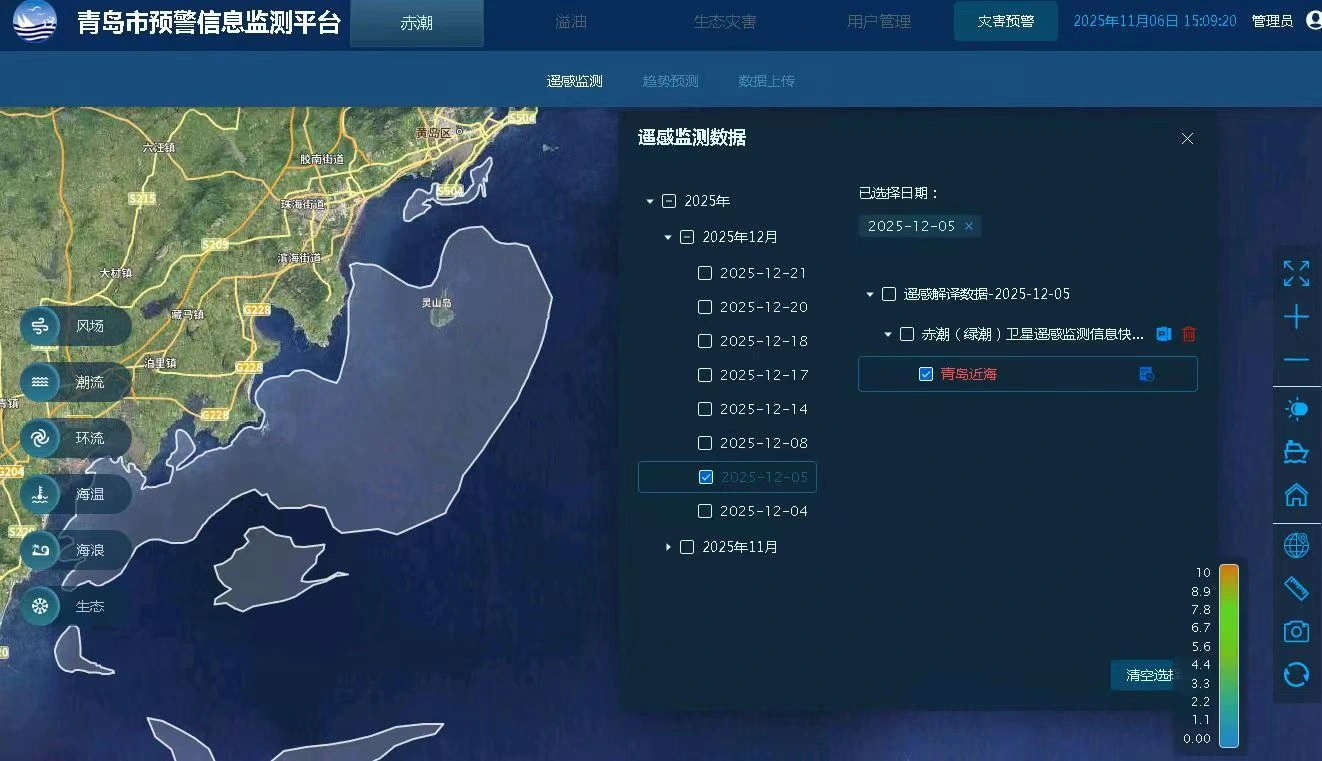
Ocean Environmental Monitoring & Pollution Drift Visualization
WebGIS · NetCDF · Time-Series Visualization · Spatial Data Processing
Project Overview
Developed the frontend and GIS capabilities of a marine environmental monitoring platform designed to visualize ocean conditions, pollution movement, inspection routes, and related operational information.
The system received periodic NetCDF datasets from the client, covering wind fields, ocean currents, waves, sea temperature, and other marine environmental data.
I worked with a backend developer on this project, taking responsibility for frontend and GIS development while also coordinating development tasks and project progress.
The project progressed through deployment, client acceptance, and subsequent refinements.
The Challenge
Marine environmental monitoring involves more than displaying static geographic information.
Environmental conditions change over time, requiring the application to present multiple data layers and allow users to examine conditions at different points along a timeline.
The project also presented several technical challenges:
Visualizing different types of time-dependent environmental field data
Supporting pollution area drawing and movement visualization over time
Integrating inspection routes and operational records with geographic views
Handling rendering inconsistencies in existing open-source visualization components
Processing environmental datasets whose rectangular coverage included both land and ocean areas
These requirements called for an integrated approach combining GIS visualization, spatial processing, temporal interaction, and business functionality.
My Role & Contributions
1. Marine Environmental Data Visualization
Developed frontend and GIS functionality to visualize multiple environmental datasets, including:
Wind fields
Ocean currents
Wave conditions
Sea temperature
Additional marine environmental data categories
Integrated the visualization capabilities into the monitoring interface, allowing different types of marine information to be displayed geographically.
2. Time-Series Visualization & Pollution Drift
Implemented timeline-based interaction for examining environmental conditions at different times.
Developed functionality for drawing pollution areas and visualizing their movement as the timeline changes.
This connected temporal environmental information with the geographic representation of pollution-affected areas.
3. Spatial Data Filtering
Addressed a geographic coverage issue in which rectangular environmental datasets extended across both land and marine regions.
Used mainland polygon geometry to spatially filter data points before rendering, reducing unwanted visualization over land areas.
This improved the geographic relevance of the displayed environmental information.
4. Visualization Component Adaptation
Adapted existing open-source field visualization capabilities to the project's requirements.
Investigated and corrected issues involving rendering styles, geographic extent calculations, and abnormal display behavior.
These adjustments helped integrate environmental field visualization into the broader WebGIS application.
5. Operational Features & Project Delivery
Developed GIS-related functionality for inspection routes and operational information.
Implemented application features supporting the upload and approval of photos, videos, and reports.
Collaborated with the backend developer, coordinated development tasks and progress, and participated in deployment, client acceptance, and subsequent requirement changes.
Engineering Outcome
Delivered frontend and GIS functionality for a marine environmental monitoring system that brought together time-dependent environmental datasets, pollution movement visualization, spatial filtering, and operational workflows.
The project demonstrates practical experience integrating specialized geographic data processing and visualization with real-world business requirements.
My work covered not only individual visualization features but also component adaptation, frontend integration, development coordination, and delivery-stage problem solving.
Technologies & Engineering Areas
WebGIS · NetCDF · Geospatial Visualization · Time-Series Data · Spatial Polygon Filtering · Frontend Development · Environmental Data Visualization
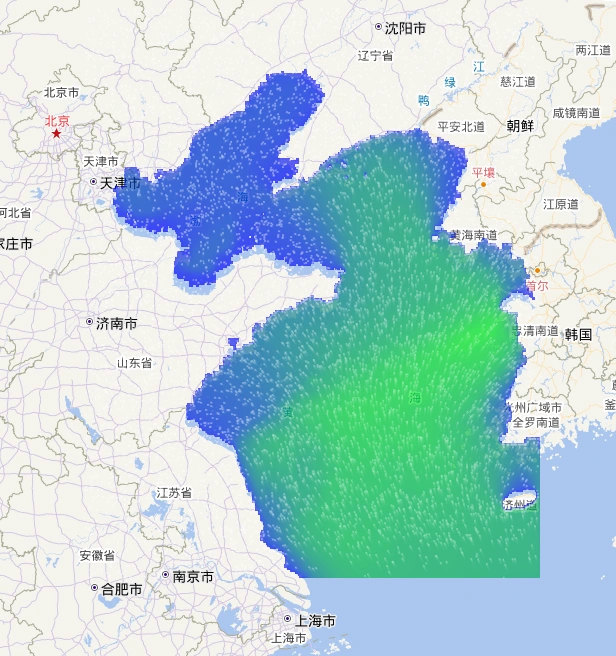
Ocean field visualization combining scalar values and directional flow patterns on a geographic map.
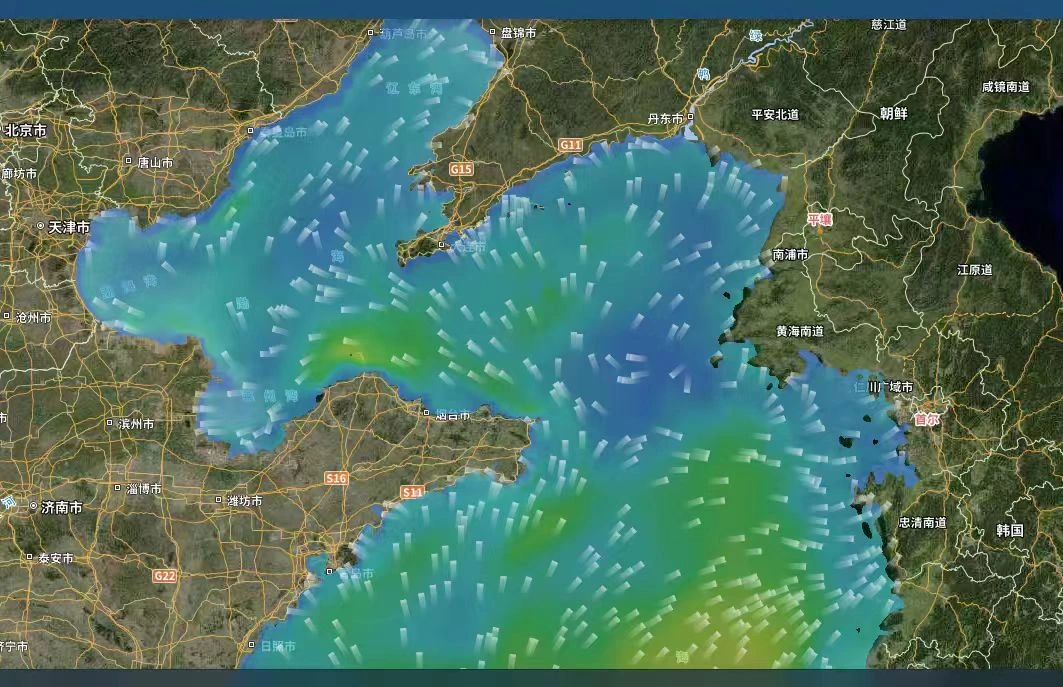
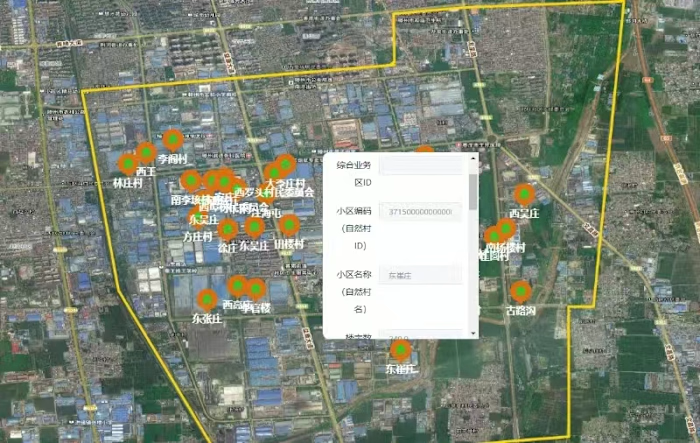
Marine environmental monitoring on a satellite basemap, showing time-dependent ocean field data and directional visualization.
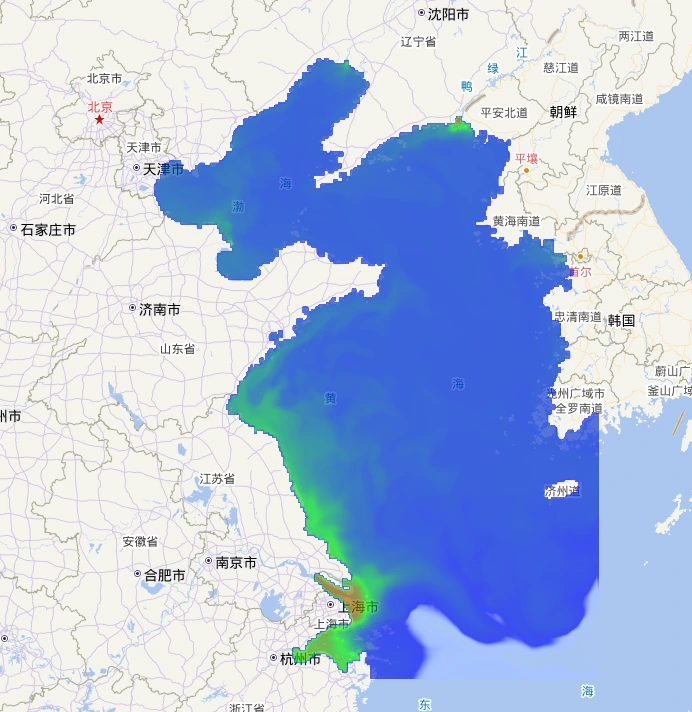
Spatial visualization of gridded marine field data after processing and filtering for map-based display.
Like this project
Posted Oct 28, 2026
Developed WebGIS visualizations for time-series NetCDF marine data, pollution drift, spatial filtering, inspection routes and operational workflows.