
HONGDAN CHEN
Spatial Data Visualization & AI Workflow Systems
Ready for work
HONGDAN is ready for their next project!

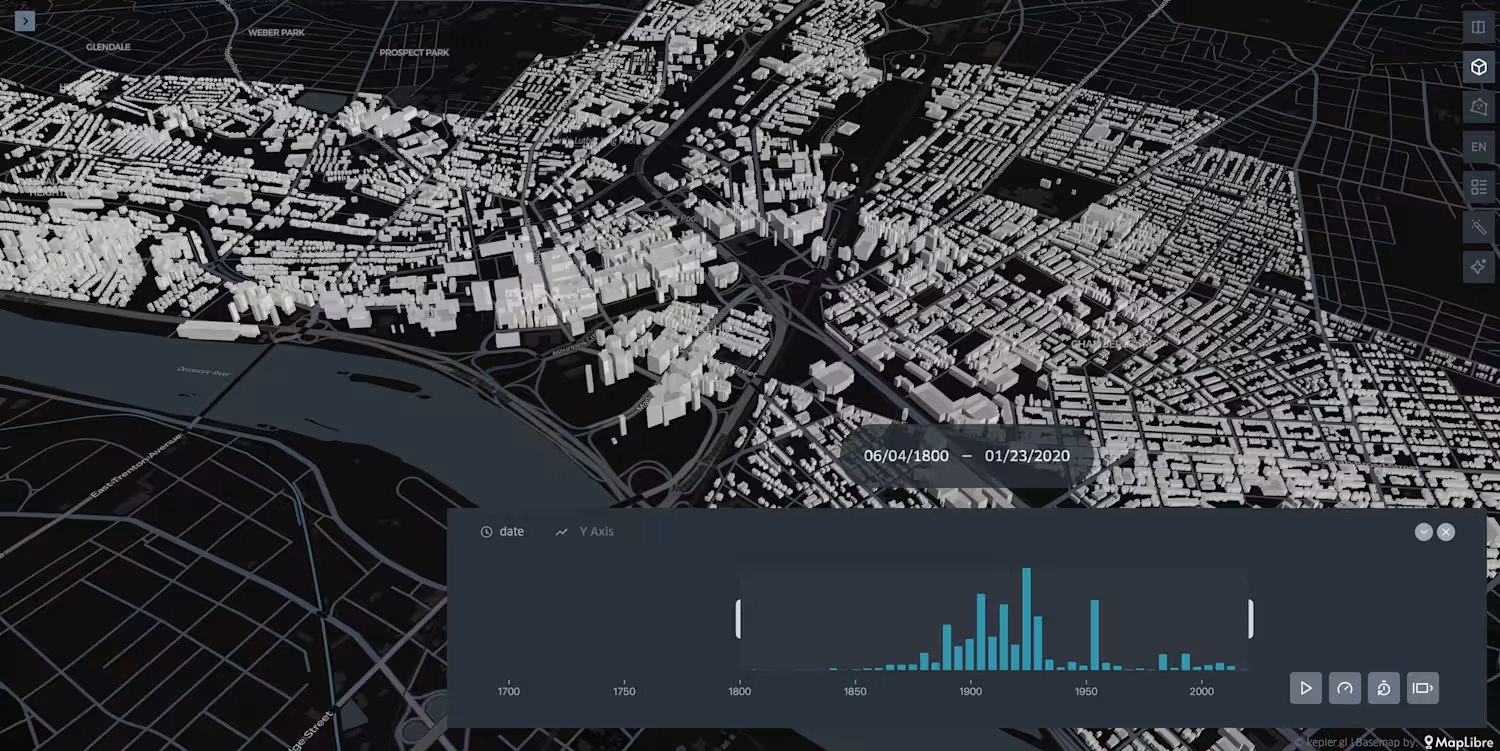
From static maps → interactive spatial experiences. 🚀
Recently experimented with building a Geo-inspired commute dashboard using Vibe Coding + geospatial visualization.
The interesting shift for me:
Instead of spending days moving between GIS software, frontend development, and UI iteration, ideas can become working interfaces much faster.
Still early, but it opens up interesting possibilities:
→ spatial analytics that feel more accessible
→ interfaces ready for predictive layers and AI workflows
→ reducing the barrier between geographic data and end users
Curious where GIS + AI + Vibe Coding goes next.
2
114
One of the most interesting shifts in AI right now:
Real estate AI systems are only as smart as the spatial data behind them.
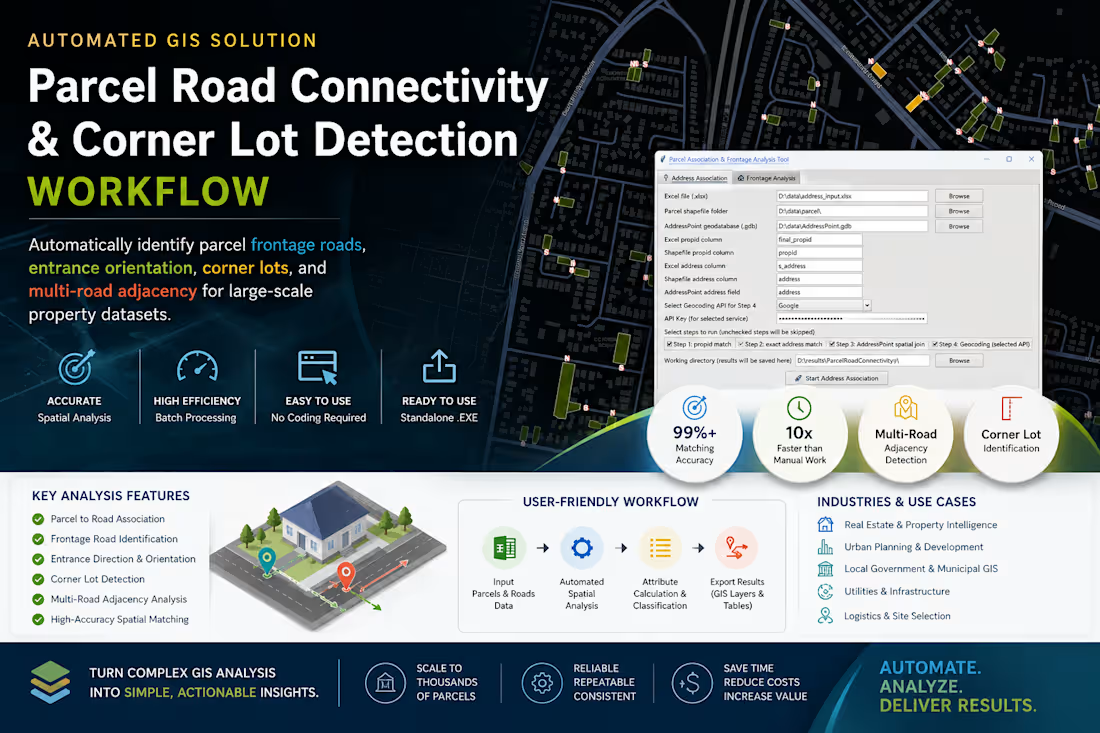
Just wrapped up a GeoAI-oriented automation project for large-scale parcel intelligence in Australia.
Built a standalone workflow that automatically detects:
→ frontage roads
→ corner lots
→ parcel orientation
→ multi-road adjacency
→ spatial access relationships
The interesting part wasn’t the GIS itself.
It was converting messy spatial relationships into structured knowledge that downstream AI systems can actually understand.
A lot of “AI for real estate” conversations focus on LLMs.
But the real bottleneck is often:
How do you turn geography into machine-readable reasoning context?
Ended up packaging the entire workflow into a production-ready executable app for non-technical teams, with batch processing + configurable spatial rules.
Feels like we’re moving from:
“mapping data” to “building spatial reasoning infrastructure.”
#GeoAI #PropTech #SpatialComputing #Automation #GIS #AIInfrastructure
1
188
🚀 Most people calculate driving distances one route at a time.
That doesn’t scale.
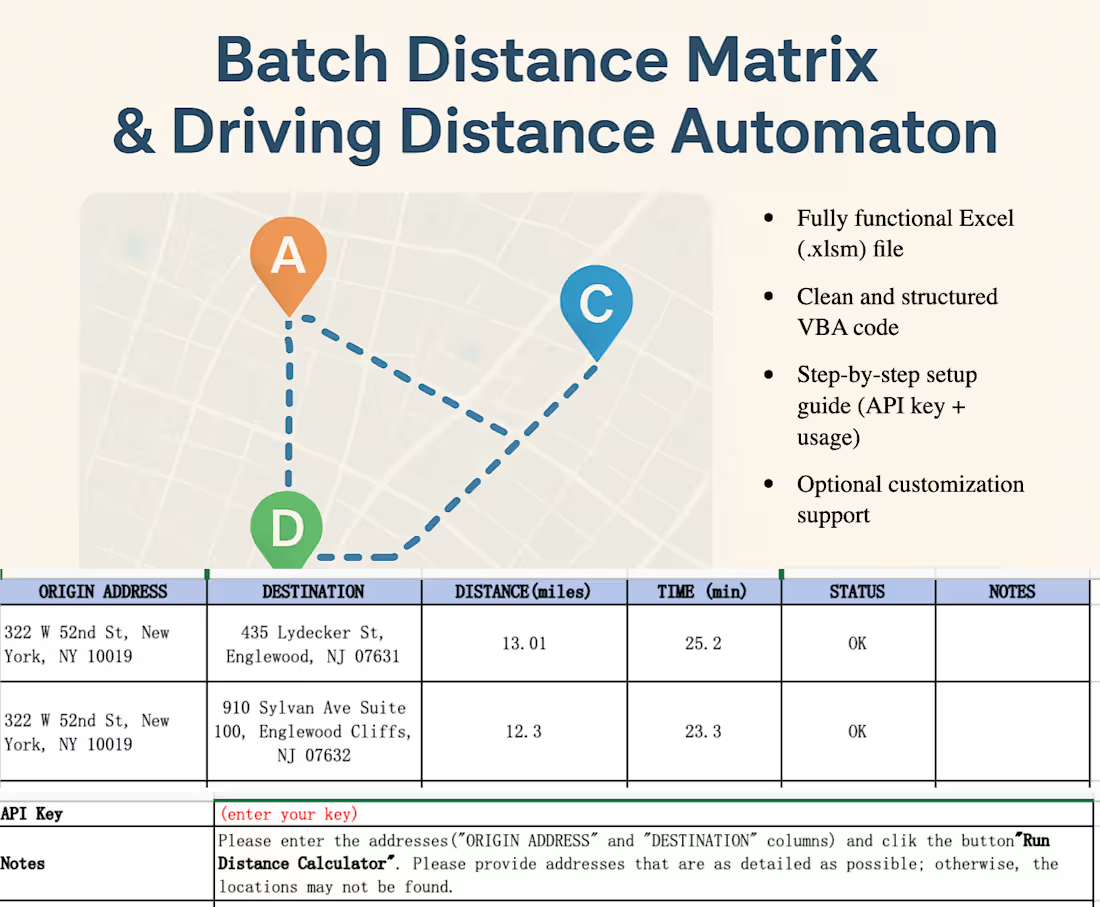
I built an Excel-based tool that automates distance and travel time calculations for large datasets using an API.
You can input hundreds of origin–destination pairs and get:
☑️ Distance (miles/km)
☑️ Travel time (minutes)
☑️ All processed in bulk, directly in Excel.
This is particularly useful for:
☑️ Freight pricing models
☑️ Logistics planning
☑️ Route analysis
☑️ Location-based datasets
What used to take hours can now be done in minutes.
Happy to share more details or customize it for specific workflows.
https://contra.com/s/eFoEEFRF-bulk-driving-distance-and-time-calculator-excel-api-automation
1
144
I create interactive 3D city visualizations showing how urban areas evolve over time. Using Kepler.gl (http://Kepler.gl), building footprint data is visualized in 3D with a time slider based on construction year, revealing the growth of a city.
Each building is clickable and includes a direct link to street-level imagery in Google Street View, allowing users to explore the real-world view of the building.
This visualization is ideal for urban planning, real estate analysis, city storytelling, and digital twin presentations.
2
183