The network for creativity
Join 1.25M professional creatives like you
Connect with clients, get discovered, and run your business 100% commission-free
Creatives on Contra have earned over $150M and we are just getting started
Back to feedPost

I create interactive 3D city visualizations showing how urban areas evolve over time. Using Kepler.gl, building footprint data is visualized in 3D with a time slider based on construction year, revealing the growth of a city.
Each building is clickable and includes a direct link to street-level imagery in Google Street View, allowing users to explore the real-world view of the building.
This visualization is ideal for urban planning, real estate analysis, city storytelling, and digital twin presentations.


The network for creativity
Join 1.25M professional creatives like you
Connect with clients, get discovered, and run your business 100% commission-free
Creatives on Contra have earned over $150M and we are just getting started

Challenges
View all


Related posts

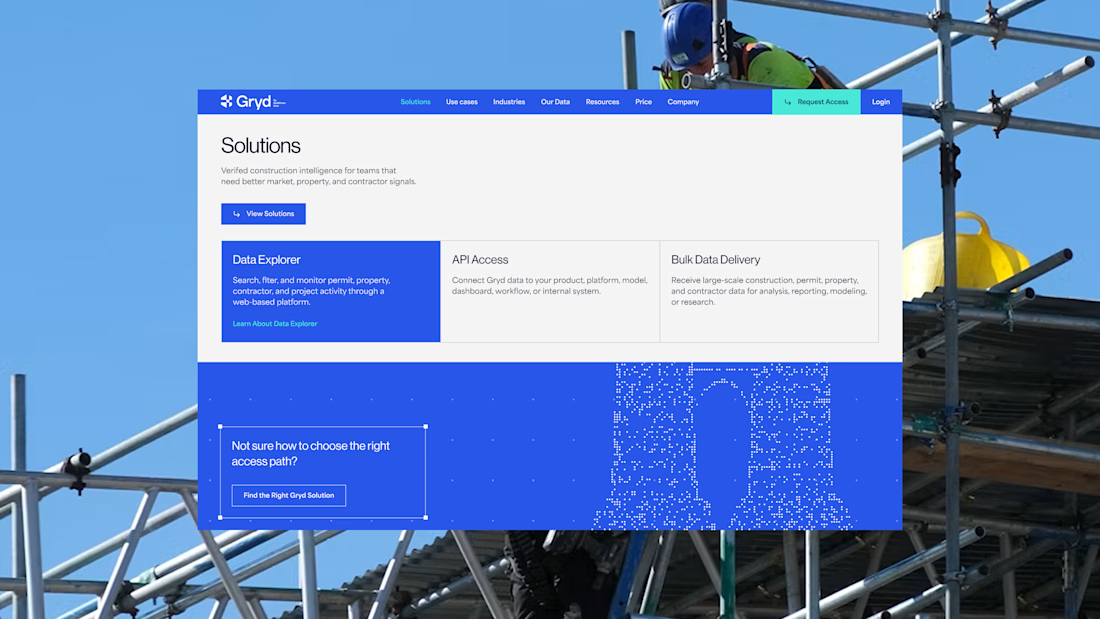
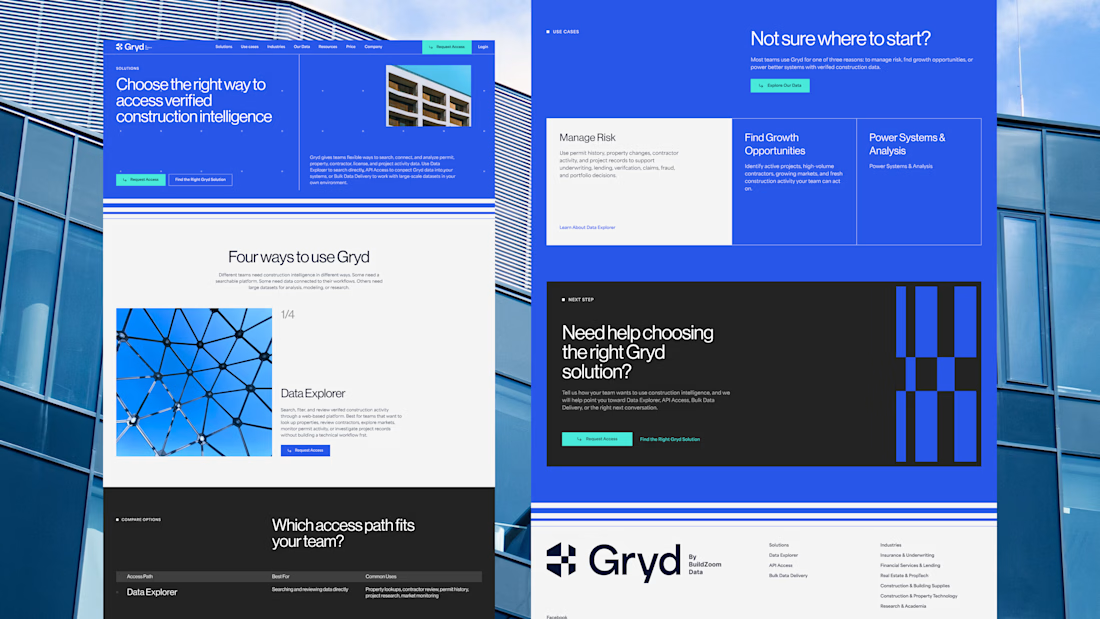
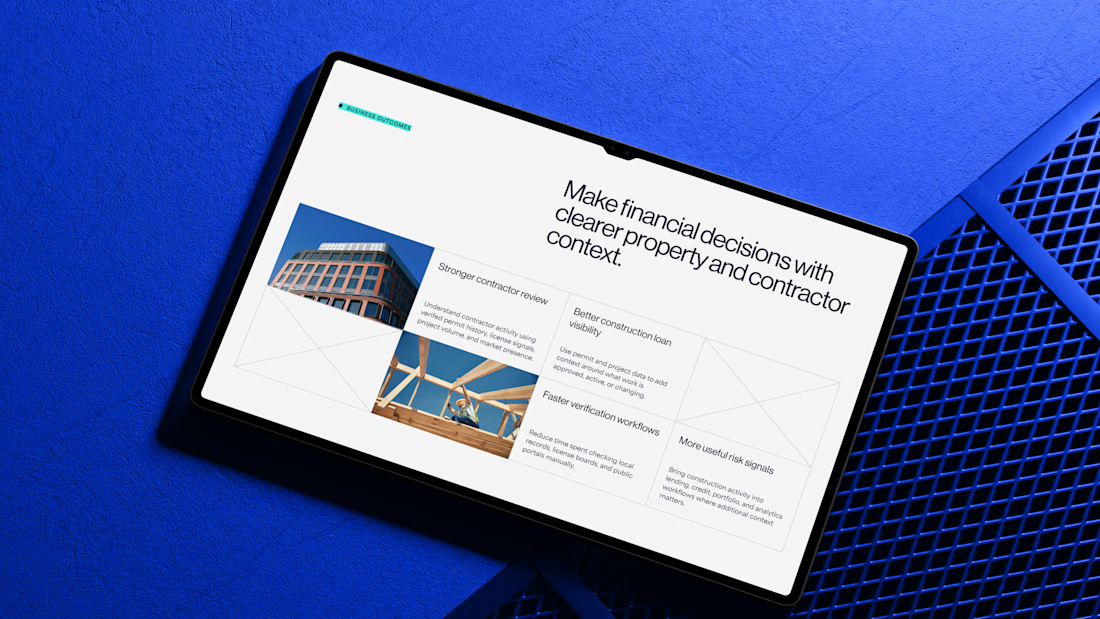
30+ pages, 3 weeks, and honestly one of my favorite projects in a while.
I'd been wanting to design something more tech-driven for a long time, and Gryd, a platform turning construction permit data into intelligence for insurers, lenders, and real estate teams, was exactly that.
Wireframes first, then UI across every page, fully responsive, with animation on the key screens, all built inside the brand the client had already set.
Case study's on my profile.

Clean design 😍


An immersive, scroll-driven 3D website concept created around the Tesla Cybertruck.
The Cybertruck was built and prepared in Blender before being brought into XrollY, where I created the main scroll-controlled 3D sequence, including camera movements, product transitions, rotations, and visual reveals.
Rive was used for additional interactive motion elements, while the complete experience was embedded into Framer to create the final website.
The result combines real-time 3D storytelling with interactive interface animation, while keeping the 3D experience independent and embeddable.
Stack: Blender · XrollY · Rive · Framer · Web 3D · Scroll-based Animation
Part of my ongoing exploration with XrollY — a platform I'm building for creating, animating, and embedding scroll-driven 3D experiences across the modern web.
Live Link: tesla-3d.framer.website
Full Case Study: Check it out


Best rive usage


Love it!!!


