AI Engineer - Python, React, Node, FastAPI, SQL, AWS, APIs
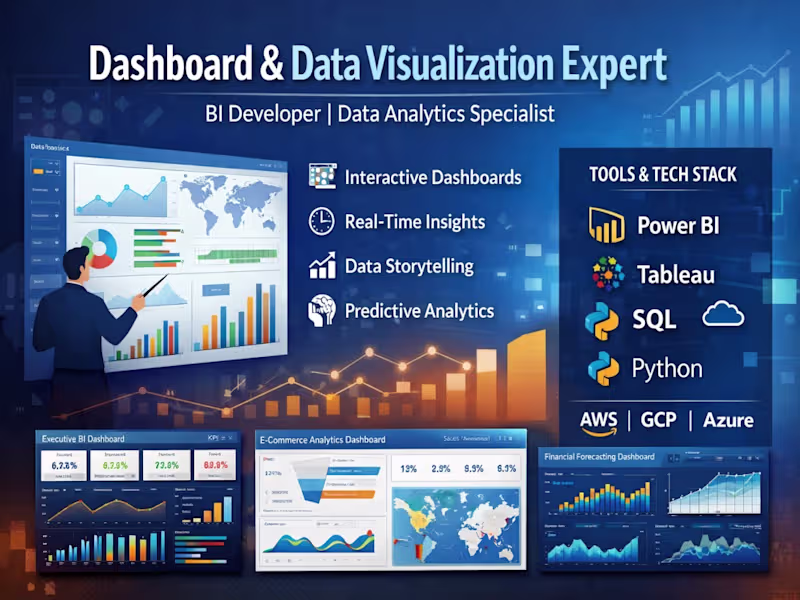

Data Science and Visualization Expert
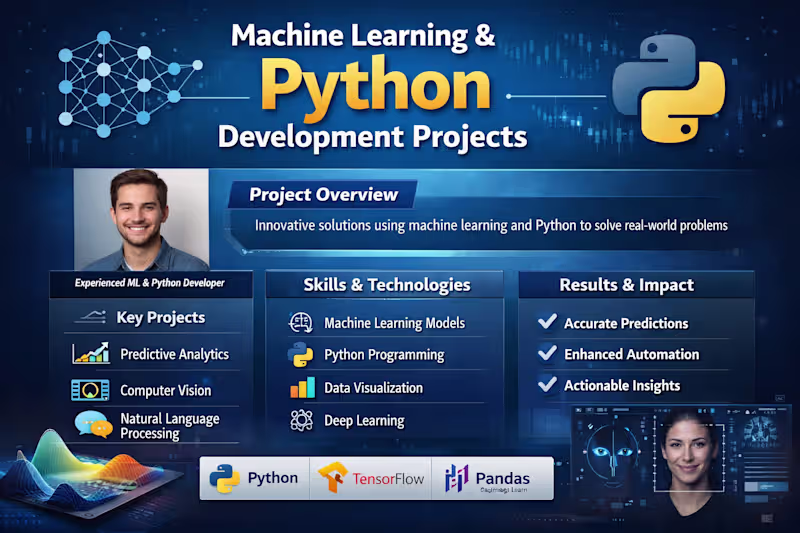
Data Scientist: Python, RStudio, ML, BI, NLP, DL, LLM
Data Scientist: Python, RStudio, ML, BI, NLP, DL, LLM

Transforming complexity into clarity through data.
Transforming complexity into clarity through data.


Data Science with Machine Learning Algorithms Expertise
Data Science with Machine Learning Algorithms Expertise

Data visualization engineer, Data Analyst, BI Expert
Driving Innovation with AI, Data & Strategy ✨
Driving Innovation with AI, Data & Strategy ✨


View more →
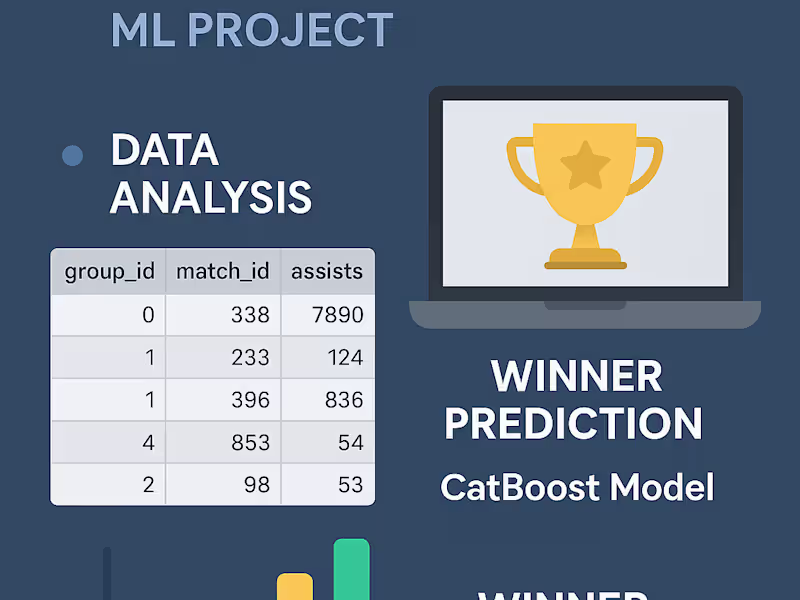
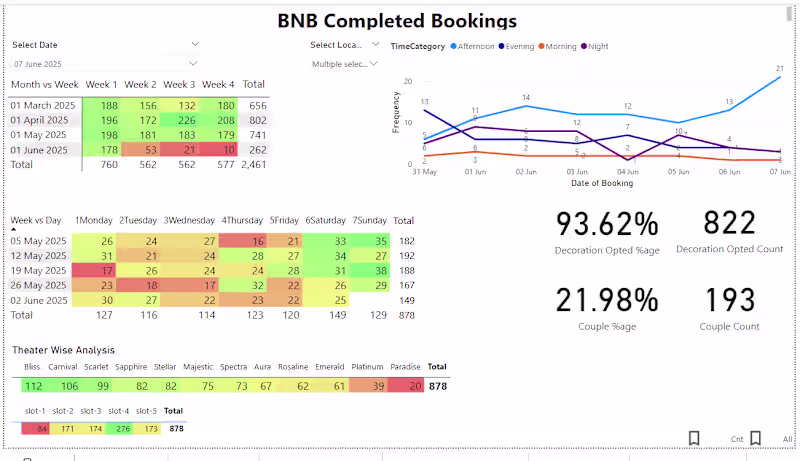
Power BI & ML Expert | Dashboards & Predictions
Power BI & ML Expert | Dashboards & Predictions


View more →