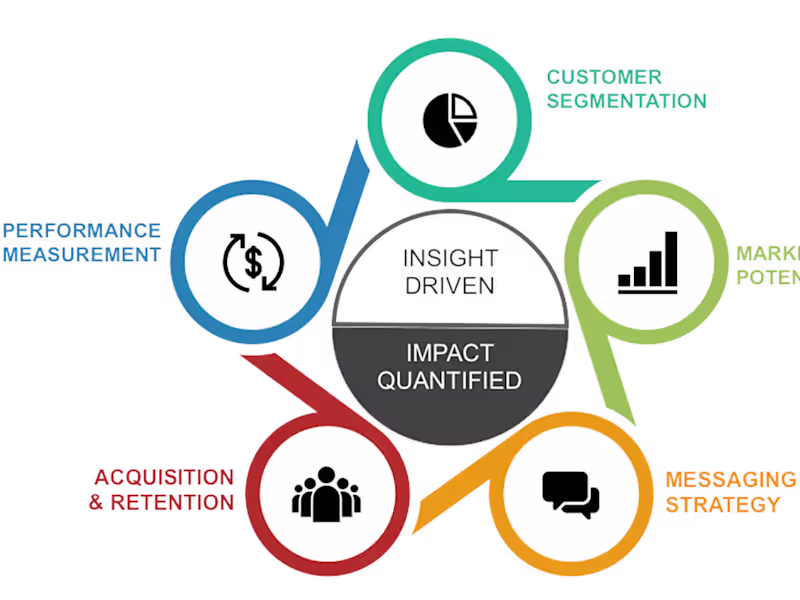
MBA, CFA Level 2 | Market Research Expert
MBA, CFA Level 2 | Market Research Expert


View more →
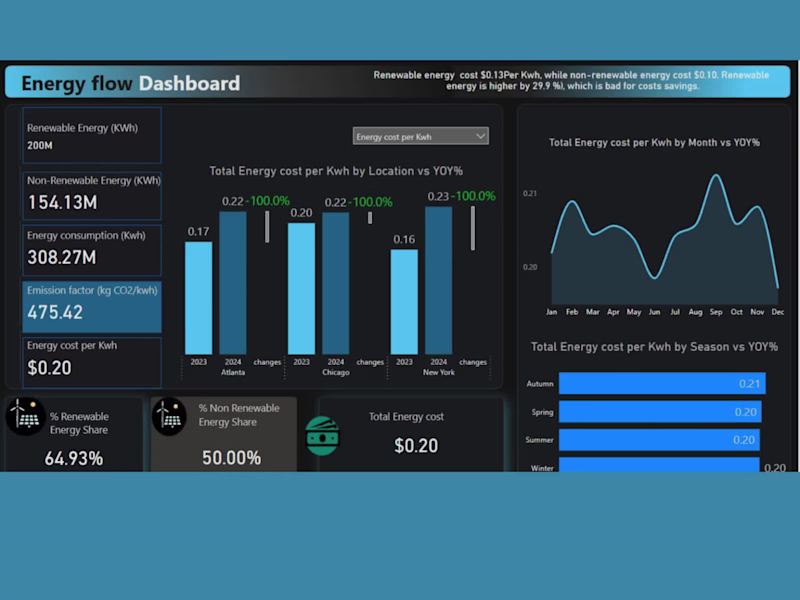
Data Analyst | SQL & Power BI Specialist
Business Intelligence Specialist | Power BI & Excel Expert
Business Intelligence Specialist | Power BI & Excel Expert

Data Science with Machine Learning Algorithms Expertise
Data Science with Machine Learning Algorithms Expertise


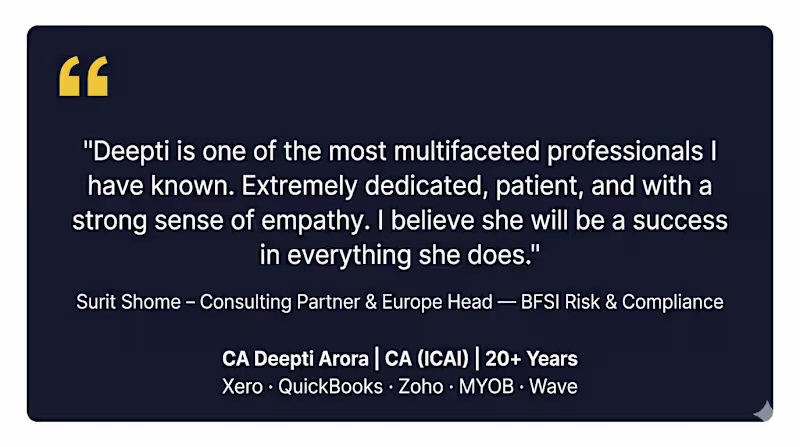
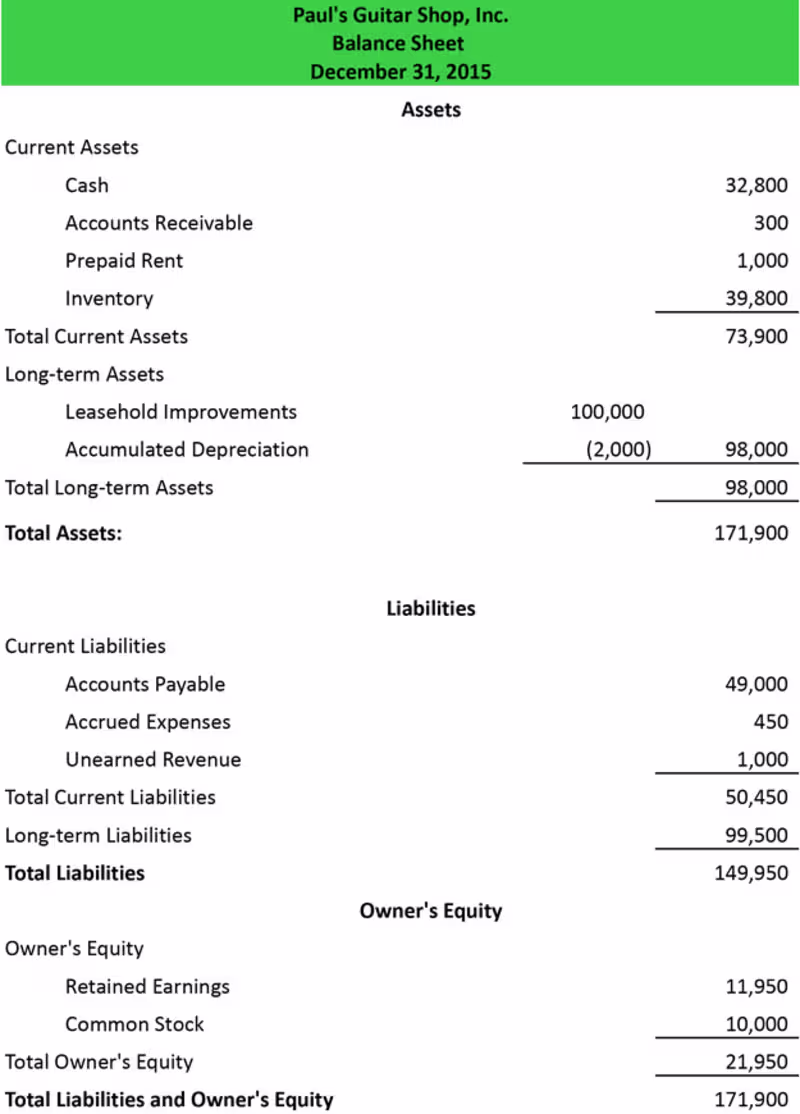
Clean books, zero stress — CA (CPA) with 20+ years
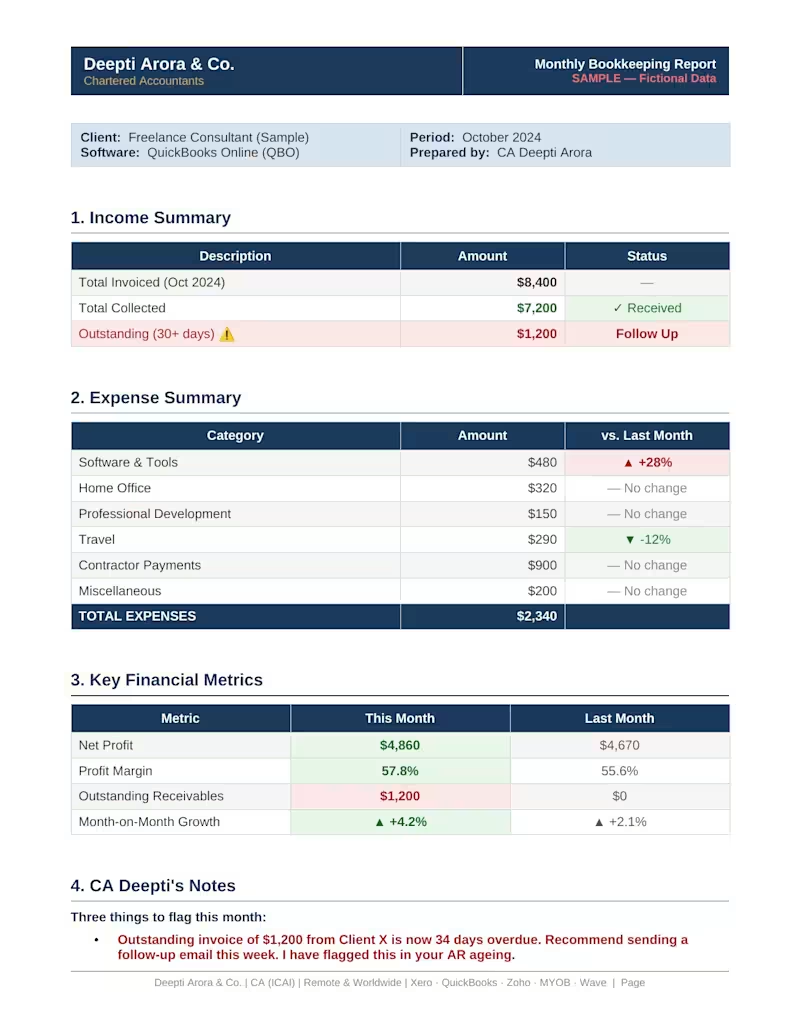
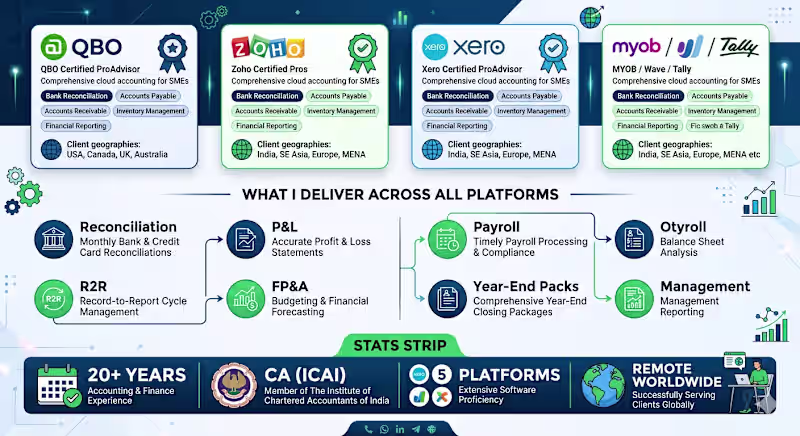

Bookkeeping and Tax Expert
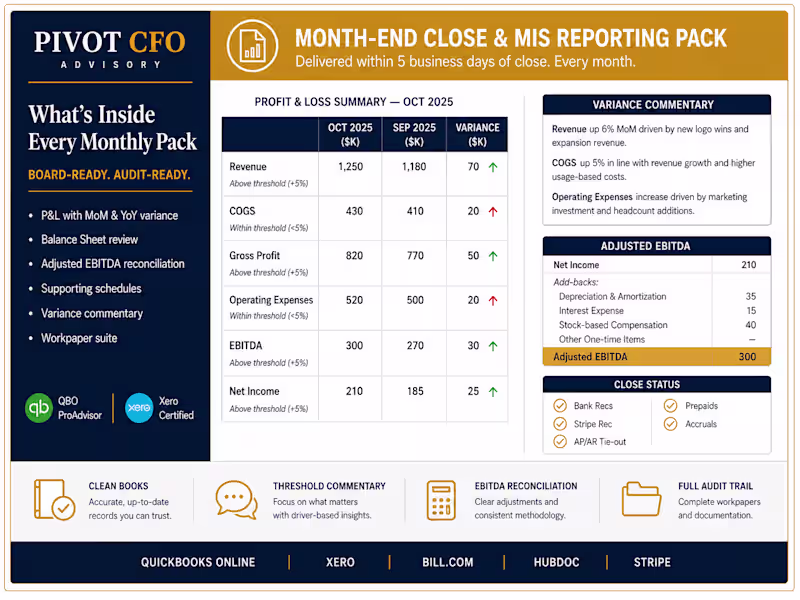
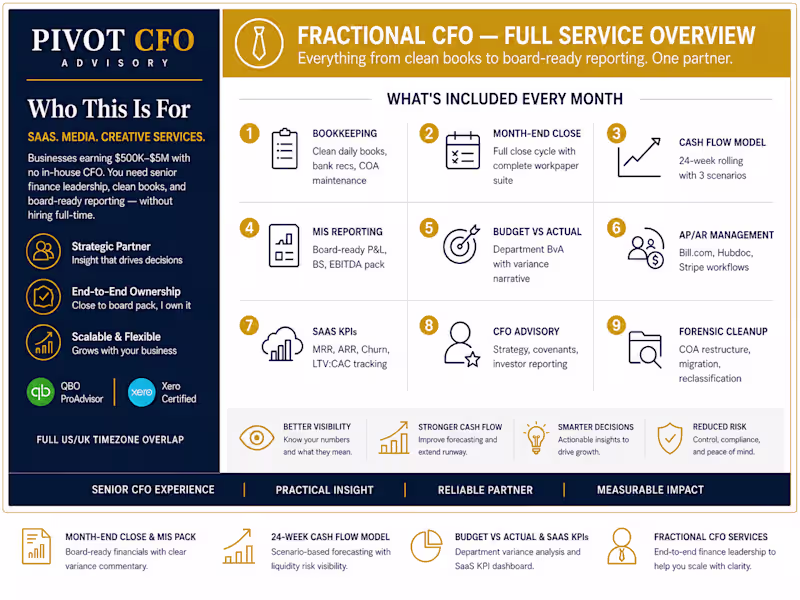
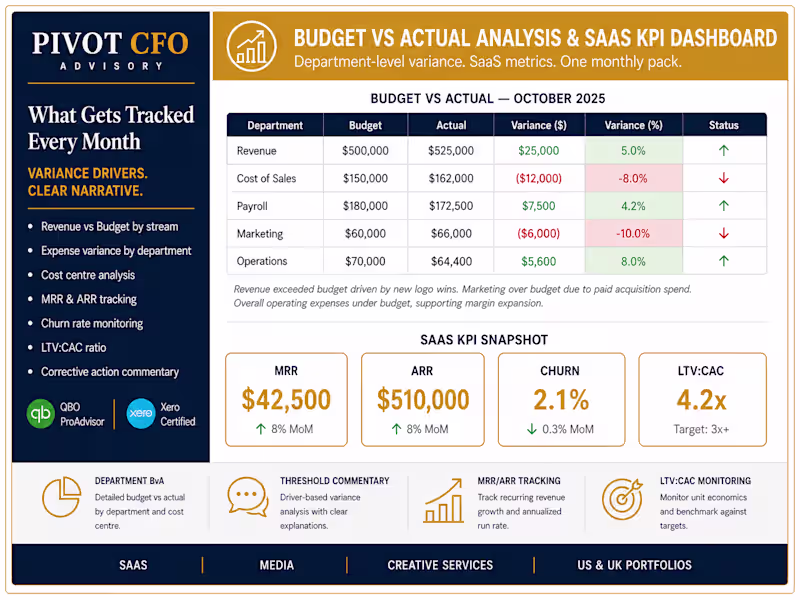
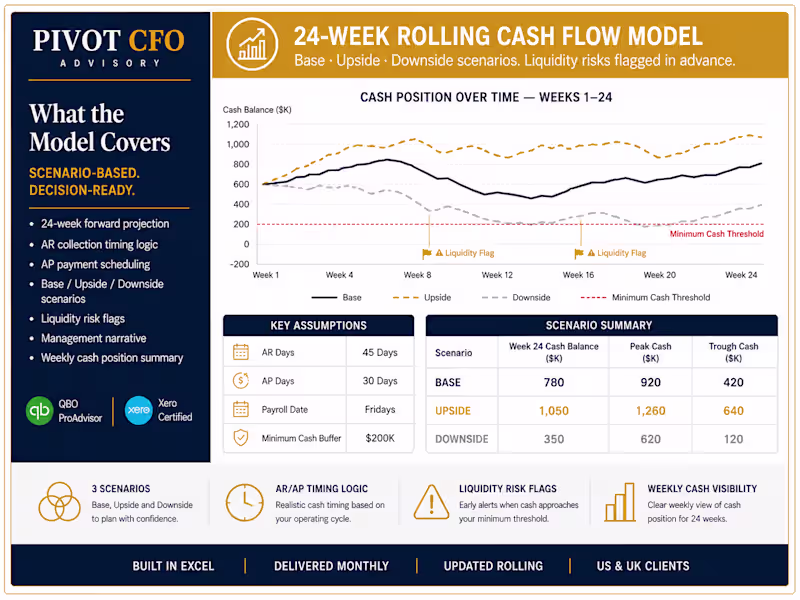
Fractional CFO | SaaS & Media Finance | Bookkeeping
Social Media, SEO & Compelling Storytelling for Real Results
Social Media, SEO & Compelling Storytelling for Real Results