The network for creativity
Join 1.25M professional creatives like you
Connect with clients, get discovered, and run your business 100% commission-free
Creatives on Contra have earned over $150M and we are just getting started
Back to feedPost


The network for creativity
Join 1.25M professional creatives like you
Connect with clients, get discovered, and run your business 100% commission-free
Creatives on Contra have earned over $150M and we are just getting started




Related posts

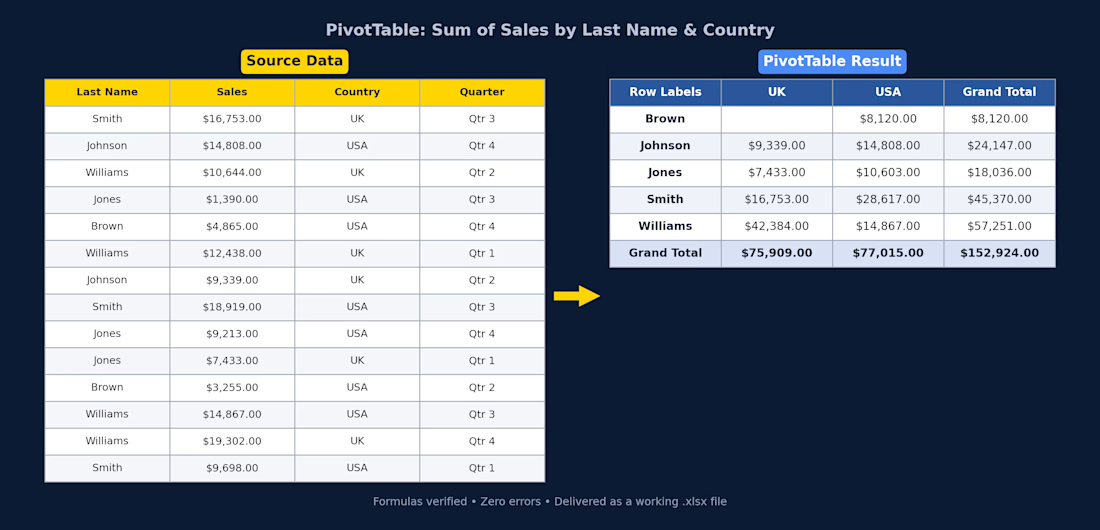
Excel PivotTable — Sales Summary
Client had raw sales data (14 rows across UK/USA, split by quarter) and needed it turned into something actually usable. I cleaned it up and built a PivotTable that breaks total sales down by rep and country, with grand totals for both.
What I did:
Structured the raw data into a proper table (consistent headers, currency formatting)
Built a PivotTable summarizing Sum of Sales by Last Name and Country
Used SUMIFS so the totals update automatically if the source data changes — nothing hardcoded
Checked every formula for errors before delivery
Delivered as a working .xlsx file, ready to plug into a bigger report or dashboard.
If you've got messy sales/ops data sitting in a spreadsheet and need it turned into something you can actually read at a glance, this is exactly the kind of thing I can help with.

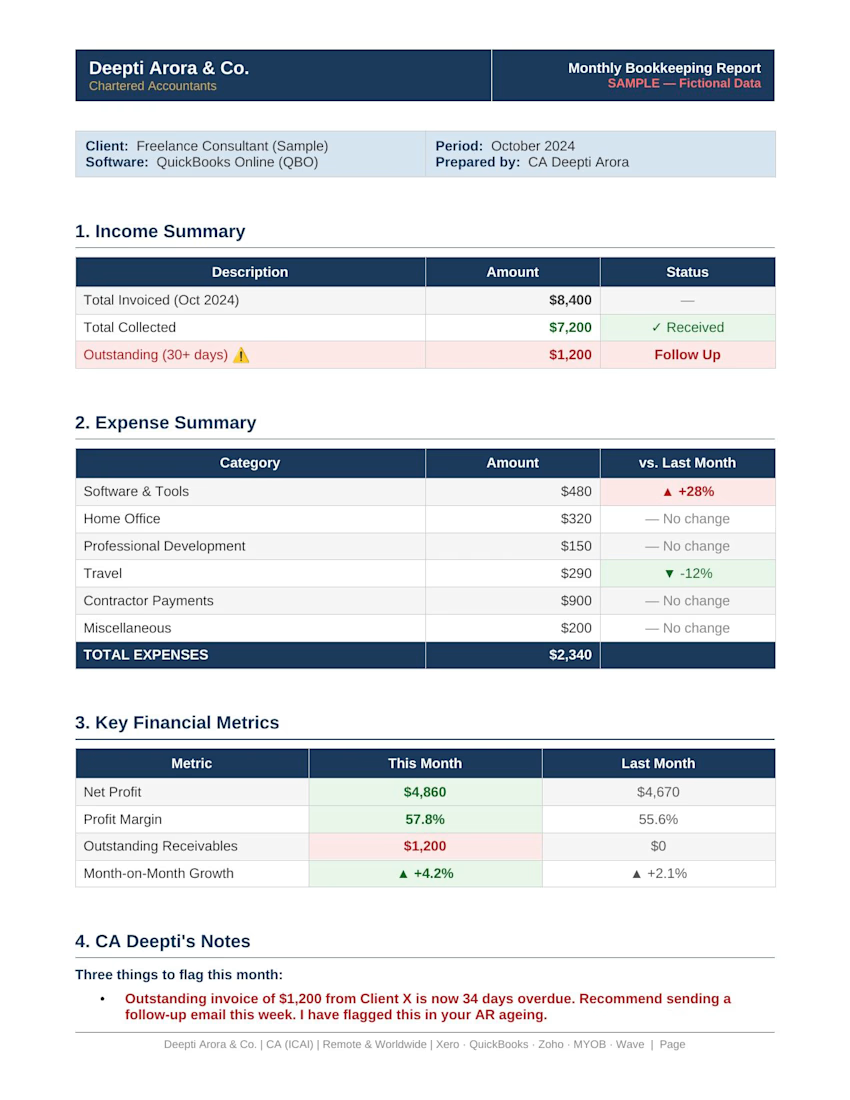
Excel Data Entry & Financial Records
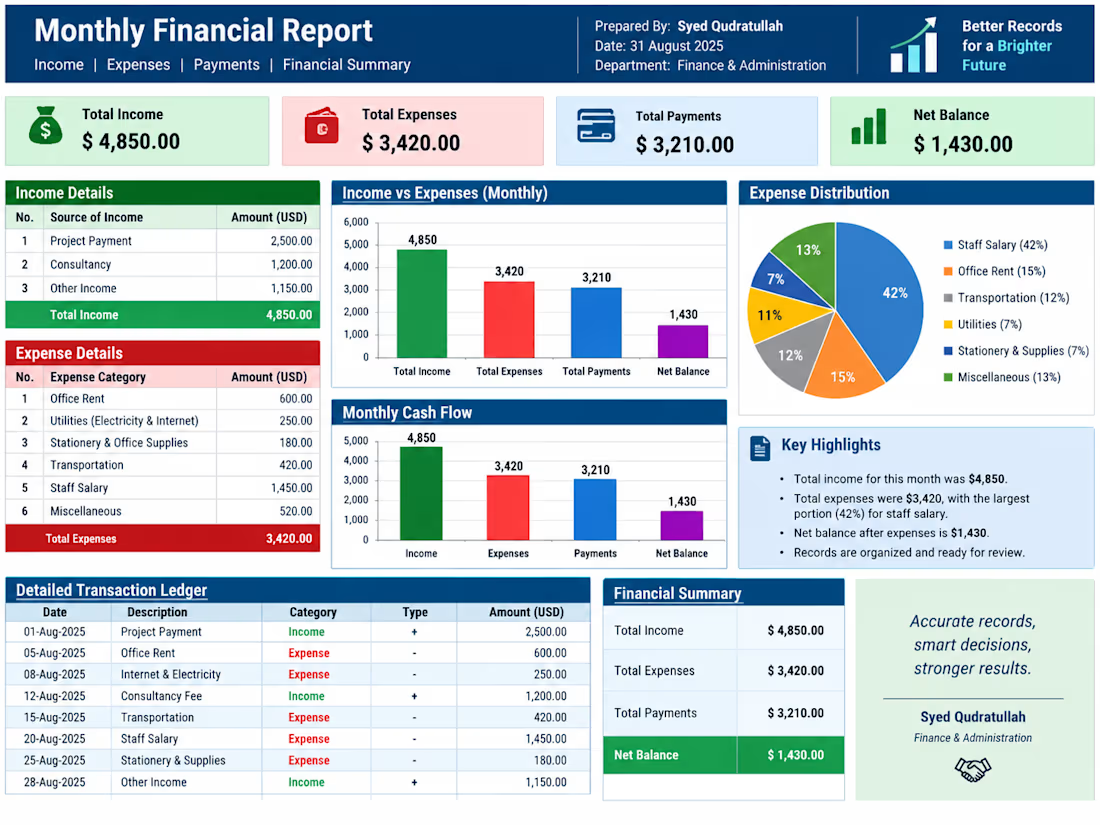
I provide accurate and organized Excel data entry and financial record management services.
✅ Excel data entry
✅ Financial records
✅ Data organization
✅ Expense & income tracking
✅ Basic reporting
If you need clean and organized financial data, feel free to contact me.



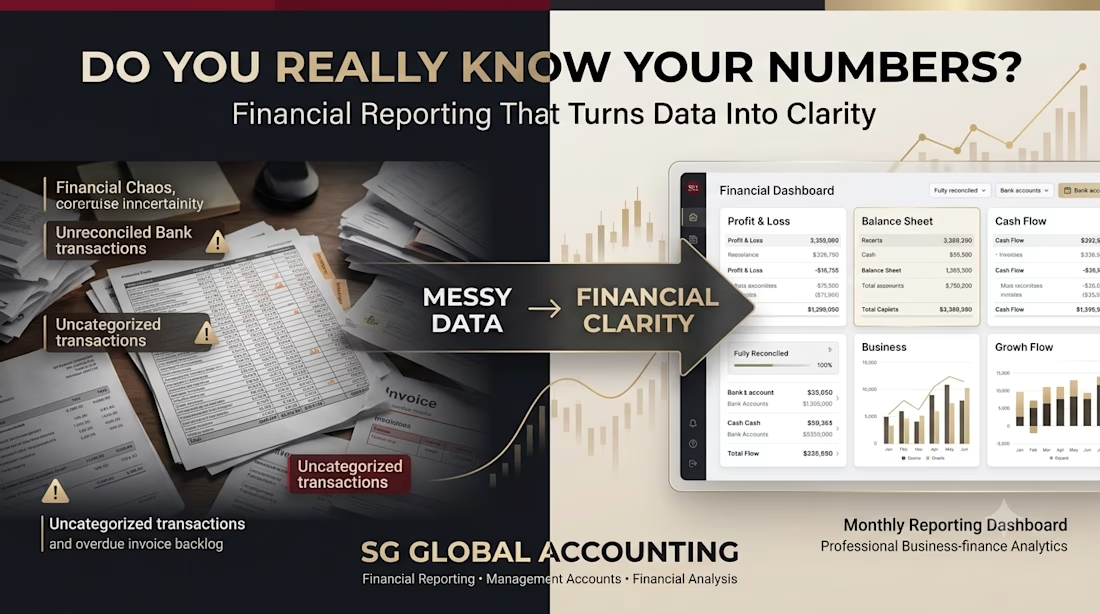
Your Business Is Making Money. But Do You Really Know Your Numbers?
Revenue is growing. Sales look good.
But cash still feels tight.
Sound familiar?
The problem may not be your revenue. It may be financial visibility.
Good financial reporting helps you understand what’s actually happening inside your business — not just what’s sitting in your bank account.
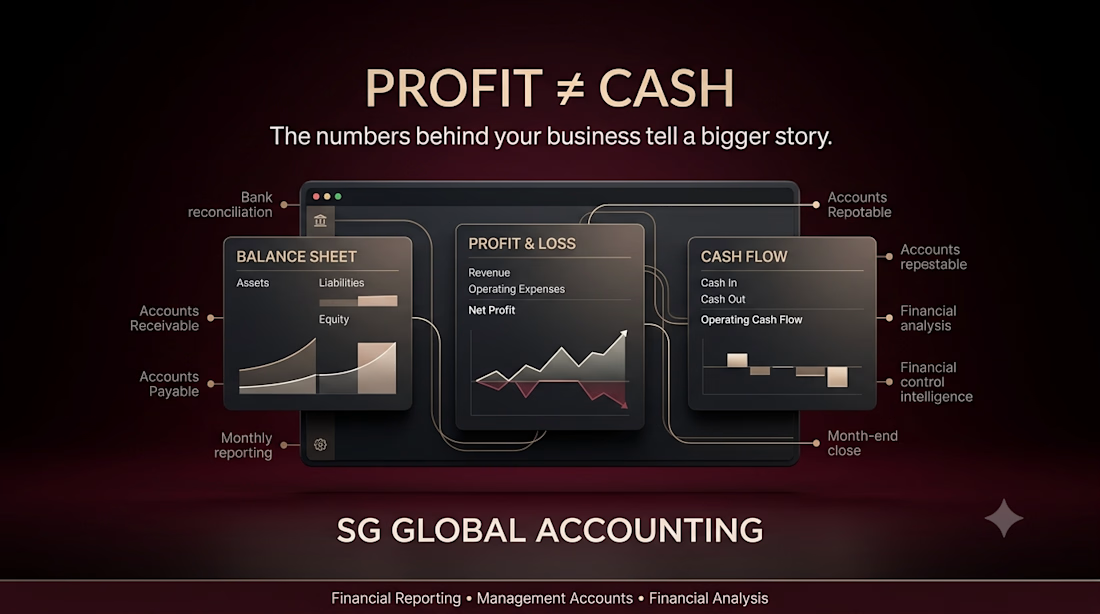
The 3 Reports Business Owners Should Know
📊 Profit & Loss
Shows your revenue, expenses, and profitability — and helps identify where your money is going.
📋 Balance Sheet
Shows your assets, liabilities, and equity so you can understand your business’s financial position.
💰 Cash Flow
Shows how money is moving in and out of the business. Because profit ≠ cash.
Here’s Where Things Usually Go Wrong
Your business might have:
Unreconciled bank accounts
Uncategorized transactions
Incorrect expense categories
Outstanding customer invoices
Unpaid vendor bills
Credit card discrepancies
Delayed month-end closing
And if the underlying books aren't accurate, your financial reports won't be reliable either.
Clean books → Accurate reconciliations → Reliable reports → Better financial visibility.
Why Monthly Reporting Matters
Waiting until year-end to understand your finances is too late to spot many problems early.
Monthly financial reporting can help you monitor:
Revenue & expense trends
Profitability
Cash flow
Accounts Receivable
Accounts Payable
Budget vs. actuals
Key financial changes
The goal isn't to create more reports.
It's to create reports that help you make better business decisions.
A Quick Check
Ask yourself:
☐ Are my bank accounts reconciled?
☐ Are my transactions properly categorized?
☐ Is my P&L accurate?
☐ Do I understand my cash flow?
☐ Are my AR & AP balances up to date?
☐ Can I explain what's changed from last month?
If you're answering “not sure” too often, your business may need better financial reporting and accounting support.
From Accounting Data to Business Clarity
At SG GLOBAL ACCOUNTING, we support businesses with Financial Reporting, Management Accounts, Bookkeeping, Bank Reconciliation, Cleanup & Catch-Up, Financial Analysis, and Month-End Support.
With 11+ years of Accounting & Finance experience, we help businesses move from:
Messy Books → Reconciled Accounts → Reliable Reports → Better Financial Visibility.
Your financial reports shouldn't just tell you what happened.
They should help you understand what happens next.