The network for creativity
Join 1.25M professional creatives like you
Connect with clients, get discovered, and run your business 100% commission-free
Creatives on Contra have earned over $150M and we are just getting started
Back to feedPost

A designer asked me: “I only send invoices. Do I really need a bookkeeper?”
Fair question. Most designers think bookkeeping is only for big companies.
But the moment you take client money, you run a business.
Say you earned 60,000 this year. It feels like profit. Now look closer:
Income: 60,000
Software: 6,000
Equipment: 8,000
Contractors: 5,000
Fees: 3,000
Tax to set aside: 10,000
Real money left: 28,000
Without records, you think you have 60,000. You have less than half.
A bookkeeper helps you:
Track every invoice
Record every expense
Keep personal and business money apart
See your real profit each month
You focus on the design. We make sure the numbers behave.
This is part of my contra series, where I explain accounting without the jargon.


The network for creativity
Join 1.25M professional creatives like you
Connect with clients, get discovered, and run your business 100% commission-free
Creatives on Contra have earned over $150M and we are just getting started
Related posts

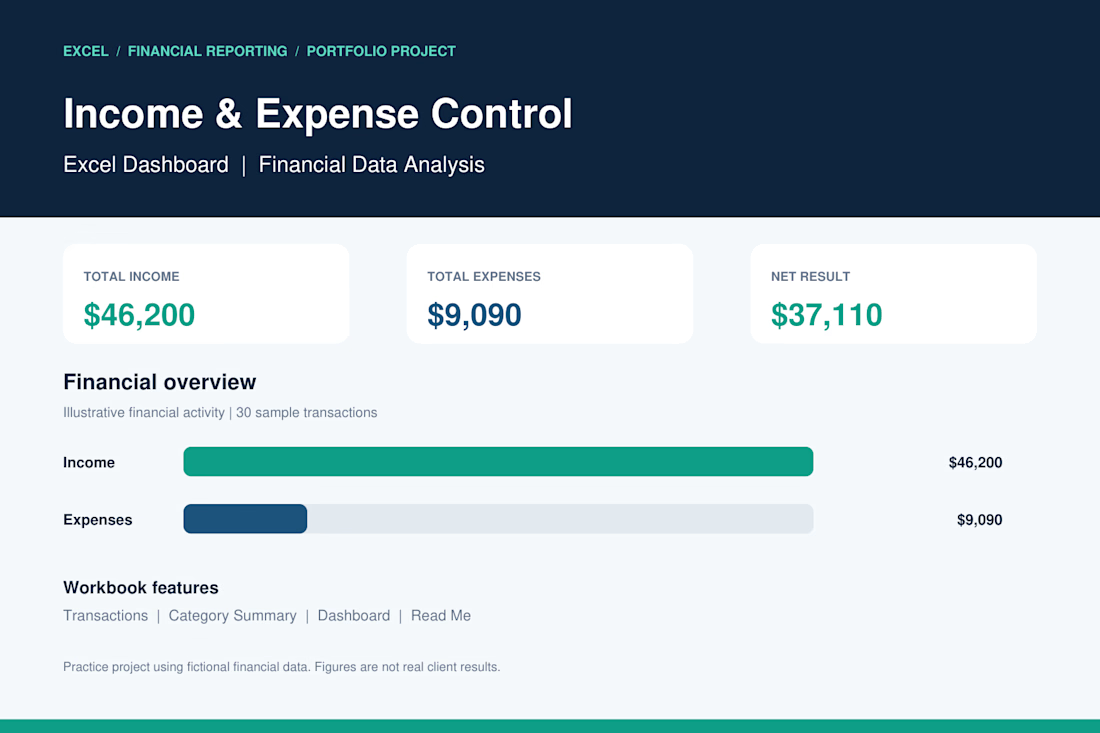
Income & Expense Control | Excel Dashboard
I developed a professional Excel dashboard as a portfolio practice project to demonstrate my skills in financial data management, income and expense tracking, and business reporting.
Project Features:
Automated income and expense calculations.
Financial dashboard with key performance indicators (KPIs).
Transaction tracking and organization.
Expense analysis by category.
Financial charts and visual reporting.
Net income calculation.
Project Results (Sample Data):
Total Income: $46,200
Total Expenses: $9,090
Net Result: $37,110
Tools: Microsoft Excel
Skills: Data Analysis, Accounting, Financial Reporting, Data Entry.
This project demonstrates my ability to organize financial records, analyze business performance, and create clear financial reports using Microsoft Excel.
Note: This is a portfolio demonstration using fictional financial data.

Great work 👏🏻

Creative business owners: Is your accounting helping you grow, or just helping you meet deadlines?
If you run a design studio, creative agency, or marketing business, you know that growth means more than landing new clients and delivering great work.
It’s also about knowing whether your business is actually making money.
You might have a full client roster, exciting projects, and growing revenue — but do you know which clients are most profitable? Whether your pricing covers your true costs? Or how much you can afford to invest in your next big move?
As an accountant, I believe your numbers should do more than keep you compliant. They should help you make smarter business decisions.
Here’s what good financial management can help you do:
📊 Understand your profitability — Know which services, projects, and clients are generating real returns.
💰 Price your services with confidence — Make sure your rates reflect your costs, time, and business goals.
📈 Manage cash flow — Plan for quieter months, cover operating expenses, and avoid unnecessary financial stress.
🎯 Make better growth decisions — Know when you can hire, invest in marketing, upgrade your tools, or expand your studio.
Because a busy agency isn’t always a profitable one. And more revenue doesn’t automatically mean more money in your pocket.
Your creativity builds the business. Your financial clarity helps you grow it.
If you run a design studio, creative business, or marketing agency and want to move beyond simply keeping your accounts up to date, let’s talk.
I’d love to help you turn your numbers into a tool for growth — not just another deadline to meet.
#CreativeBusiness #MarketingAgency #DesignStudio #AccountingForBusiness #BusinessGrowth #FinancialClarity

Your numbers should tell a story, not just tick compliance boxes.

This interactive dashboard provides a comprehensive view of profit performance across multiple dimensions—time, segments, regions, categories, and sub‑categories.
This dashboard transforms raw business data into actionable insights by allowing stakeholders to quickly identify profitable areas, spot regional trends, and evaluate category performance. It’s designed for clarity, interactivity, and decision‑making support.

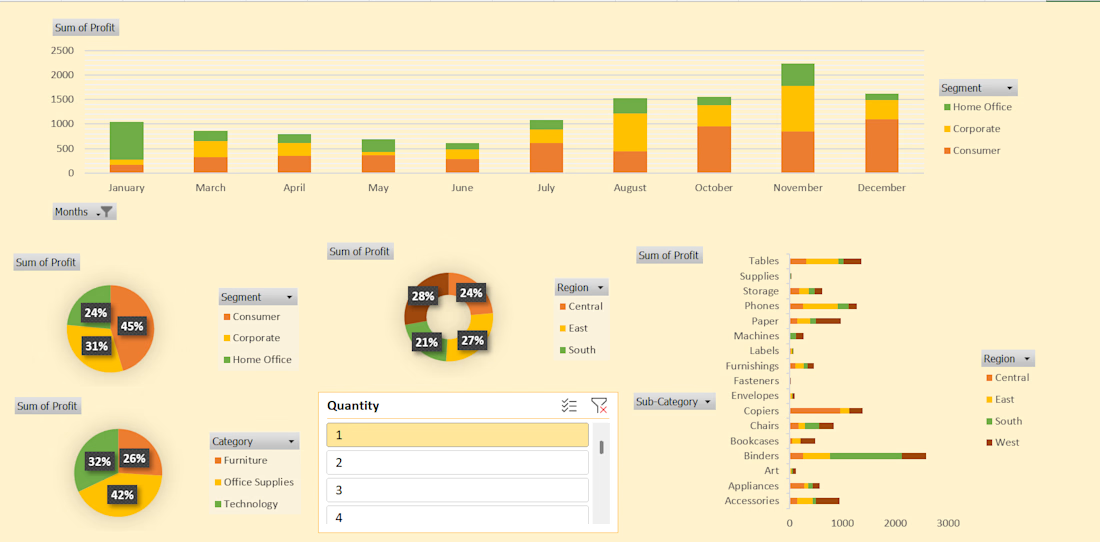
#This is an excellent Profit Dashboard which is made in MS Excel with multiple creative functions help in understanding Monthly , Yearly , Area wise Profits.