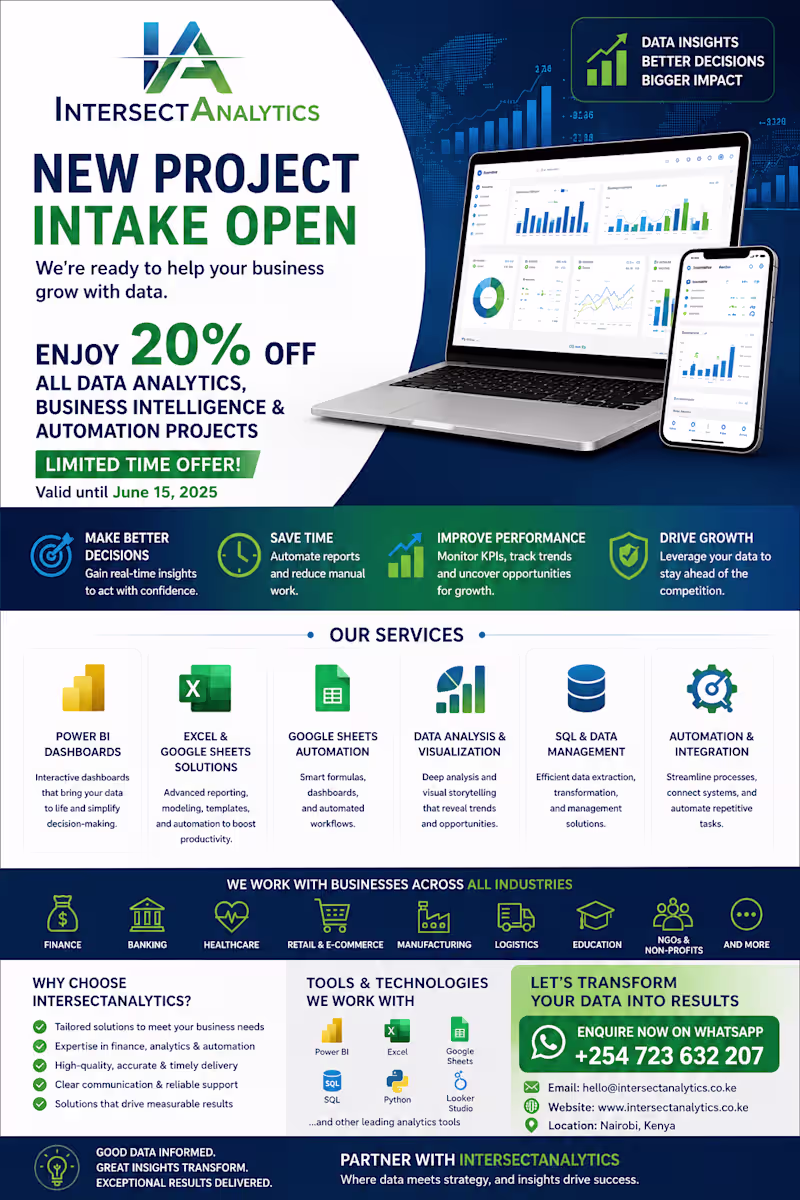
Delivering Strategic Growth Through Data, Finance & Tech.
Data Analyst | Data Engineer
Data Analyst | Data Engineer

View more →
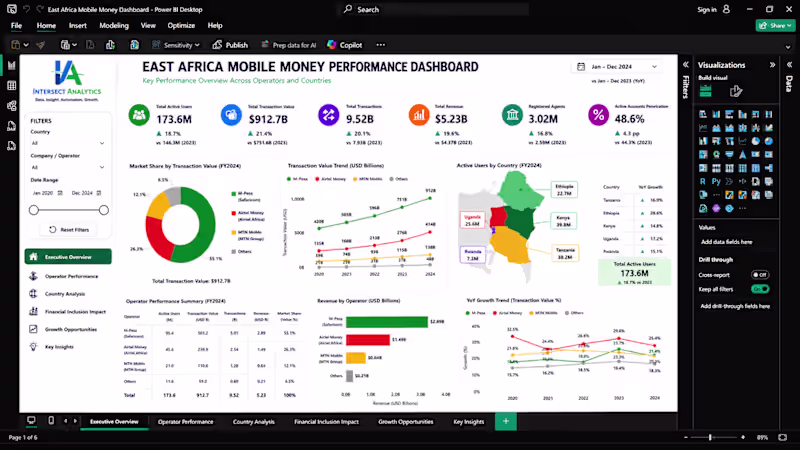
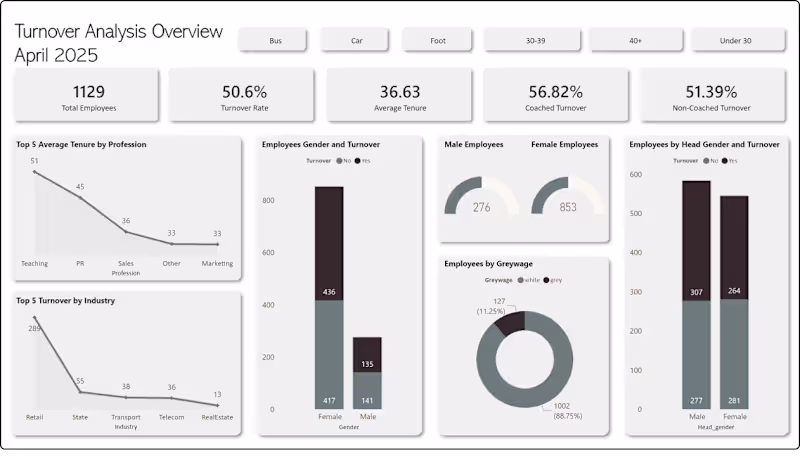
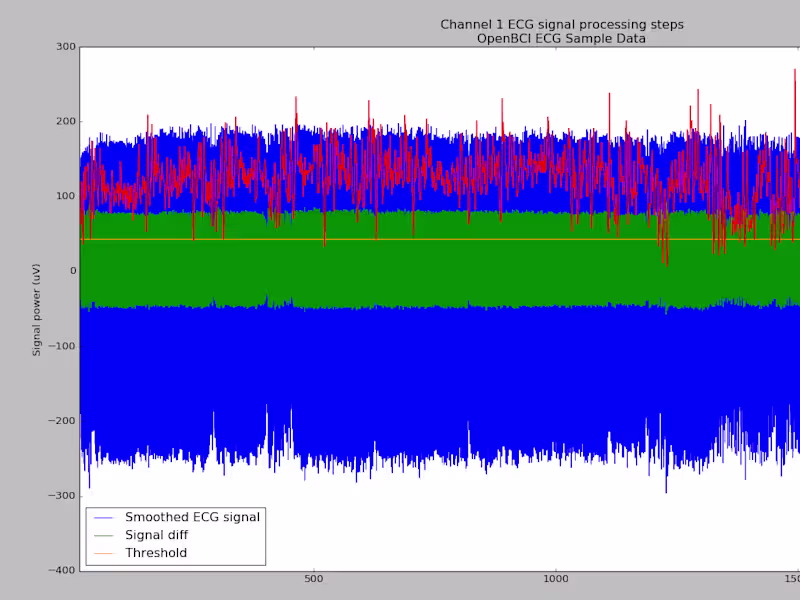
Decoding data patterns to reveal actionable business stories
Decoding data patterns to reveal actionable business stories
View more →
GIS | Data Analysis | Remote Sensing | Cartography
GIS | Data Analysis | Remote Sensing | Cartography

Remote Data Analyst | Excel, SQL, Power BI
Remote Data Analyst | Excel, SQL, Power BI
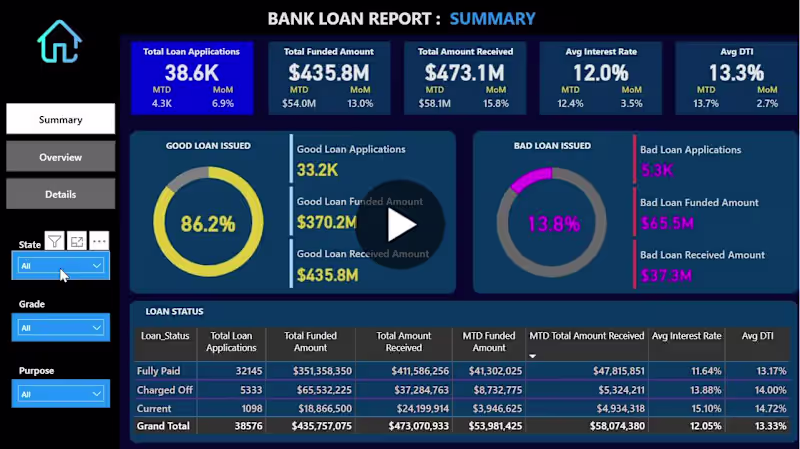
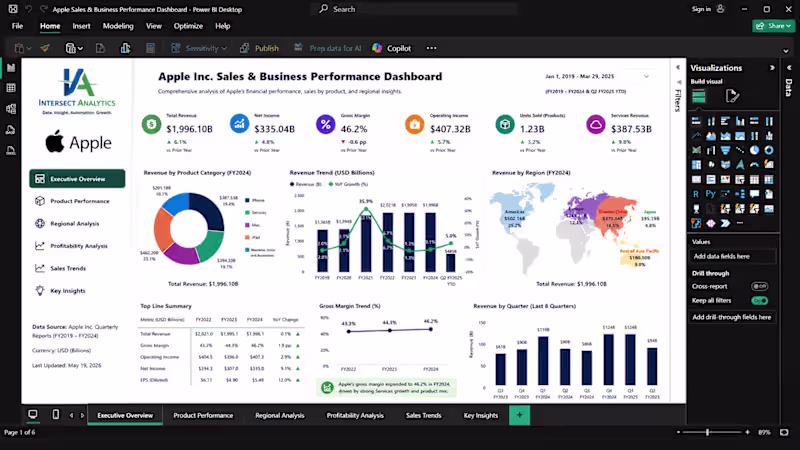
Turning Complex Data into Actionable Insights
Turning Complex Data into Actionable Insights


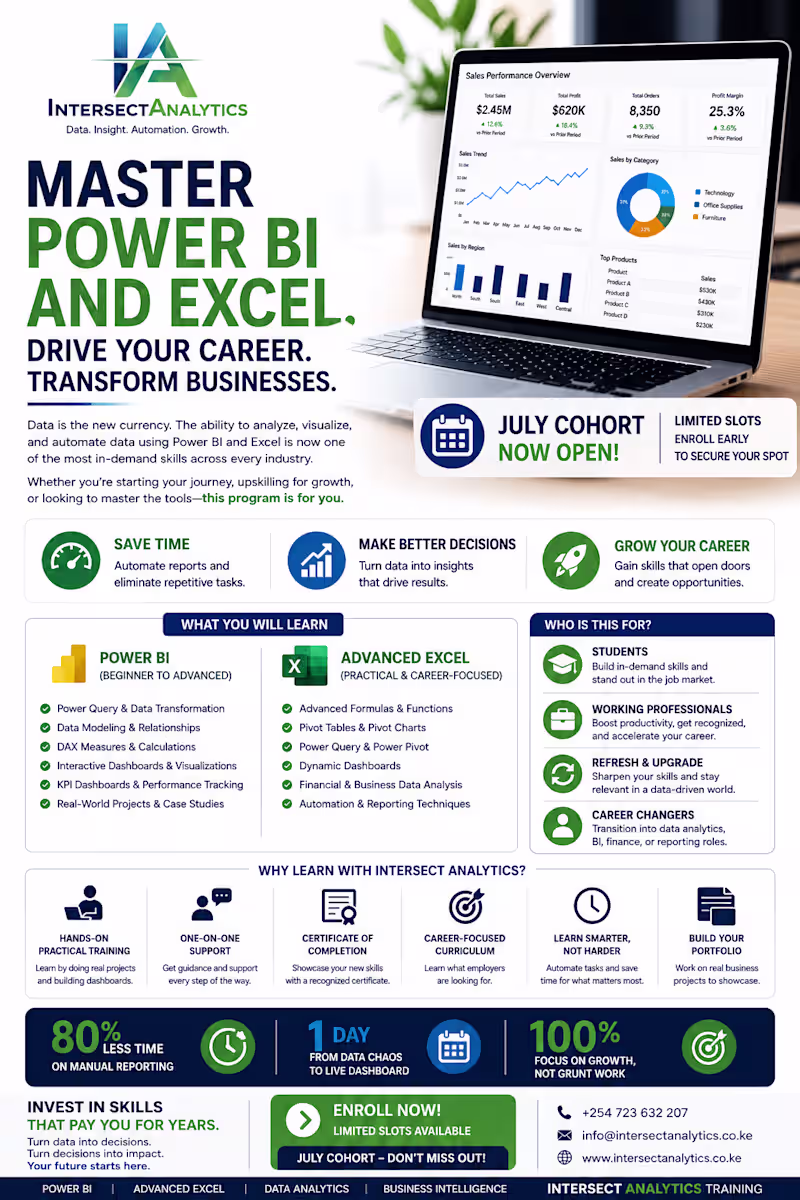
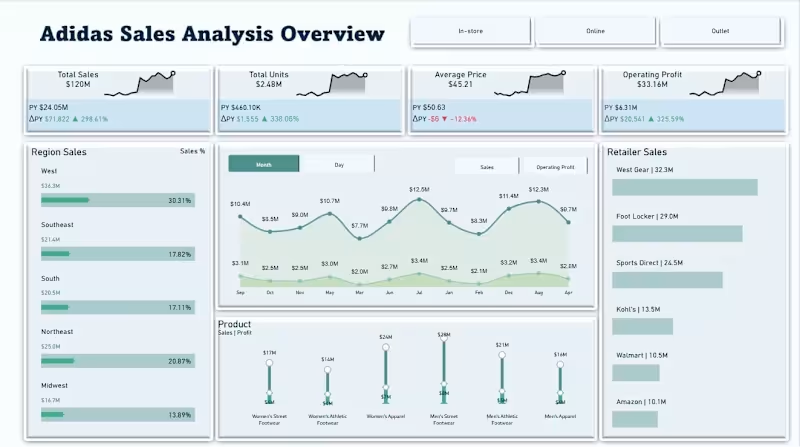
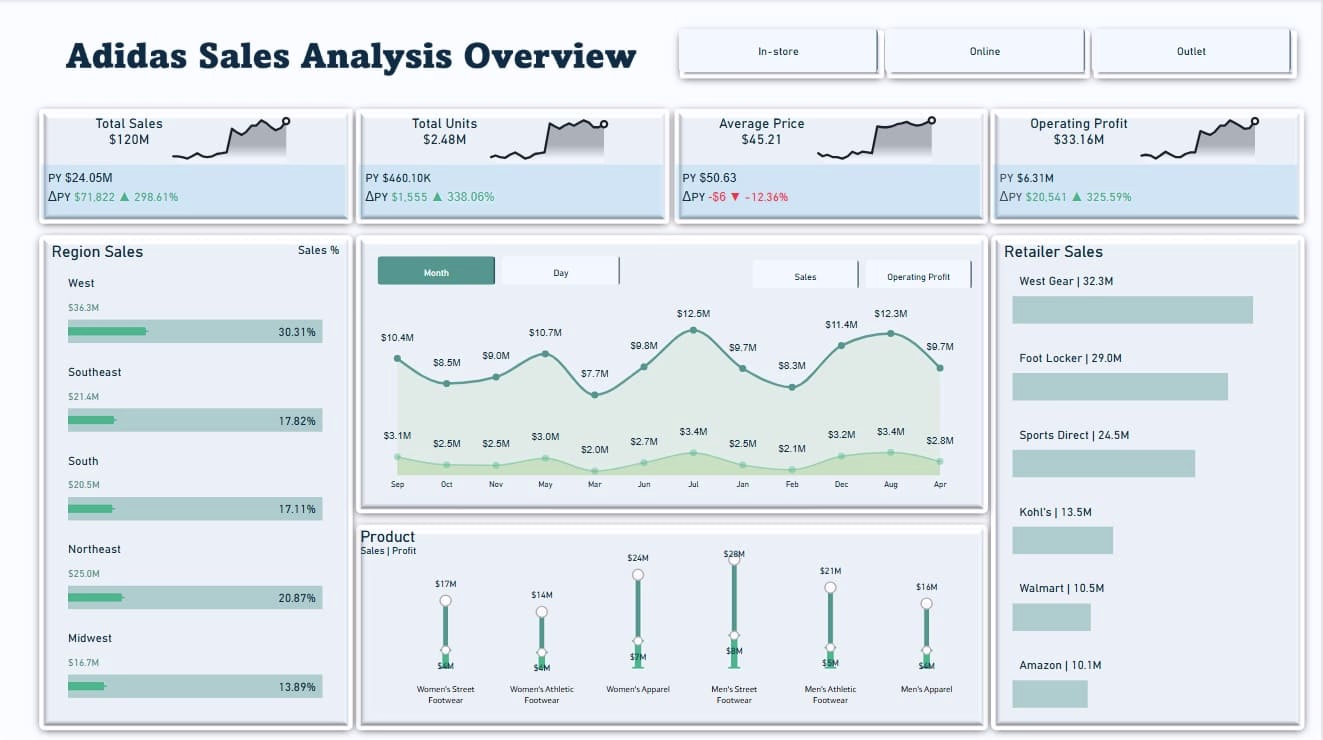
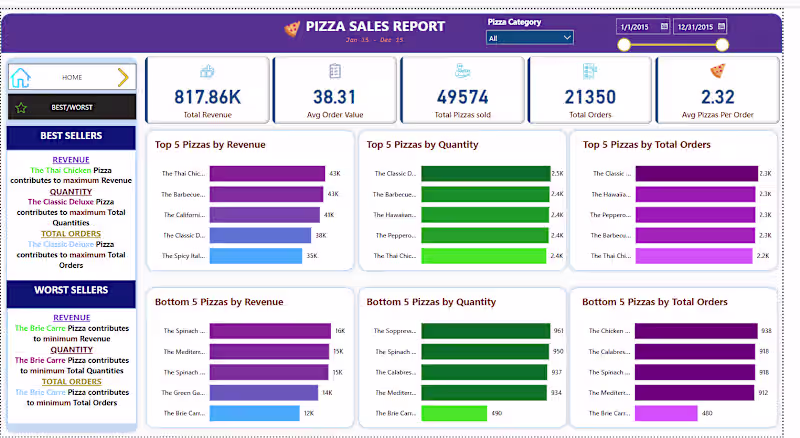
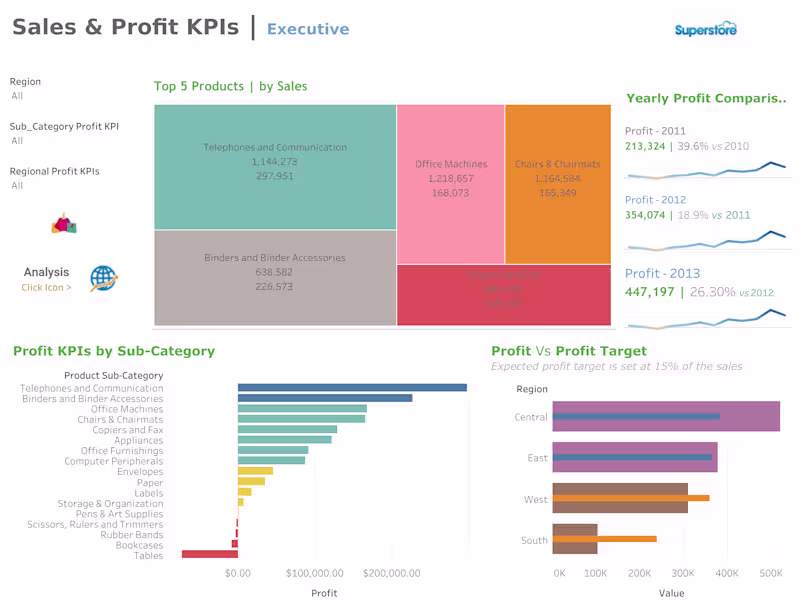
Empowering Businesses with Data Visuals
Empowering Businesses with Data Visuals
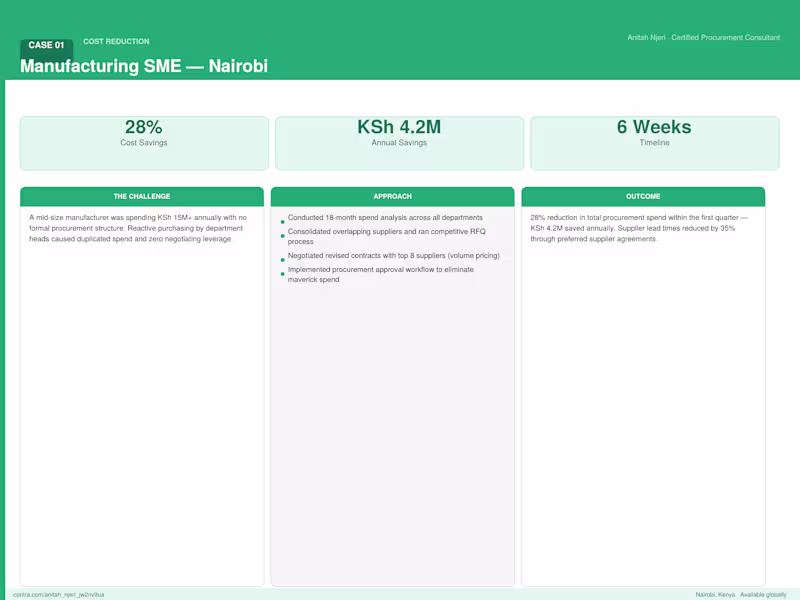
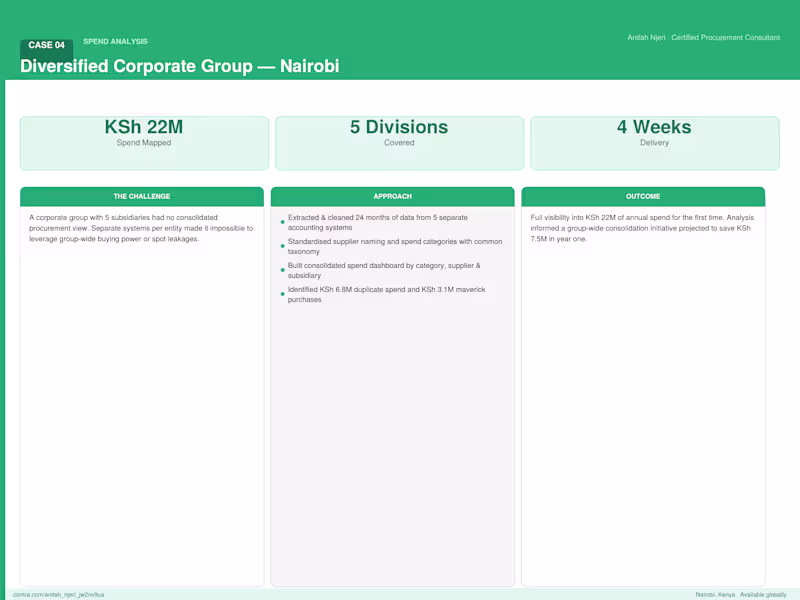
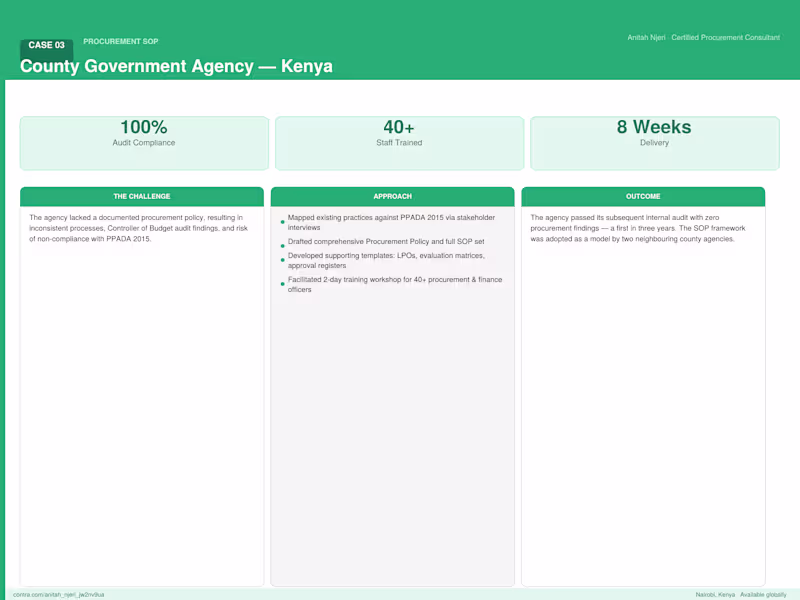
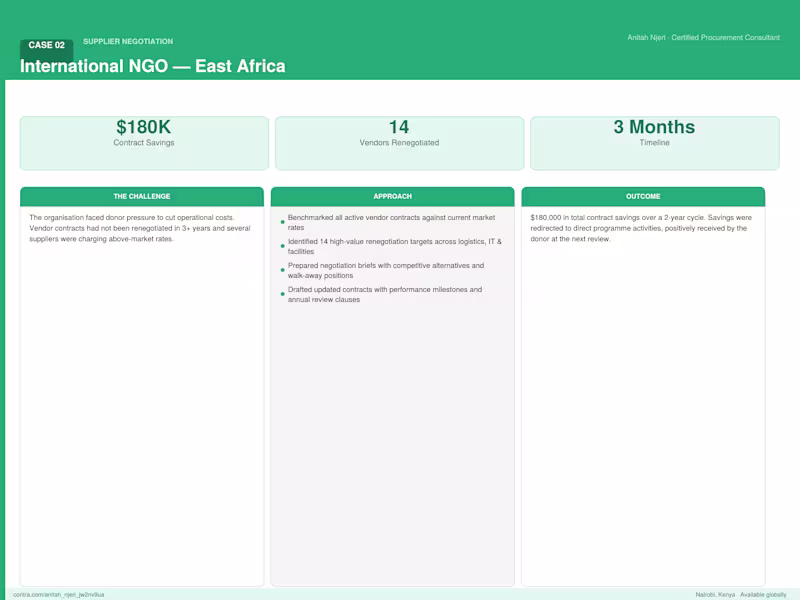
Certified Procurement Consultant | Cost Reduction Expert